LVHD: The ETF Is Worth Pursuing, But For Now, A Hold

Summary
- LVHD fishes for high-yielding, low-volatility stocks from the Russell 3000.
- We appreciate LVHD's policy of not just relying on backward-looking metrics.
- LVHD has done a better job than SPHD in not just delivering returns but juggling risk as well.
- The current risk-reward isn't too ideal for a long position.
JamesBrey
Adopts Useful Screeners To Pick Out Quality Yielders
The Franklin U.S. Low Volatility High Dividend Index ETF (NASDAQ:LVHD) is a $1bn sized product (by AUM), that focuses on a diversified pool of high-yielding stocks (around 125) that also exhibit low price and earnings volatility. Put another way, this can be looked upon as a product that would appeal to investors who are looking to add some reliable income-producing defensive tilt to their portfolios.
LVHD, which has been around since late 2015, differs from most other dividend-based ETFs that typically only use basic and superficial screeners that don't do a good enough job of weeding out poor-quality stocks.
LVHD doesn’t just go for high-yielding stocks from its basic universe (which is the Russell 3000), but also validates if these companies have the requisite earnings profile to pay their dividends.
The other useful facet of LVHD’s screening mechanism is that it isn’t entirely backward-looking, a recurring theme across the ETF industry. Rather, prospective stocks of LVHD need to have demonstrated profitability not just for the last 4 fiscal quarters as a whole, but even consensus forecasts for the next 4 quarters are considered, to determine if these companies will be in a position to generate positive earnings to support future dividends. All in all, prospective stocks that don't have the historical or forward earnings profile to support the dividends are excluded from consideration.
Once dividend sustainability is ascertained, the stocks are then measured and allocated ranks based on a composite score that captures their relative earnings and price volatility quotients. Earnings volatility is a function of both 3-year historical earnings as well as 2-year forward earnings, whereas price volatility is calculated on daily returns over the last 12 months. Needless to say, these Russell 3000 stocks with relatively low price and earnings volatility garner a higher composite score, resulting in larger weights, although individual weights are capped at 2.5% and thus, you’re not susceptible to concentration risks. To cap these weights, LVHD indulges in quarterly rebalancing (they follow a May calendar period), and in a couple of days (the first Wednesday of August), you will see another bout of rebalancing.
Better Than Its Larger Peer- SPHD
To get a better understanding of LVHD’s qualities we thought it would be useful to compare it against the largest low-vol, high-dividend option in this space- The Invesco S&P 500 High Dividend Low Volatility Portfolio ETF (SPHD) which has so far accumulated over $3.3bn in AUM and has been around since 2012.
Firstly, note that whilst LVHD fishes for stocks across a wider universe (the Russell 3000), and covers a larger number of stocks (125), SPHD is more specific (sticks to stocks from the S&P500) and focuses on a smaller pool (53 stocks). SPHD also doesn’t measure dividend sustainability (no desire to measure historic or forward earnings or the volatility quotient of those earnings), and only considers the historic yield whilst screening (although it does screen for price volatility, like LVHD.
It's fair to say that the market doesn’t like this half-baked approach of SPHD and that’s reflected in the return differential as it has lagged LVHD since the latter’s inception in 2015.
YCharts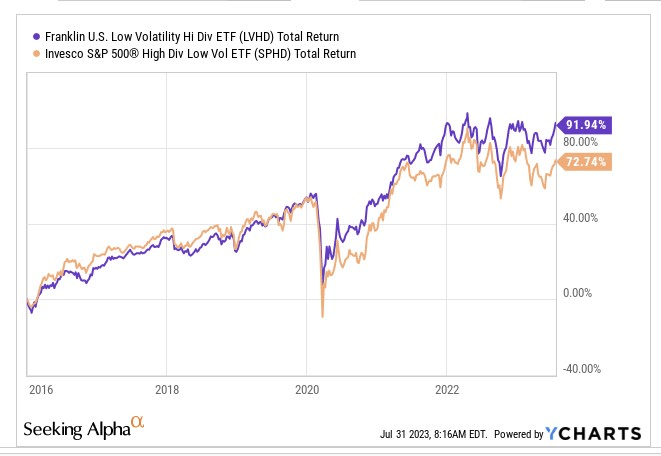
The superior return differential just tells one part of the story. We also think LVHD does a better job of juggling risk and delivering returns, and this is evident both on a 3-year, as well as a 5-year basis. Firstly, LVHD comes across as the less risky product of the two, with the annualized standard of monthly returns coming in 200-300bps lower than SPHD’s. Even as a hedge, LVHD could do a better job as it is less sensitive to the market’s movements of the benchmark (as exemplified by the lower betas).
Considering the lower standard deviation profile of SPHD, it doesn't need to generate a vastly superior threshold of excess returns (over the risk-free rate) to justify its risk, and that comes through via better Sharpe Ratios, particularly over the 5-year time frame.
Finally, since these are inherently defensive products, you also want them to protect your portfolio when the chips are down, and when we are in an environment of pronounced harmful volatility. Here too, we can see that LVHD has done a much better job during periods of downside deviation (as captured by a superior Sortino ratio differential).
Seeking Alpha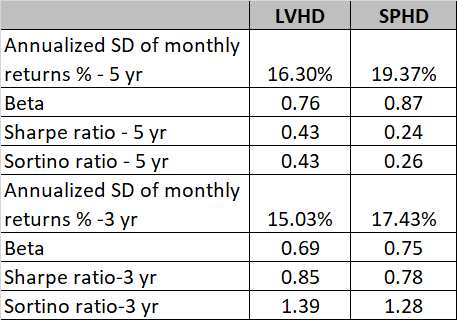
Closing Thoughts- Current Technical Landscape Dampens The Buy Case
As covered in the previous sections, we like how astute LVHD is in its screening protocols, and hitherto, we’ve also seen it do a better job than its more popular peer SPHD when it comes to juggling risk. However, we also recognize that some investors may feel underwhelmed by the relatively lower current yield; LVHD’s current yield of 3.25% is roughly 90bps lower than what SPHD offers.
From a valuation angle, both ETFs are almost identically priced, trading at less than 13.5x P/E (as per Morningstar), but if one switches to the charting dynamics, it looks like LVHD does not offer the most opportune risk-reward at this juncture.
The chart below measures LVHD’s strength as a function of SPHD, and what’s evident is that the former has continued to gain clout in lieu of the latter over time (note the upward-sloping blue line support). However, at this point, we can see that the LVHD:SPHD ratio is trading quite far away from not just the upward-sloping support, but also the mid-point of the long-term range, and could witness some mean-reversion in the months ahead.
StockCharts.com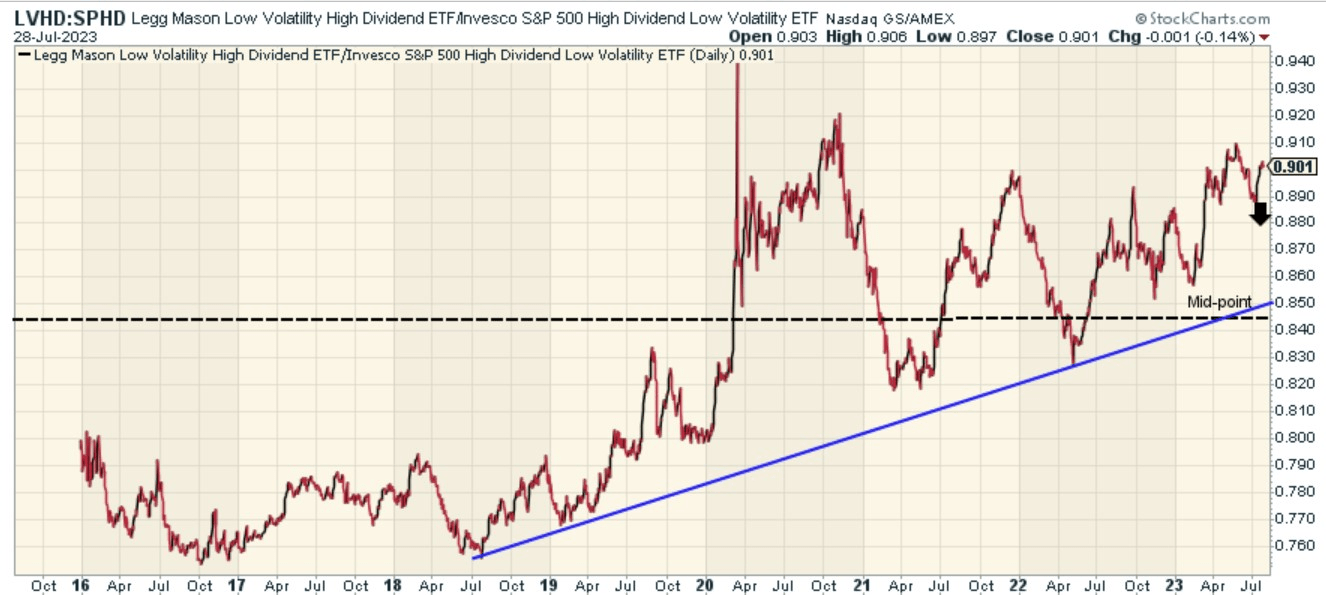
On LVHD's own weekly chart, the risk-reward doesn't look favorable either. Since peaking in April last year, the ETF has been trending lower in the shape of a descending broadening wedge. Currently the price action looks unfavorably perched close to the upper boundary of this wedge; traditionally we've seen how the price has almost always failed to kick-on when it hits the upper boundary, and last week we also saw a shooting star candle stick which does not bode well for further upside.
Investing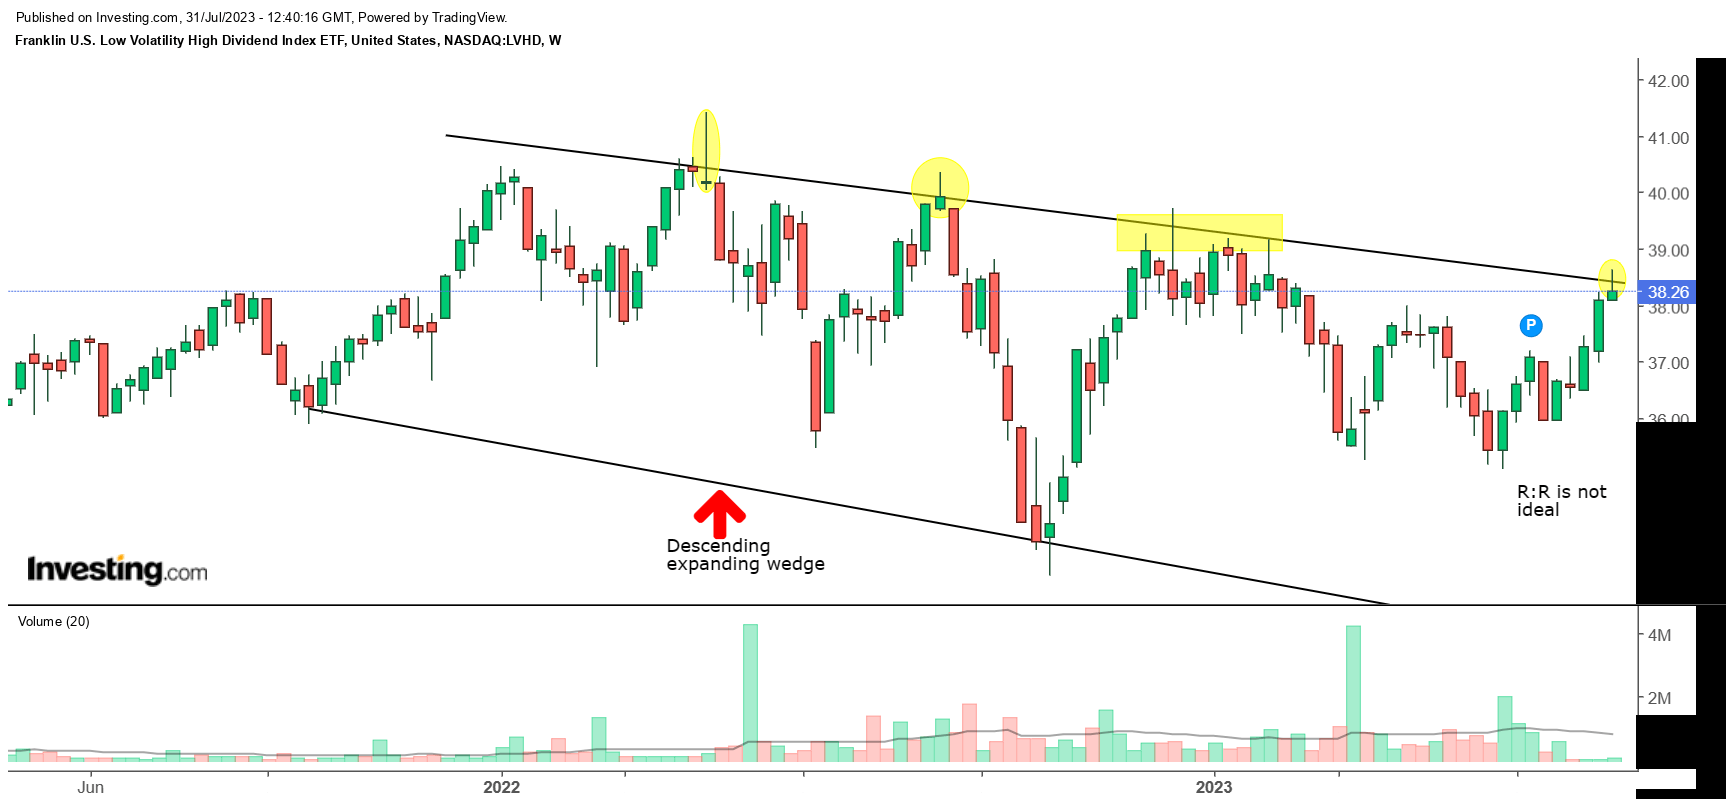
To conclude, we like LVHD’s qualities, but we think investors should wait for a correction before getting in.
This article was written by

Analyst’s Disclosure: I/we have no stock, option or similar derivative position in any of the companies mentioned, and no plans to initiate any such positions within the next 72 hours. I wrote this article myself, and it expresses my own opinions. I am not receiving compensation for it (other than from Seeking Alpha). I have no business relationship with any company whose stock is mentioned in this article.
Seeking Alpha's Disclosure: Past performance is no guarantee of future results. No recommendation or advice is being given as to whether any investment is suitable for a particular investor. Any views or opinions expressed above may not reflect those of Seeking Alpha as a whole. Seeking Alpha is not a licensed securities dealer, broker or US investment adviser or investment bank. Our analysts are third party authors that include both professional investors and individual investors who may not be licensed or certified by any institute or regulatory body.