VBK: Should Growth Investors Give Small-Caps Another Chance? (Rating Upgrade)

Summary
- The Vanguard Small-Cap Growth ETF has underperformed the Invesco QQQ ETF by 14.67% since June 2022, the date of my last review.
- At the time, VBK had a profitability and valuation problem. This article re-evaluates its fundamentals alongside QQQ and two other Vanguard growth funds.
- This article also provides annual returns for 28 growth ETFs between 2014-2023. VBK ranked in the fourth-quartile four times and was in the top 25% only once in 2016.
- Despite recent underperformance and a possibility, I wouldn't buy VBK right now. However, growth investors might find Vanguard's VOT to be a reasonable compromise between speculation and quality.
- Looking for a portfolio of ideas like this one? Members of Hoya Capital Income Builder get exclusive access to our subscriber-only portfolios. Learn More »
primeimages
Article Purpose
In June 2022, I wrote an article criticizing the Vanguard Small-Cap Growth Index Fund ETF Shares (NYSEARCA:VBK) and suggested growth investors select the higher-quality Invesco QQQ ETF (QQQ) instead. At the time, about one-third of VBK's constituents were not profitable, so its already-rich 29.18x forward earnings valuation was understated. Since then, VBK has lagged QQQ by 14.67%, and because of this massive differential, I want to re-evaluate VBK in search of a potential buying opportunity. I hope you enjoy the analysis.
VBK Overview
Strategy and Key Exposures
VBK tracks the CRSP US Small Cap Growth Index, selecting growth stocks based on six factors:
- Future long-term EPS growth
- Future short-term EPS growth
- Three-year historical EPS growth
- Three-year historical SPS growth
- Current Investment-Assets Ratio
- Return on Assets
CRSP's banding and migration method allows securities to appear in growth and value indexes, albeit with different weightings. The approach is for efficiency purposes, but there is only a 3% overlap with the Vanguard Small-Cap Value ETF (VBR), so it's not a major concern.
VBK's top ten holdings are below, led by Fair Isaac (FICO), Targa Resources (TRGP), and Exact Sciences (EXAS). However, like most small-cap funds, these holdings only represent a small portion of the portfolio.
Vanguard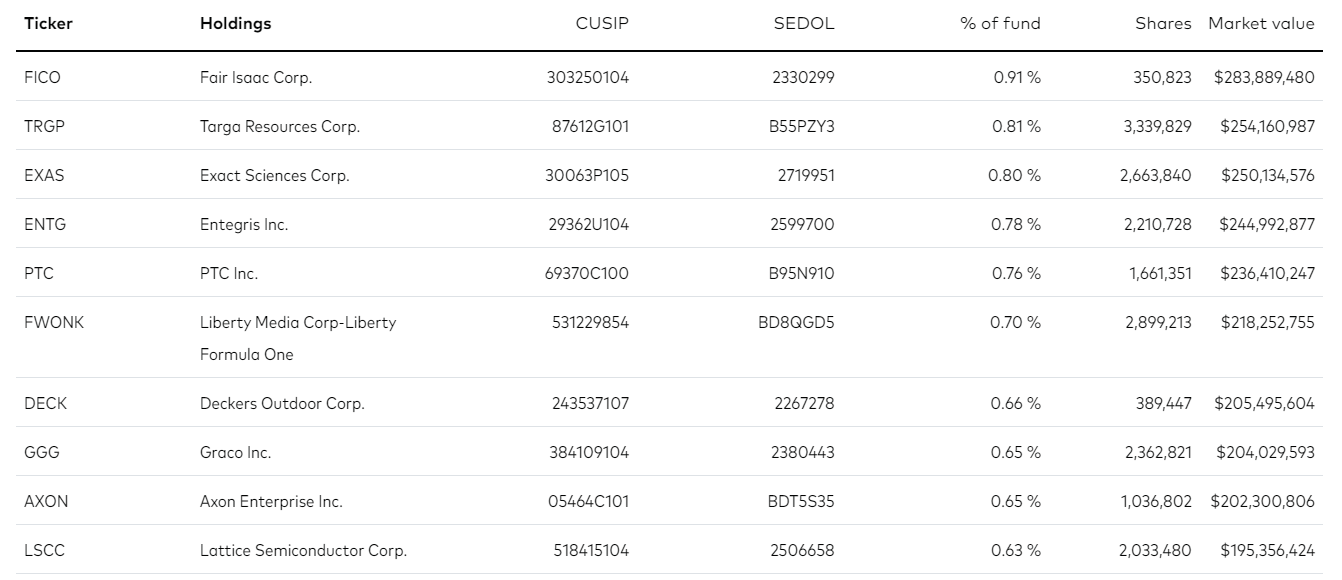
By sector, VBK's largest exposure areas are Technology (22.65%), Health Care (19.64%), and Industrials (18.63%). It starkly contrasts with the Vanguard Small-Cap Value ETF, which adds Financials at the expense of Technology. Unlike the Invesco QQQ ETF, which is nearly 50% Technology, both are well-diversified.
Morningstar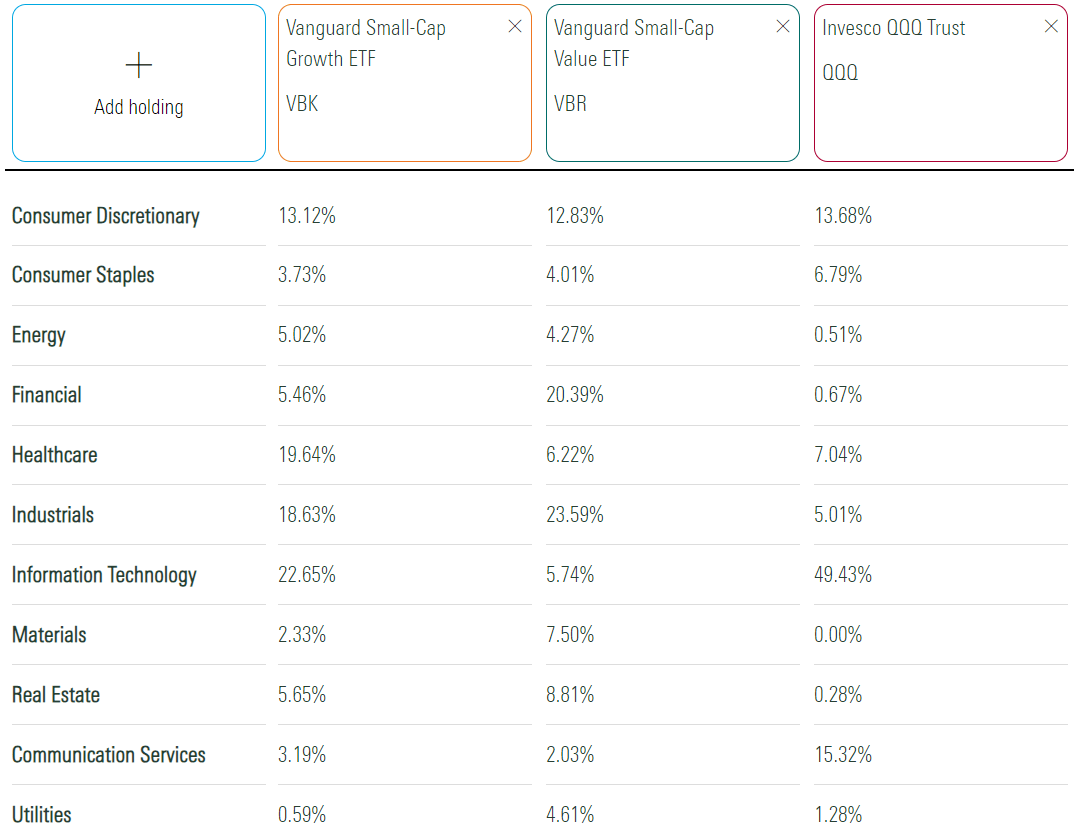
Long-Term Returns vs. VBR
VBK and VBR launched in January 2004. However, using historical returns for VISVX and VISGX, two no-load funds, we can see performance back to June 1998. As shown below, VBK and VISGX delivered an annualized 8.76% gain compared to 8.71% for VBR and VISVX. The small-cap growth funds had slightly higher volatility but a better maximum drawdown figure through the Great Financial Crisis.
Portfolio Visualizer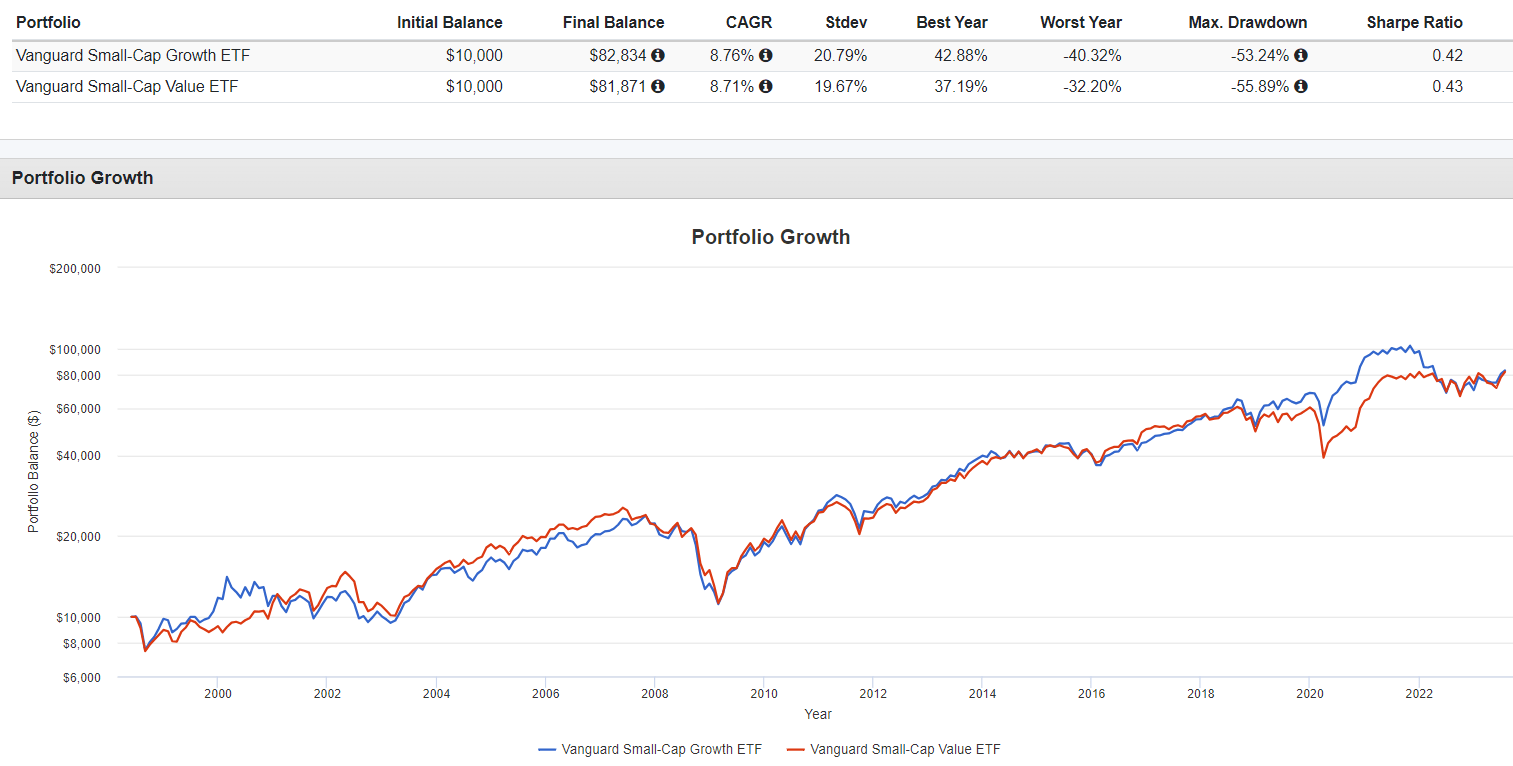
While interesting, a 25-year growth chart like the one above isn't helpful to most investors. Instead, consider these statistics I calculated based on annual returns from 1998-2023.
- VBK outperformed in 15/26 years (58%)
- VBK averaged a 9.24% beat when it outperformed
- VBK lagged by 11.13% on average when it underperformed
- VBK's best beat was in 2020 (29.56%)
- VBK's worst year was in 2021, when it lagged by 22.40%
- VBK's third worst year was in 2022, when it lagged by 19.08%
The last few years have been hectic. Not since the dot com bubble has there been such an abrupt changing of the guard from small-cap growth to small-cap value.
Performance Against Well-Established Growth ETFs
In addition to deciding between small-cap growth and small-cap value, readers should consider which size segment they should target (small, mid, and large). Previously, I suggested readers stick with the large-cap Invesco QQQ ETF. Although technically not limited to growth stocks, it is about 50% Technology, and its most significant holdings lean towards growth. As shown below, QQQ was a substantially better investment over the last ten years through June 2023, delivering an annualized 19.94% gain vs. 9.20% for VBK.
Portfolio Visualizer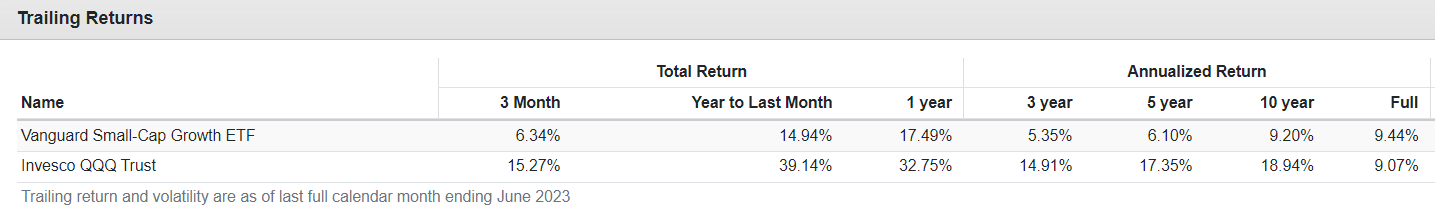
Since April 1999, VBK was the winner (9.44% vs. 9.07%), but only because of the disastrous dot com bubble crash, which saw QQQ decline by 73.33% between 2000-2002. That period is not particularly relevant, given how today's large-cap growth stocks are incredibly profitable.
Over the last ten years, VBK has underperformed QQQ and most other growth ETFs. To demonstrate, I've compiled a sample of the 28 small-, mid-, and large-cap growth ETFs with at least ten years of history and summarized their annual returns in the table below. Consider VBK's quartile ranking each year.
The Sunday Investor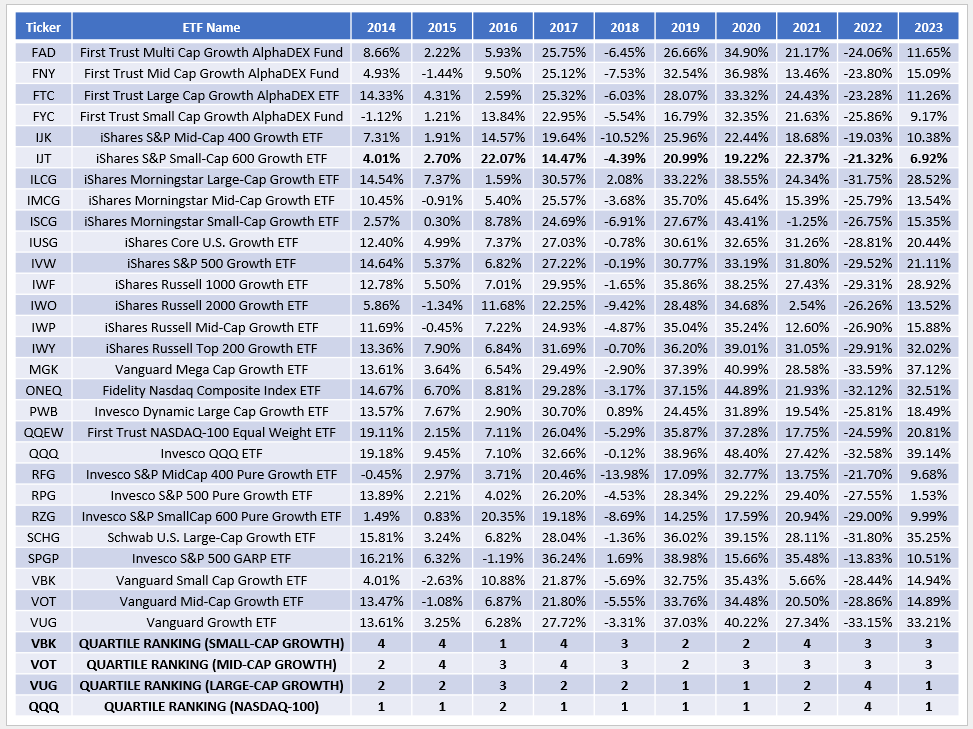
VBK ranked in the fourth-quartile four times compared to two and one for VOT and VUG, Vanguard's mid- and large-cap growth ETFs. QQQ had its worst year in a decade in 2022 but bounced back strongly in 2023. I owe this to the resiliency of its highly-profitable constituents, a feature many small-caps lack.
VBK Analysis
Profitability Problems Cause Underestimated Valuations
Last year, I reported the following profitability-related statistics for VBK:
- 30% had negative trailing operating cash flow (15% total weight)
- 82% didn't pay a dividend (71% of total weight)
- 58% had negative three-year EBITDA growth (40% of total weight)
- 27% had negative trailing EBITDA margins (18% of total weight)
- 34% had negative next-quarter EPS expectations (20% of total weight)
- 21% had a "D+" or worse Seeking Alpha Profit Grade (13% of total weight)
With negative earnings and negative earnings expectations, valuation ratios like price-earnings are less helpful. Providers like Morningstar exclude these companies from their calculations, and without the above statistics, it's easy to underestimate how pricy an ETF is. One workaround is to assign a P/E to the non-profitable stocks and re-calculate. Morningstar's cap is 60, and I'll provide adjusted calculations shortly to gauge VBK's valuation better. But first, here are the same statistics for VBK one year later:
- 30% had negative trailing operating cash flow (19% total weight)
- 75% didn't pay a dividend (65% of total weight)
- 54% had negative three-year EBITDA growth (38% of total weight)
- 29% had negative trailing EBITDA margins (19% of total weight)
- 33% had negative next-quarter EPS expectations (20% of total weight)
- 22% had a "D+" or worse Seeking Alpha Profit Grade (12% of total weight)
In my view, VBK's profitability metrics deteriorated. While the same number of companies have negative trailing operating cash flow, their influence is greater than before (19% vs. 15%). More of the ETF pays a dividend, and EBITDA growth slightly improved. Still, we're in a similar position where quality is sub-par. Keep these metrics in mind as we go through VBK's fundamentals.
VBK Fundamentals By Industry
The following table summarizes several key fundamental metrics for VBK's top 25 industries, totaling 64% of the portfolio. This level of diversification is solid compared to VOT, VUG, and QQQ.
The Sunday Investor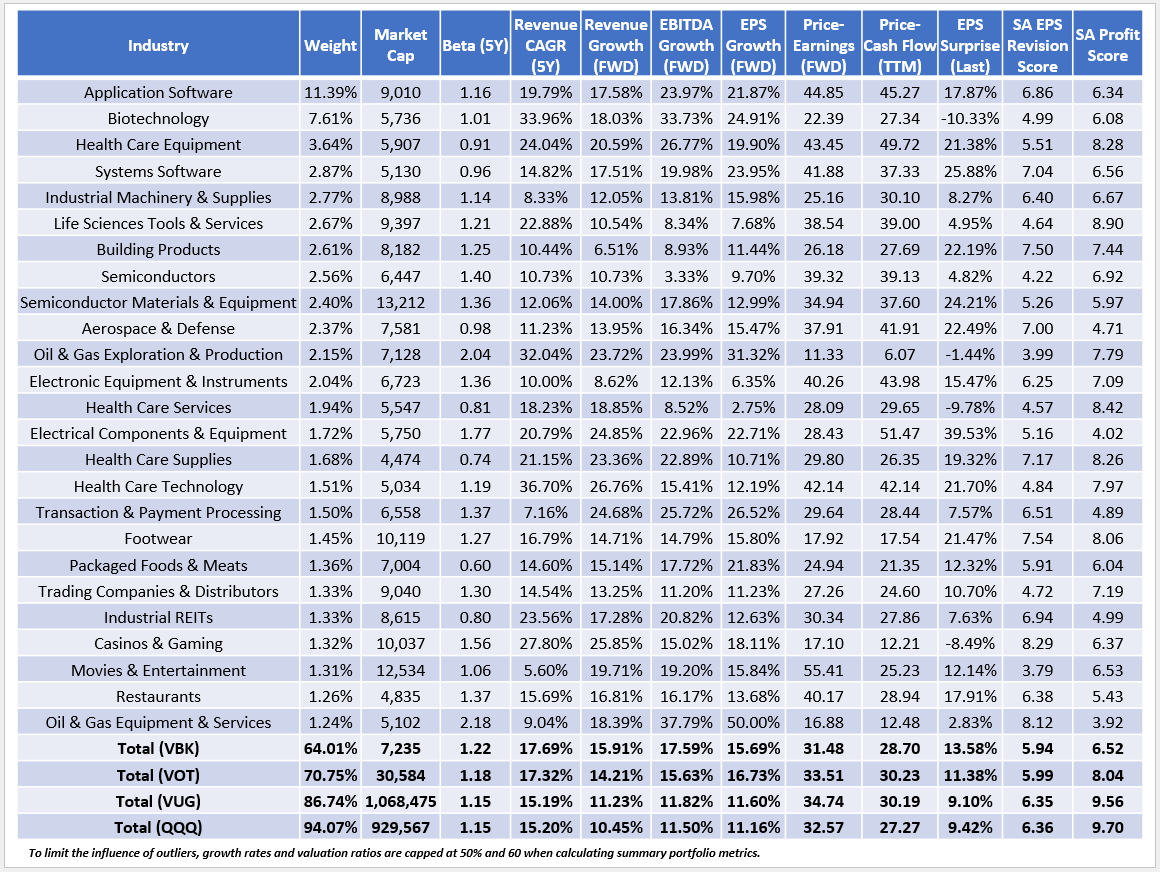
VBK features the best estimated sales and EBITDA growth (15.91% and 17.59%) and is about 4.5% better than VUG and QQQ on estimated earnings per share growth. Application Software and Biotechnology are great examples, with 20%+ earnings growth and a 19% combined total weight. VOT, VUG, and QQQ only have a combined 11.19%, 5.53%, and 7.52% weight, so VBK works for growth investors looking to diversify into these industries.
However, as I mentioned earlier, VBK's quality could be better. Using Seeking Alpha Factor Grades, I calculated a 6.52/10 Profit Score compared to 8.04/10, 9.56/10, and 9.70/10 for VOT, VUG, and QQQ. It's a significant gap and ties nicely with the valuation issue. VBK's weighted-average forward P/E is 31.48x, but only 77.47% of the ETF by weight has positive estimated earnings. If we applied Morningstar's cap of 60 to the remainder, VBK's forward P/E would jump to 37.91x. Here are the adjusted calculations for the other three funds:
- VOT: 33.51x to 34.82x (95.04% positive estimated earnings)
- VUG: 34.74x to 35.15x (98.36% positive estimated earnings)
- QQQ: 32.57x to 32.96x (98.56% positive estimated earnings)
Instead of VBK looking cheap by comparison, it's now the most expensive. It's a reminder that there are rarely any free lunches in investing. There are always sacrifices, and in VBK's case, its excellent growth rate comes at the expense of a high valuation and poor quality.
Investment Recommendation
VBK remains a relatively low-quality growth ETF, and I don't recommend readers initiate a position. Instead, consider VOT, which features a cheaper adjusted forward P/E (34.82x vs. 37.91x), 1% more estimated earnings per share growth, and a substantially better 8.04/10 Profit Score where 95% of constituents have positive estimated earnings. It's also a reasonable way to transition out of potentially overvalued large-cap growth stocks without moving too much to the speculative side of investing. I hope you enjoyed this article, and as always, I look forward to your comments below.
The Sunday Investor Joins Income Builder
The Sunday Investor has teamed up with Hoya Capital to launch the premier income-focused investing service on Seeking Alpha. Members receive complete early access to our articles along with exclusive income-focused model portfolios and a comprehensive suite of tools and models to help build sustainable portfolio income targeting premium dividend yields of up to 10%.
Whether your focus is High Yield or Dividend Growth, we’ve got you covered with actionable investment research focusing on real income-producing asset classes that offer potential diversification, monthly income, capital appreciation, and inflation hedging. Start A Free 2-Week Trial Today!

This article was written by

I perform independent fundamental analysis for over 850 U.S. Equity ETFs and aim to provide you with the most comprehensive ETF coverage on Seeking Alpha. My insights into how ETFs are constructed at the industry level are unique rather than surface-level reviews that’s standard on other investment platforms. My deep-dive articles always include a set of alternative funds, and I am active in the comments section and ready to answer your questions about the ETFs you own or are considering.
My qualifications include a Certificate in Advanced Investment Advice from the Canadian Securities Institute, the completion of all educational requirements for the Chartered Investment Manager (CIM) designation, and a Bachelor of Commerce degree with a major in Accounting. In addition, I passed the CFA Level 1 Exam and am on track to become licensed to advise on options and derivatives in 2023. In November 2021, I became a contributor for the Hoya Capital Income Builder Marketplace Service and manage the "Active Equity ETF Model Portfolio", which as a total return objective. Sign up for a free trial today! Hoya Capital Income Builder.
Analyst’s Disclosure: I/we have no stock, option or similar derivative position in any of the companies mentioned, and no plans to initiate any such positions within the next 72 hours. I wrote this article myself, and it expresses my own opinions. I am not receiving compensation for it (other than from Seeking Alpha). I have no business relationship with any company whose stock is mentioned in this article.
Seeking Alpha's Disclosure: Past performance is no guarantee of future results. No recommendation or advice is being given as to whether any investment is suitable for a particular investor. Any views or opinions expressed above may not reflect those of Seeking Alpha as a whole. Seeking Alpha is not a licensed securities dealer, broker or US investment adviser or investment bank. Our analysts are third party authors that include both professional investors and individual investors who may not be licensed or certified by any institute or regulatory body.