OUSM: Beating The Benchmark And Competitors

Summary
- O'Shares U.S. Small-Cap Quality Dividend ETF is invested in 116 dividend small caps with quality characteristics.
- It is well-diversified across holdings, but overweight in industrials and financials.
- Valuation ratios are expensive, but quality metrics are excellent.
- It has outperformed the Russell 2000 and popular competitors.
- Quantitative Risk & Value members get exclusive access to our real-world portfolio. See all our investments here »
syahrir maulana
This article series aims at evaluating ETFs (exchange-traded funds) regarding past performance and portfolio metrics. Reviews with updated data are posted when necessary.
OUSM strategy and portfolio
O'Shares U.S. Small-Cap Quality Dividend ETF (BATS:OUSM) started investing operations on 12/30/2016 and has been tracking the O'Shares U.S. Small-Cap Quality Dividend Index since 06/1/2020. The fund has already changed twice underlying indexes, on 05/04/2018 and 05/31/2020, as reported by ALPS Advisors. It has 116 holdings, a distribution yield of 2.02% and a total expense ratio of 0.48%. Distributions are paid monthly.
As described on O'Shares website, the index follows a strategy picking stocks in the S-Network US Equity Mid/Small-Cap 2500 Index based on rules using 4 factors: quality, low volatility, dividend yield and dividend quality. Stocks must also meet requirements in free float and average trading volume. The index is reconstituted annually and rebalanced quarterly, with constraints regarding sector exposure and a maximum weight of 2% in any constituent.
OUSM invests almost exclusively in U.S. companies (99% of asset value). The top two sectors are industrials (28.4%) and financials (24.2%). Technology and consumer discretionary are between 12% and 14%. Other sectors are below 8%. Compared to the small-cap benchmark Russell 2000 (IWM), the fund overweights its top 2 sectors. It underweights healthcare, and ignores energy, materials and real estate.
Sector breakdown (Chart: author; data: ALPS Advisors)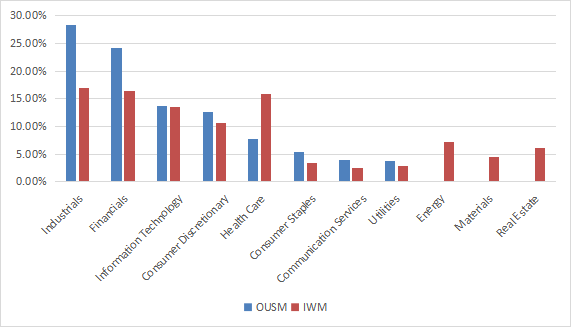
The top 10 holdings, listed below with fundamental ratios, represent 23.4% of asset value. The largest holding weighs 2.64%, so risks related to individual companies are low.
Ticker | Name | Weight | EPS growth %TTM | P/E TTM | P/E fwd | Yield% |
Lincoln Electric Holdings, Inc. | 2.64% | 34.45 | 24.36 | 21.99 | 1.29 | |
Watsco, Inc. | 2.42% | 24.95 | 24.94 | 26.16 | 2.60 | |
Encompass Health Corp. | 2.36% | -31.20 | 24.58 | 20.65 | 0.91 | |
Houlihan Lokey, Inc. | 2.34% | -39.04 | 26.32 | 21.99 | 2.22 | |
A. O. Smith Corp. | 2.33% | -45.13 | 40.44 | 20.23 | 1.66 | |
Old Republic International Corp. | 2.28% | -19.02 | 10.57 | 11.38 | 7.17 | |
National Instruments Corp. | 2.27% | 71.11 | 43.55 | 23.88 | 1.90 | |
Gentex Corp. | 2.25% | 15.44 | 21.11 | 19.13 | 1.46 | |
Snap-on, Inc. | 2.25% | 13.10 | 15.08 | 14.68 | 2.38 | |
Graco, Inc. | 2.21% | 15.79 | 26.91 | 26.36 | 1.19 |
Historical performance
The next table compares performance and risk metrics since January 2017 of OUSM, IWM and three small cap dividend funds:
- WisdomTree U.S. SmallCap Dividend Fund (DES)
- ProShares Russell 2000 Dividend Growers ETF (SMDV)
- WisdomTree U.S. SmallCap Quality Dividend Growth Fund (DGRS)
OUSM is the best performer in return and risk-adjusted performance (Sharpe ratio). It is second in safety regarding drawdown and volatility measures.
since 1/4/2017 | Total Return | Annual Return | Drawdown | Sharpe ratio | Volatility |
OUSM | 67.31% | 8.15% | -39.84% | 0.44 | 18.98% |
IWM | 54.91% | 6.89% | -41.13% | 0.33 | 21.65% |
DES | 31.04% | 4.20% | -45.67% | 0.22 | 21.90% |
SMDV | 32.01% | 4.32% | -34.12% | 0.23 | 16.38% |
DGRS | 51.96% | 6.58% | -44.83% | 0.32 | 22.07% |
However, this time interval covers three periods with different underlying indexes. It may be more appropriate to look at a shorter time frame. In the last 12 months, OUSM still is ahead of its competitors and the benchmark:
OUSM vs. IWM and competitors, last 12 months ( Seeking Alpha)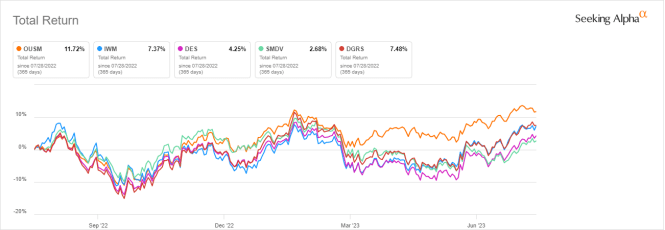
In previous articles, I have shown how three factors may help cut the risk in a dividend portfolio: Return on Assets, Piotroski F-score, and Altman Z-score.
The next table compares OUSM since inception with a subset of the S&P 500: stocks with above-average dividend yield and ROA, good Altman Z-score and Piotroski F-score, and a sustainable payout ratio. It is rebalanced annually to make it comparable to a passive index.
Total Return | Annual Return | Drawdown | Sharpe ratio | Volatility | |
OUSM | 67.31% | 8.15% | -39.84% | 0.44 | 18.98% |
Dividend quality subset | 120.08% | 12.76% | -34.95% | 0.67 | 17.25% |
Past performance is not a guarantee of future returns. Data Source: Portfolio123
The dividend quality subset beats OUSM by over 4.6 percentage points in annualized. However, the fund's performance is real, whereas the subset is simulated. My core portfolio holds 14 stocks selected in this subset (more info at the end of this post).
Scanning OUSM portfolio
OUSM is much more expensive than the Russell 2000 regarding the usual valuation ratios, as reported in the next table.
OUSM | IWM | |
Price/Earnings | 17.32 | 11.5 |
Price/Book | 2.95 | 1.83 |
Price/Sales | 1.44 | 1.11 |
Price/Cash Flow | 14.16 | 8.55 |
The fund holds 116 stocks. I have scanned them with my preferred quality metrics, considering that risky stocks are companies with at least 2 red flags: bad Piotroski score, negative ROA, unsustainable payout ratio, bad or dubious Altman Z-score, excluding financials and real estate where these metrics are unreliable. With these assumptions, 15 holdings are risky, and they weigh only 8.8% of asset value, which is a good point.
Based on my calculations reported in the next table, the aggregate Altman Z-score, Piotroski F-score and return on assets are better than for the Russell 2000. These metrics point to a portfolio quality superior to the small-cap benchmark.
OUSM | IWM | |
Atman Z-score | 5.21 | 2.8 |
Piotroski F-score | 5.49 | 4.45 |
ROA % TTM | 8.96 | -0.25 |
Takeaway
O'Shares U.S. Small Cap Quality Dividend ETF is invested in 116 dividend small caps with quality and low-volatility characteristics. It is well-diversified across holdings, but overweight in industrials and financials. It is materially more expensive than the small cap benchmark Russell 2000 regarding valuation ratios, but quality metrics are much better. It has outperformed the Russell 2000 and popular competitors since inception and in the last 12 months. Moreover, quality screening results in a lower risk measured in drawdown and volatility.
Quantitative Risk & Value (QRV) features data-driven strategies in stocks and closed-end funds outperforming their benchmarks since inception. Get started with a two-week free trial now.

This article was written by

Step up your investing experience: try Quantitative Risk & Value for free now (limited offer).
I am an individual investor and an IT professional, not a finance professional. My writings are data analysis and opinions, not investment advice. They may contain inaccurate information, despite all the effort I put in them. Readers are responsible for all consequences of using information included in my work, and are encouraged to do their own research from various sources.
Analyst’s Disclosure: I/we have no stock, option or similar derivative position in any of the companies mentioned, and no plans to initiate any such positions within the next 72 hours. I wrote this article myself, and it expresses my own opinions. I am not receiving compensation for it (other than from Seeking Alpha). I have no business relationship with any company whose stock is mentioned in this article.
Seeking Alpha's Disclosure: Past performance is no guarantee of future results. No recommendation or advice is being given as to whether any investment is suitable for a particular investor. Any views or opinions expressed above may not reflect those of Seeking Alpha as a whole. Seeking Alpha is not a licensed securities dealer, broker or US investment adviser or investment bank. Our analysts are third party authors that include both professional investors and individual investors who may not be licensed or certified by any institute or regulatory body.