Bank Credit Continues To Quietly Tighten: Will The Market Wake Up?

Summary
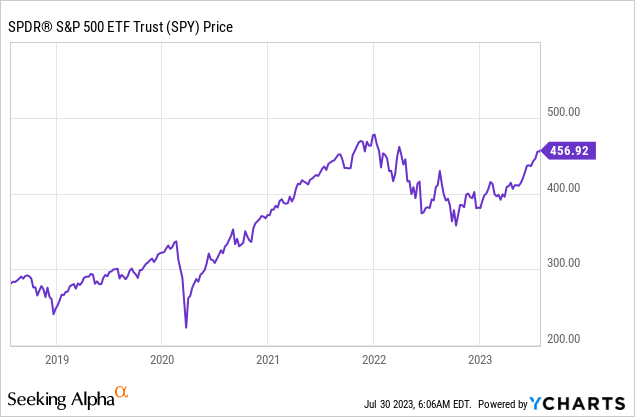
- The S&P 500 is up 20% for the year despite earnings being down, and investors are partying like it's 1999.
- However, credit is becoming more expensive and harder to obtain, which historically has been a sign of an upcoming economic downturn.
- Tightening credit conditions in the housing market and auto loan market suggest potential problems in these sectors.
- Large-cap US stocks are at the 95th percentile compared with historical valuations, and earnings are now no longer supported by ZIRP or tax cuts.
- Something's gotta give.

glebchik/iStock via Getty Images
As of my writing this, the S&P 500 (SPY) is up 20% for the year, even while earnings are down. The animal spirits are alive and well. Once-skeptical investors are increasingly shipping all their money in, and large-cap equity valuations have risen back to levels roughly corresponding with 95th-percentile historical levels. Consumer spending is running hot and out of equilibrium. US savings rates are near record lows, spending growth is outpacing wages, wages are outpacing productivity, and inflation is well above the government's target. The job therefore falls to the Federal Reserve to help bring supply and demand back into balance. The Fed is doing this by raising interest rates and draining cash out of the system. Leading economic indicators indicate that the tightening is working and that a big economic slowdown is coming. Emboldened stock bulls have huge paper gains and zero respect for the Fed. However, if changes in credit are to be believed, traders may not want to be fighting Jerome Powell and the Fed's tightening campaign.
Credit Is Getting More Expensive And Harder To Get
In the US and major economies in Europe, quarterly surveys are showing that credit is increasingly hard to come by. In the past, tightening credit has been a clear indicator of a coming economic downturn. This is fairly intuitive because if prices of homes and cars are out of line with wages and credit dries up, then there's nowhere for prices to go but down. There aren't many signs of a crunch for credit cards yet, but there too I wonder how much consumers can run up before it starts to bite. Credit card debt just hit a trillion dollars in the US.
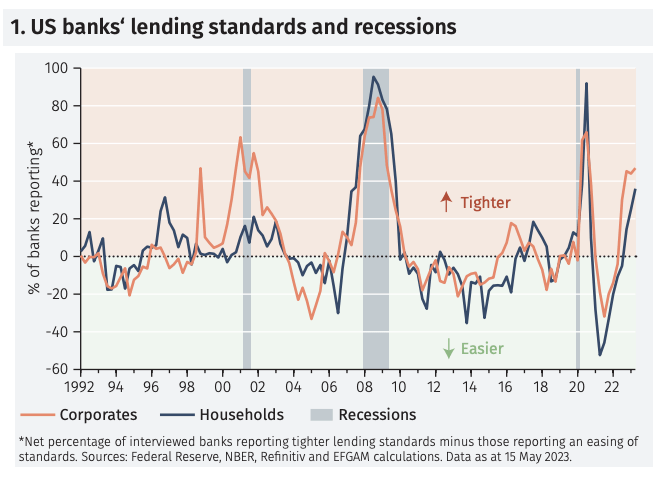
US Lending Standards (EFG International)
The Main Event: Housing Market Credit
Data on lending conditions tends to be reported infrequently and with a lag, but a shorthand trick I have for gauging lending conditions is to compare jumbo mortgages with conventional Fannie/Freddie mortgages. The idea here is that prices for jumbo mortgages are set by the market, while prices for conventional mortgages are set by the US government's actuaries pricing the risk. Here we see that credit likely has continued to steadily tighten.
Here's what we've got, data courtesy of Mortgage News Daily.
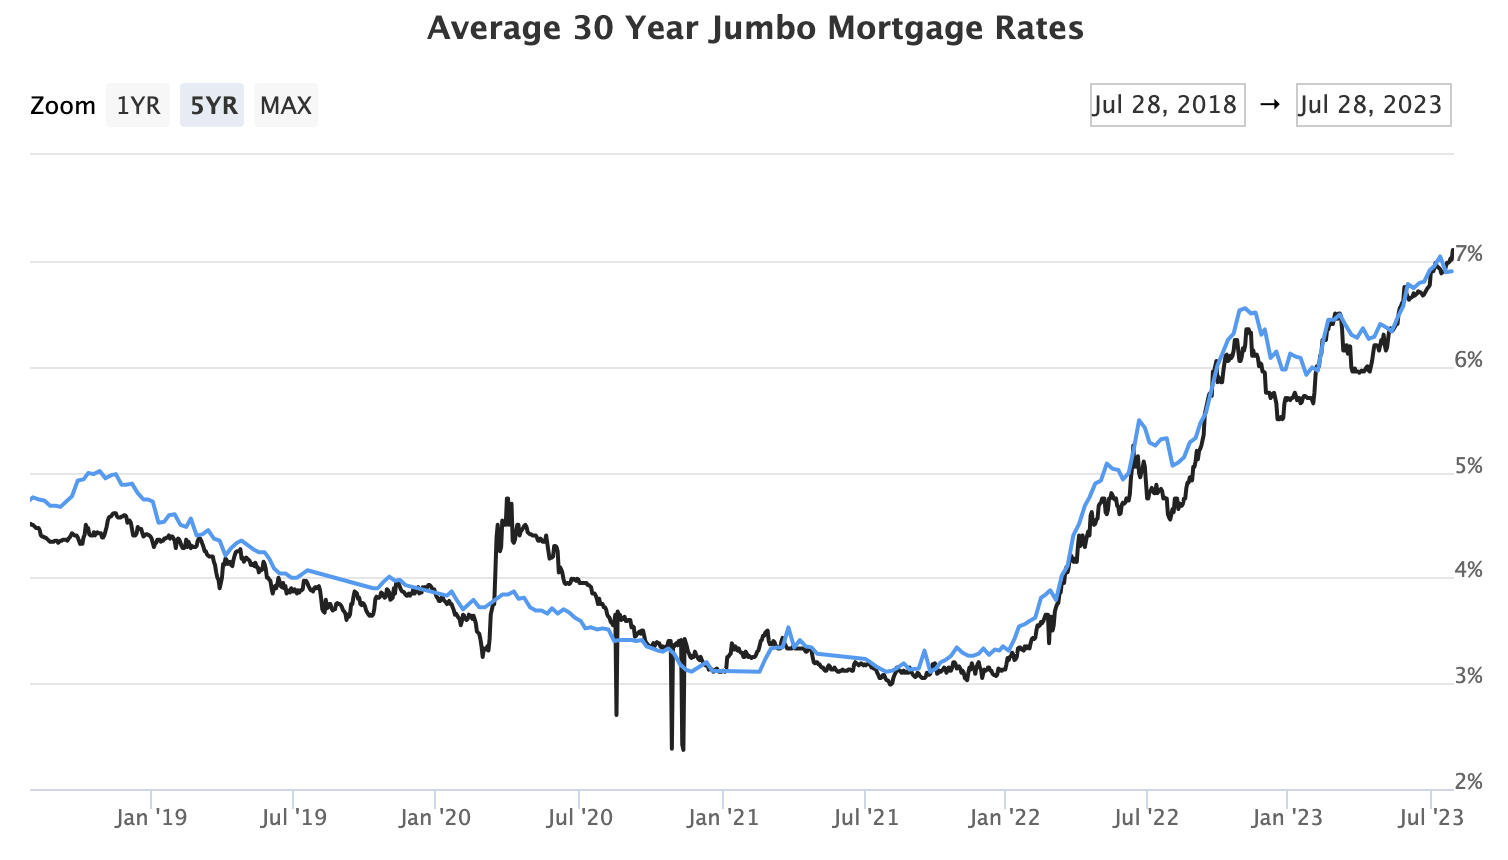
Jumbo Mortgage Rates (Mortgage News Daily)
1 year ago, jumbo mortgages were at 4.57%. Conventional mortgages were 5.13%. These numbers come from surveys, so they're approximate, but the indicated spread of jumbo mortgages was -56 bps for jumbos. Today, jumbos are at 7.10%, while conventional mortgages are at 7.05%. That's a much higher rate and a spread of +5 bps. This change really kicked into gear in the past few months. On March 1st, the spread was still -49 bps. Jumbo mortgages are also anecdotally much harder to get. The Fed has signaled that they're going to hike once more, so the squeeze is likely just getting started. In 2008, jumbos hit 8% when lending dried up, and we're now only 90 bps away from that same peak. Economywide, how many people are able to pay $80,000 per year in interest for a million-dollar mortgage? Not many! How many people could pay $30,000 per year in interest in 2021? Lots of people could, especially if they saw their neighbors and friends doing it! This is the business cycle in action. Survey after survey is now showing that credit is harder to get, and even those who can qualify are thinking twice.
Some people are going to go for it anyway and pay any DTI they can get approved for. And about 20-25% of US buyers pay cash. But millions of people aren't, which is why existing home sales and mortgage applications in the US are at or below their 2008 recession lows. And for those who are buying homes, DTI ratios are now at 40%, above even the 2007 bubble peak.
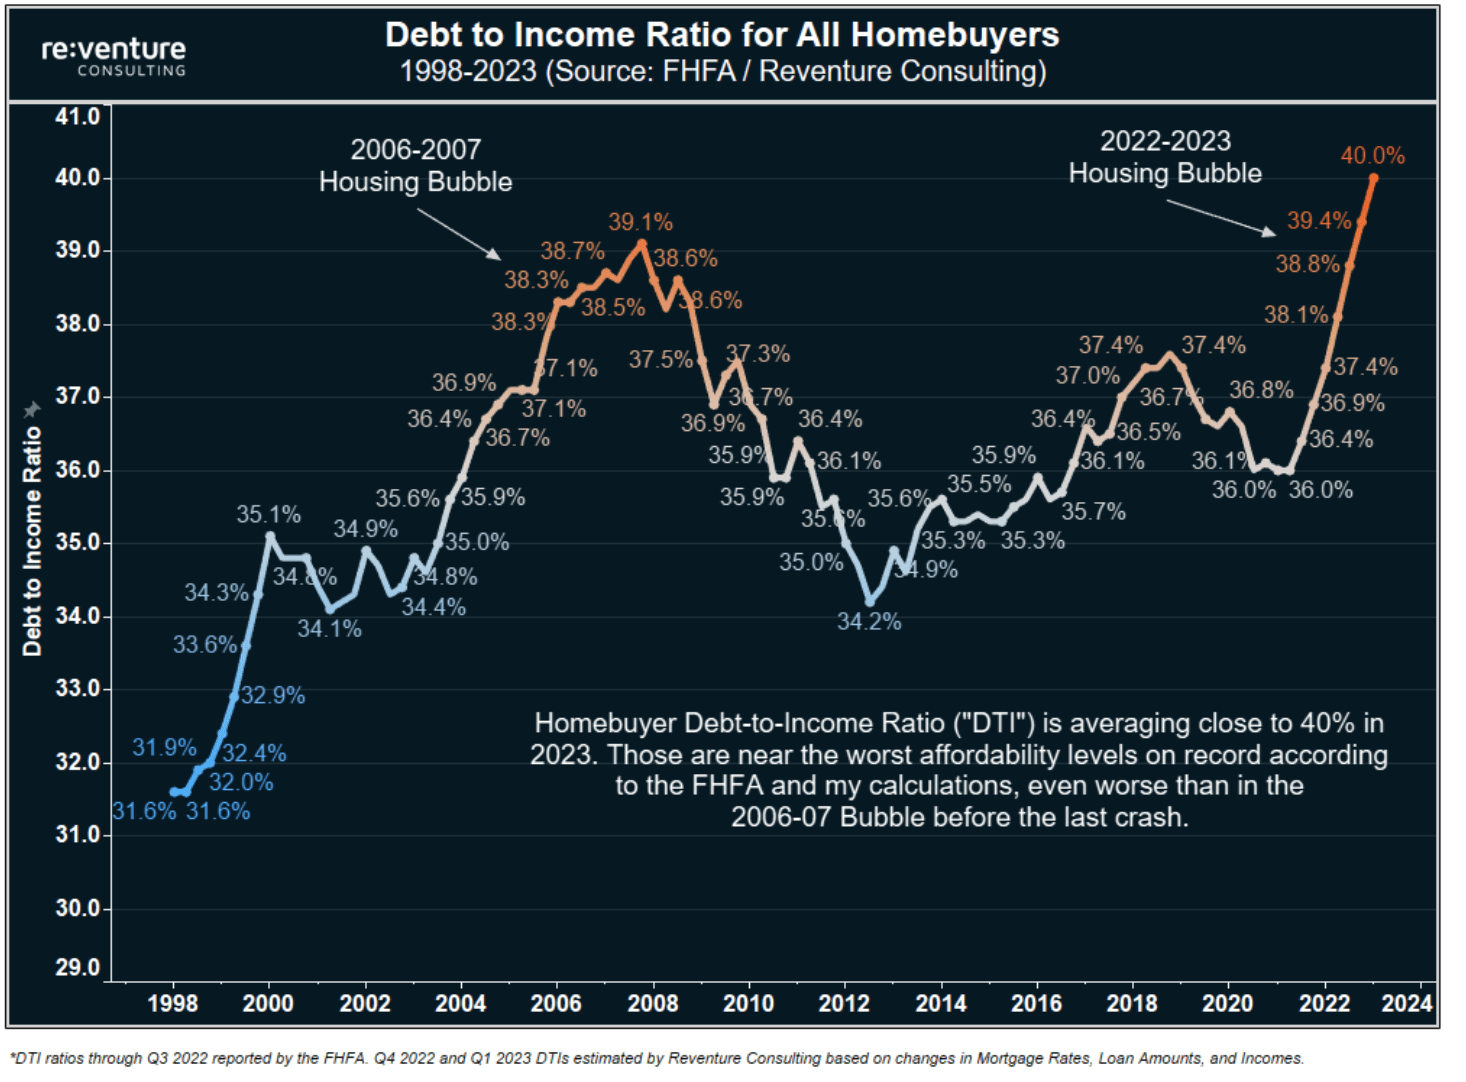
US Home Buyer DTI Ratio (Reventure Consulting)
Of course, the mainstream media and the banks want you to believe that the 2008 financial crisis was entirely caused by a few rogue lenders who did illegal things and by themselves brought down the economy. According to them, this is all cleaned up so you have nothing to worry about. The research doesn't really support this, however. The truth is that millions of middle and upper-middle-class households overleveraged themselves to keep up with the Joneses. Now, if you look you'll see that mortgage debt is lower than it was in 2008, but the population is also much older. Households in their 20s, 30s, and 40s are doing nearly the exact same thing that their older counterparts were doing in 2006 and 2007. Whether it becomes as big of a problem as 2008 remains to be seen.
40% average DTIs is wild, and the fact that roughly half of the loans being made are above a 40% DTI is even crazier. DTI is typically calculated pretax, so taking 30% for federal/state/FICA taxes or so off of pretax income means that the typical true debt-to-disposable income ratio is closer to 57% (40/70). Typically, these loans are going to dual-income households, so if even one spouse subsequently loses their job, the house is going on the market. We can then look at past historical data on unemployment and put in a joint probability of either spouse or both losing their job, and the numbers are shocking.
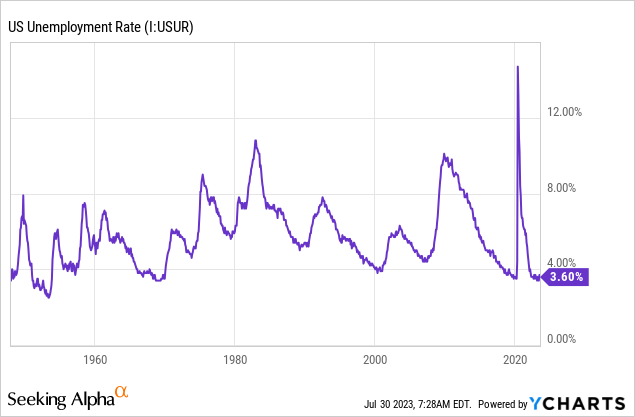
During past recessions, unemployment typically peaks between 6% and 9%. Moreover, unemployment tends to be structural, meaning workers aren't able to get new jobs right away as they are when unemployment is 3.5%. Short of a COVID-money printing binge, there's not a whole lot the government can do to stop unemployment from rising from time to time. At 6%, the joint probability of either spouse or both losing their job is 11.6%. At a 9% unemployment rate, the joint probability of either or both is 17.1%. Does this mean millions of homebuyers will be forced to sell? Not necessarily, but it does illustrate how millions of homes were bought in the 2006 bubble, only to flood the market in 2008-2010. When DTIs are lower (i.e. 25-30%) these conditions don't exist, because it's much more likely that both spouses would have to lose their jobs to not be able to afford the mortgage + basic groceries + utilities. The probability of both spouses losing their jobs at a 6% unemployment rate is only 0.36%. High DTIs at business cycle peaks intuitively lead to future forced sellers.
Something else that's very important to know about economic statistics is that construction is counted in GDP when it's in progress, not when someone buys it. This means if there's a lot of new construction that isn't selling, GDP will remain strong until construction slows down. This hasn't happened yet, but it's likely to happen in the future.
Auto Credit Is Worth Watching As Well
Auto credit is another area where crazy stuff happened during the last business cycle. Used cars are not typically a market known for bubbles, but a combination of chip shortages, FOMO, and easily available credit led to a bona fide credit cycle in used cars.
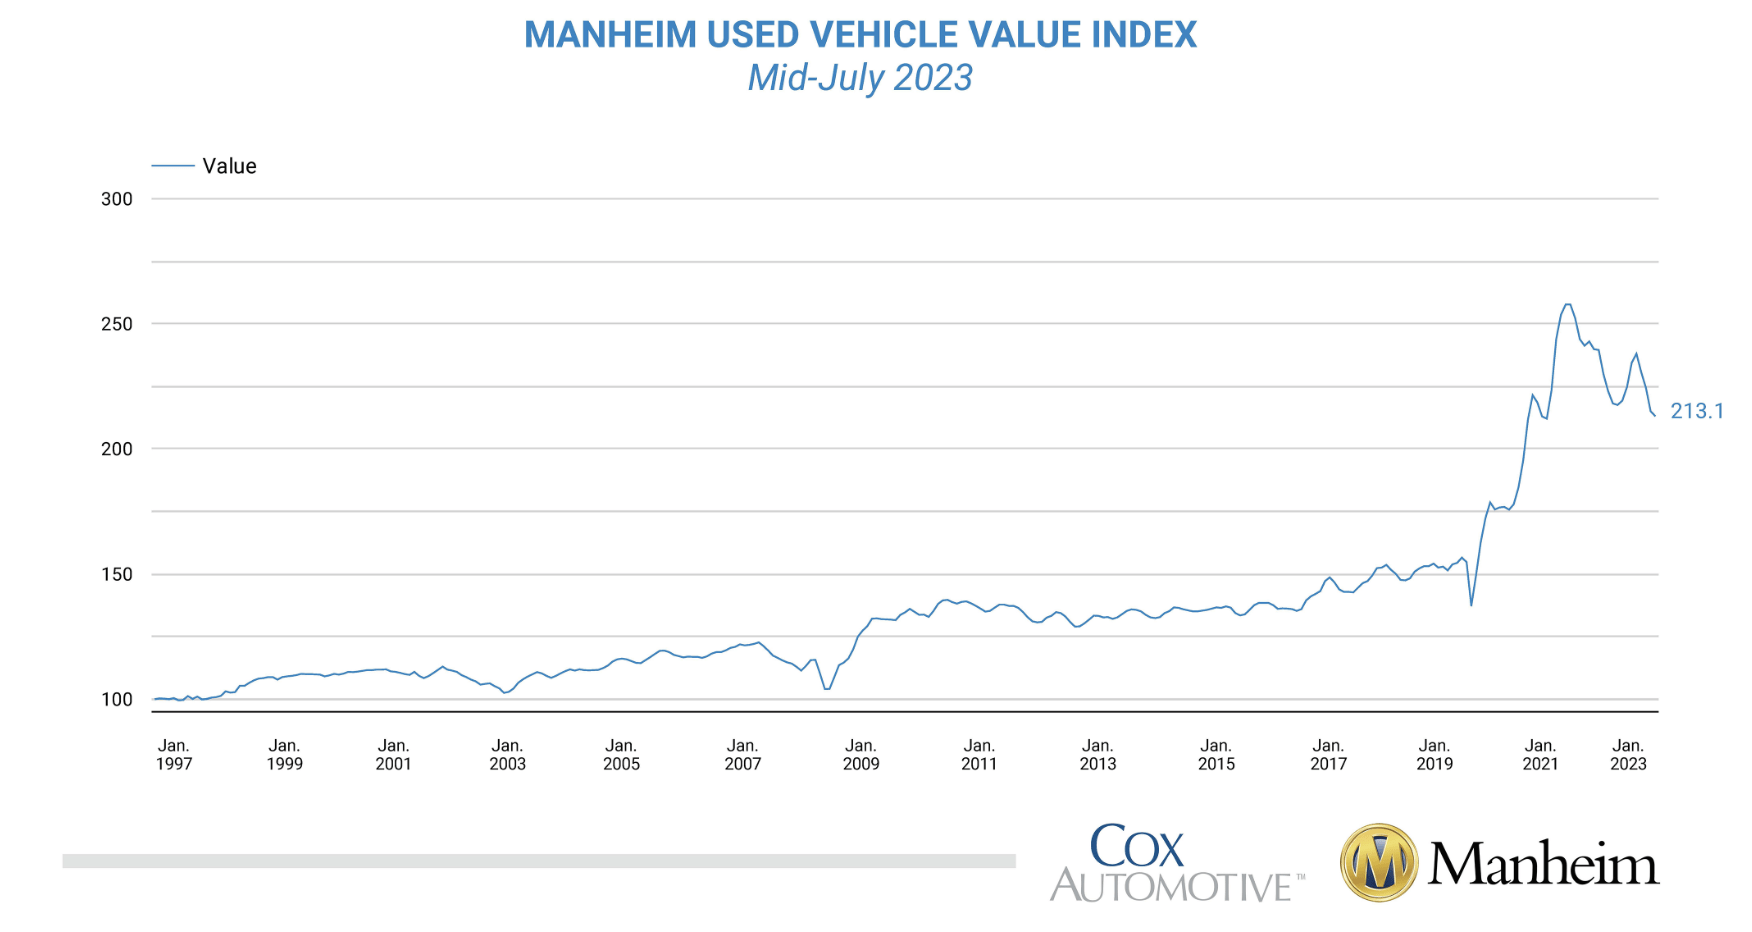
Used Car Prices (US) (Mannheim)
Here we see that the index value of used cars surged 68% from mid-2019 to late 2021. Now they're crashing on the back of higher interest rates and better inventory availability. That's a problem for auto lenders who lent against peak used-car prices because now their collateral isn't worth much at all. Furthermore, interest rates nearing 7% means buyers have to pay up if they want to buy a car. Securitized auto loans hit a record high in 2021 and 2022, and now it seems some of these cars may end up recycled back into the market. A recent Fed survey just found auto loan rejections hit an all-time high. This is also worth watching.
What About Business Credit?
The last piece of the puzzle here is business credit. Here, we have an interesting contradiction. Banks are quickly tightening business credit, but the junk bond market is seeming quite receptive. There's probably only so far junk bonds and bank credit can diverge because they're substitutes in many cases.
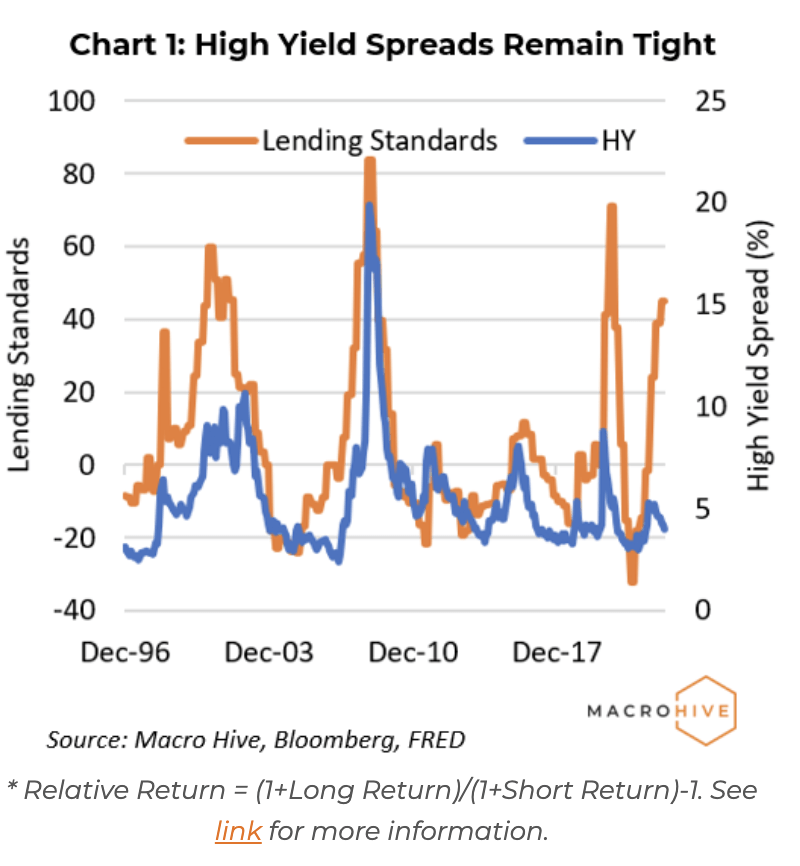
Lending Standards vs. High Yield Bonds (Bloomberg Via MacroHive)
The financial markets continue to firmly believe in the idea of a soft landing, while bank credit itself tends to be what determines whether the business cycle ebbs or flows. Both the supply and demand for business credit are slowing, and the situation is not likely to improve with the Fed raising capital requirements for banks and the commercial real estate losses continuing to pressure lending.
Have high-yield bond traders completely lost their minds? The pricing looks a little loose but not necessarily crazy.
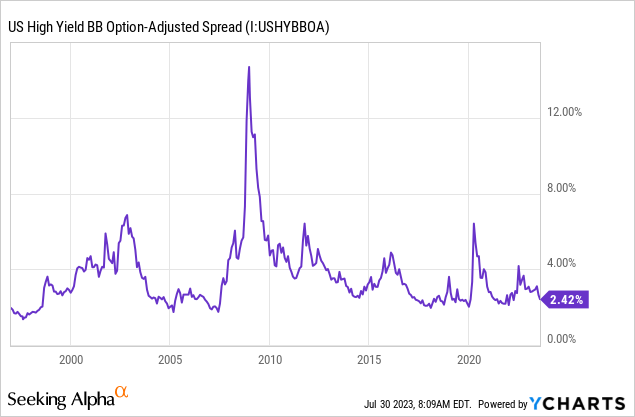
BB junk bond spreads have been about as low or lower many times in the past, but never by much, and generally not for long.
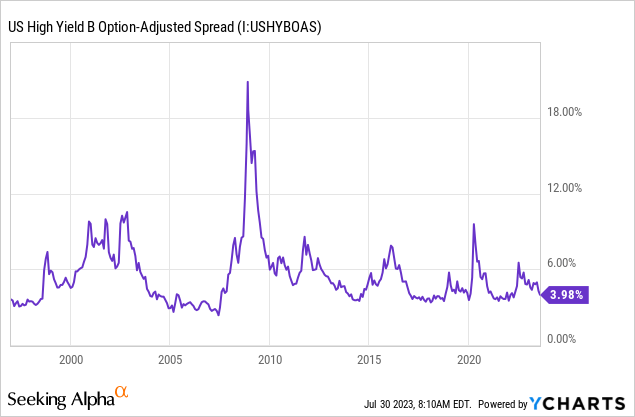
And here are the spreads for B-rated bonds, which are a little dicier in the best of times, but generally not terrible. Just ballparking based on past recessions, the defaults on these are likely to run 2-5% on the BBs and perhaps 4-8% on the Bs. Add back about 40% for recoveries, and the losses are likely to run somewhere in the range of 1.2% to 3% for the BBs and 2.4% to 4.8% on the Bs. Against credit spreads of 2.4% and 4% respectively, junk bonds appear to be priced for either returns a bit above or a bit below Treasuries. What hasn't happened yet that probably will happen at some point is a big correction in spreads that makes high-yield bonds actually attractive, rather than simply breaking even vs. Treasuries or returning a bit more.
There's quite a paradox here. On one hand, large-cap stock valuations are incredibly optimistic–as if the business cycle doesn't even exist. And on the other, bank lending and leading economic indicators are contracting at a similar pace or greater to past recessions. High-yield bonds are somewhat in the middle here. The pricing isn't awful, but it's by no means attractive.
For stocks, I've been critical in past years of using the Shiller CAPE ratio (or other indicators that adjust earnings for the business cycle) due to unfair comparisons from the 2018 corporate tax cuts in the US and interest rates being at zero. Interest rates are no longer at zero, and the CAPE comps are now based on the lower corporate tax rate. Stocks are significantly overvalued.
Bottom Line
The economy is out of whack, and changes in the supply of credit are likely to force prices back in line with wages and then wages back in line with productivity. Getting back to equilibrium almost certainly means a recession. This is priced into the yield curve and is reflected in rapidly tightening lending standards across the economy. However, this is only somewhat reflected in the corporate bond market and not all in the stock market. Stocks have traded at lower valuations than now roughly 95% of the time for good reason. As much as everyone wants this time to be different from hundreds of years of economic cycles, this time is not likely to be different.
This article was written by

Analyst’s Disclosure: I/we have no stock, option or similar derivative position in any of the companies mentioned, and no plans to initiate any such positions within the next 72 hours. I wrote this article myself, and it expresses my own opinions. I am not receiving compensation for it (other than from Seeking Alpha). I have no business relationship with any company whose stock is mentioned in this article.
Seeking Alpha's Disclosure: Past performance is no guarantee of future results. No recommendation or advice is being given as to whether any investment is suitable for a particular investor. Any views or opinions expressed above may not reflect those of Seeking Alpha as a whole. Seeking Alpha is not a licensed securities dealer, broker or US investment adviser or investment bank. Our analysts are third party authors that include both professional investors and individual investors who may not be licensed or certified by any institute or regulatory body.
Recommended For You
Comments (3)


finance.yahoo.com/...