Better Dividend ETF: QDIV Vs. SCHD

Summary
- Both QDIV and SCHD invest in large-cap U.S. stocks that pay dividends, but they have different selection criteria and weighting methods, with SCHD having a lower expense ratio and higher dividend yield.
- QDIV has a lower price-to-earnings ratio and pays dividends monthly, while SCHD pays quarterly; SCHD has realized a higher total return since August 2018.
- Analysis of the underlying indices of both ETFs shows they outperform the S&P 500, especially during down markets, with QDIV potentially offering higher returns over a 24-year period.
Maximusnd
Introduction
Before I compare Global X S&P 500 Quality Dividend ETF (NYSEARCA:QDIV) and Schwab US Dividend Equity ETF (NYSEARCA:SCHD), I want to highlight some of the basic elements of each security. Both invest in large-cap U.S. stocks that pay dividends, but they have different selection criteria and weighting methods. QDIV selects stocks based on quality, value, and dividend factors, while SCHD requires stocks to have a minimum dividend yield and a 5-year dividend growth track record.
Expenses
According to its fact sheet, SCHD has a lower expense ratio of 0.06% compared to QDIV's 0.20%. One can find a fact sheet on QDIV here. This means that SCHD charges less fees to investors and has a lower hurdle to overcome. SCHD also has a higher dividend yield of 3.58% as of July 27, 2023, compared to QDIV's 3.20%. This means that SCHD pays more income to investors per dollar invested.
Valuations
If one goes to Morningstar, and reviews, QDIV's portfolio has some advantages over SCHD's current portfolio. QDIV has a lower price-to-earnings (P/E) ratio of 12.18 compared to SCHD's 13.65 (as of July 27, 2023). This means that QDIV is relatively cheaper than SCHD based on earnings. QDIV also pays dividends monthly, while SCHD pays quarterly, which may appeal to some investors who prefer more frequent income.
Performance
Since August 2018, SCHD has realized a total return of 73.72% while QDIV gained 49.50%. In the last three years, SCHD has averaged 15.72% annually, while QDIV saw a 17.16% gain per year. So far this year, SCHD has a total return of 1.80%, and QDIV has grown 4.96%.
Portfolio Construction
SCHD has been around for about 12 years, and QDIV has a shorter history of five years. I found it important to look at their underlying indices to see which one of those sheds some light on historical performance. I want to thank MFS for the use of their resources. First a few definitions
According to Charles Schwab Asset Management, SCHD "...is based on the Dow Jones U.S. Dividend 100 Index which is designed to measure the performance of high-dividend-yielding stocks in the U.S. with a record of consistently paying dividends, selected for fundamental strength relative to their peers, based on financial ratios." The portfolio is, "weighted by dividend yield, indicated annual dividend, country yield, or float-adjusted market capitalization ('FMC'), subject to index-specific caps applied to individual constituents, country of domicile, and/or Global Industry Classification Standard ('GICS') sector."
The top five holdings for SCHD are:
- Broadcom Inc. (XNAS: AVGO)
- United Parcel Service, Inc. (XNYS: UPS)
- Texas Instruments Incorporated (XNAS: TXN)
- The Home Depot, Inc. (XNYS: HD)
- PepsiCo, Inc. (XNAS: PEP)
For QDIV, Global X's methodology "...uses the S&P 500 Quality High Dividend Index which measures the performance of S&P 500 stocks that exhibit both high quality and high dividend yield characteristics. Index constituents are equal-weighted, subject to a 25% sector weight cap, as defined by the Global Industry Classification Standard (GICS)."
The top five holdings for QDIV are:
- Broadcom Inc. (XNAS: AVGO)
- Molson Coors Beverage Company (XNYS: TAP)
- Omnicom Group Inc. (XNYS: OMC)
- The Interpublic Group of Companies, Inc. (XNYS: IPG)
- Tapestry, Inc. (XNYS: TPR)
Looking Back Further
Since QDIV has only existed since 2018, I thought it would be appropriate to compare the underlying indices. Fortunately, MFS has been able to backtest the indices' methodologies from 1999 to the current day. This is important because it will include three major bear markets; 2000-2002, 2008, and 2022.
Let's look at the performance data for each.
| Performance Data for: Dow Jones U.S. Dividend 100 Index | Years (1999-2022) | DJ US Div 100 % | S&P 500 % | Excess % |
Average Annual Return (TR) | 24 | 10.40% (±14.07%) | 6.77% (±19.61%) | 3.63% |
Up Markets | 18 | 14.03% | 16.43% | -2.40% |
Down Markets | 6 | -2.53% | -17.66% | 15.13% |
Sharpe Ratio | 0.62 | 0.30 | ||
Sortino Ratio | 0.75 | 0.35 |
| Performance Data for: S&P 500 Quality High Dividend Index | Years (1999-2022) | S&P 500 Quality High Div % | S&P 500 % | Excess % |
Average Annual Return (TR) | 24 | 11.36% (±15.00%) | 6.77% (±19.61%) | 4.59% |
Up Markets | 18 | 15.33% | 16.43% | -1.10% |
Down Markets | 6 | -2.95% | -17.66% | 14.71% |
Sharpe Ratio | 0.65 | 0.30 | ||
Sortino Ratio | 0.73 | 0.35 |
Both indices outperform the S&P 500, and that is for 24 years. Also, they both have lower volatilities. It is worth noting that they do not outperform the broader market when the S&P 500 has a positive return. The outperformance is strictly due to the fact that they hold up well during down markets. For example, the Dow Jones US Dividend 100 Index actually realized a positive total return during 2000-2002 (24.66%). Similarly, the S&P 500 Quality High Dividend Index gained 23.99%. Meanwhile, the overall market lost 37.43%.
So Which Is Better?
So which ETF is better? Clearly, SCHD has outperformed QDIV since the latter's inception. I contend that is a short window to compare two investments. With the analysis of the underlying indices, three different bear markets are included in the findings. Both are better when one considers risk management, and have superior risk ratios than the overall market.
This is my take. Assuming we calculate QDIV's expense ratio with the annual return, one can estimate a managed historical return of 11.16%. If we were to do the same for SCHD, we now have an annual return of 10.36%. Is that enough difference to change course? It is if one sees that our $10,000 QDIV investment would be worth $127,000 in 24 years. Compare that with our SCHD portfolio which is now worth $101,000. I know that many concern themselves with fees, but a fee is only an issue if a lack of performance exists.
Analyst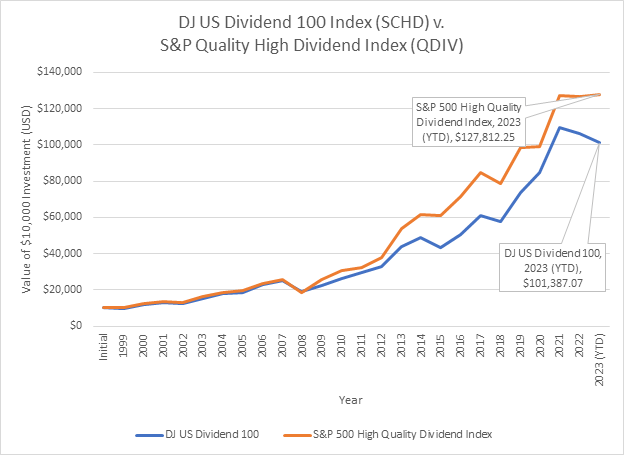
Conclusion
I personally am not an ETF investor. I just know that there is a trend to find portfolios constructed based on algorithms outside the tradition S&P 500 index. I also know there is a subset of investors who want dividends, and have found comfort in investing in SCHD. I believe these investors need to look at alternatives such as QDIV instead.
The last two years, SCHD has seen a total return of 6.51% while the S&P 500 gained 7.00%. In the meantime, QDIV appears to have found its feet in the market with an overall gain of 12.61%. That is while it is focused on dividends as its primary objective. The issue is that dividends are only part of the total return; one needs to focus on growth too.
While SCHD has been the better performer since 2018, it is quite apparent that QDIV needs to be added to the watchlist of dividend investors. With data showing that the underlying index of QDIV outperforms SCHD, and with better risk ratios, it is time to consider the Global X S&P 500 Quality Dividend ETF.
NOTE: I do not own any of the positions discussed, nor do I plan to buy them in the next 48 hours. This is not a recommendation to buy. Additionally, do your own due diligence. Investing involves risks, including the loss of principal. Have fun out there, and be careful.
This article was written by

Analyst’s Disclosure: I/we have no stock, option or similar derivative position in any of the companies mentioned, and no plans to initiate any such positions within the next 72 hours. I wrote this article myself, and it expresses my own opinions. I am not receiving compensation for it (other than from Seeking Alpha). I have no business relationship with any company whose stock is mentioned in this article.
Seeking Alpha's Disclosure: Past performance is no guarantee of future results. No recommendation or advice is being given as to whether any investment is suitable for a particular investor. Any views or opinions expressed above may not reflect those of Seeking Alpha as a whole. Seeking Alpha is not a licensed securities dealer, broker or US investment adviser or investment bank. Our analysts are third party authors that include both professional investors and individual investors who may not be licensed or certified by any institute or regulatory body.