The Impact Of The Fed's Decisions On July 27, 2023

Summary
- The Federal Reserve has raised the headline Federal Funds Rate (FFR) from 5.25% to 5.5%, which will impact investment markets and the macroeconomy.
- The rate change will increase bank lending costs, the interest burden on private debt, and the interest on newly issued Treasury deposits, while also affecting interest paid on reserve balances and overnight reverse repurchase agreements.
- The rate increase will result in a transfer of $139 billion from the household and business sector to the finance sector, potentially reducing aggregate demand for real goods and services and investment goods.
Tanarch
The Fed raised the headline Federal Funds Rate [FFR] at its last meeting.
This article runs the new numbers to see how higher rates impact investment markets and the macroeconomy.
This article provides an impact assessment of the FOMC July 26/27 2023 meeting.
The extract below is the FOMC implementation note from the meeting.
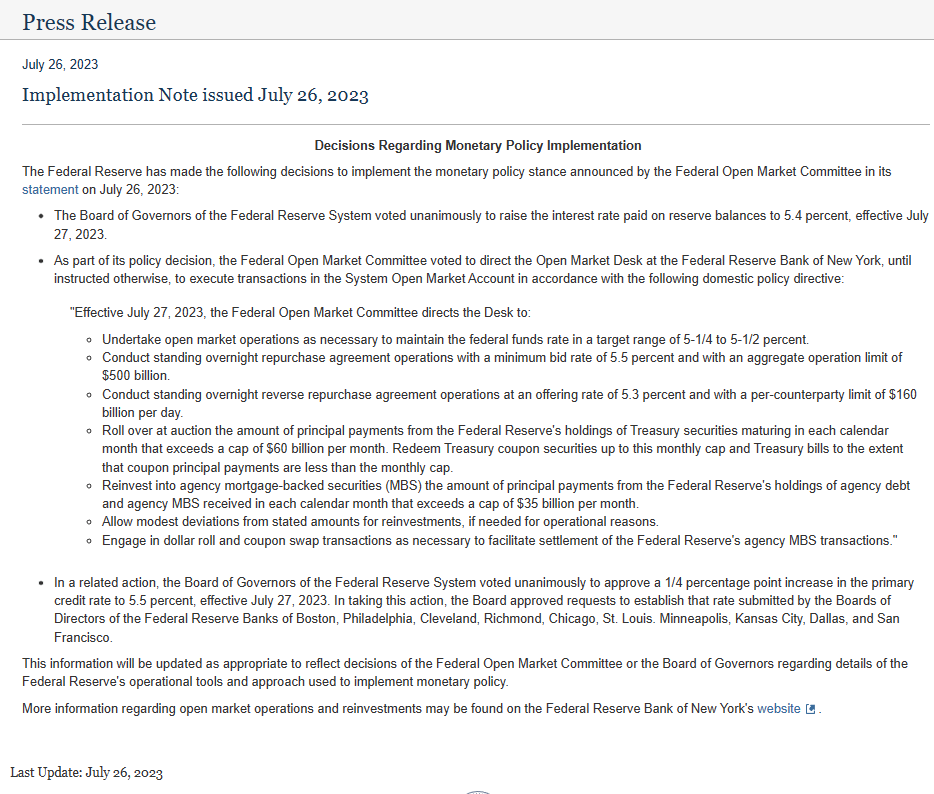
Federal Reserve Bank.
The analysis below has the above new information in it.
The mainstream tends to focus solely on the change to the headline FFR. The headline rate was raised from a top range of 5.25% to 5.5% as the chart below shows.
Not widely reported are other significant changes, such as:
1. The change to the interest rate paid on reserve balances [IORB] to 5.4%.
2. The primary rate is now 5.5%.
3. The overnight reverse repurchase rate [REPO] is now 5.5%.
4. Quantitative Tightening [QT] continues at the rate of $60B per month for T-securities and $35B per month for Mortgage Backed Securities [MBS]
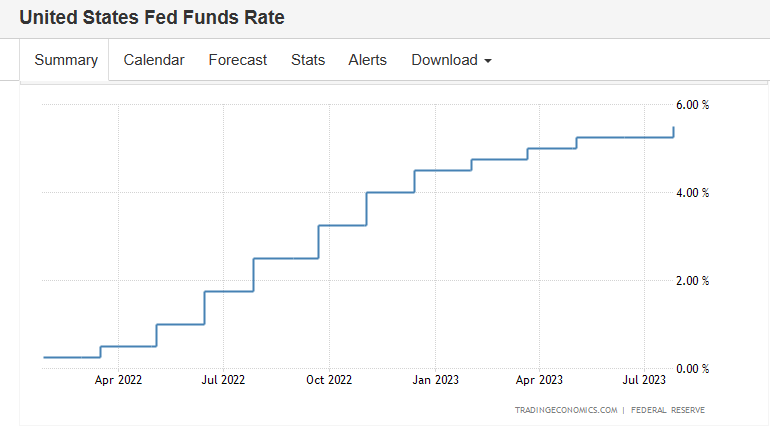
Trading Economics dot com
A movement of the rates listed above has four broad impacts:
- Bank lending costs on bank reserves.
- The interest burden on private debt.
- The Interest on newly issued Treasury deposits.
- Interest paid on reserve balances, also known as the support rate, and overnight reverse repurchase agreements known as REPOs.
These four impacts are looked at in turn.
The table below shows the impact of rates on bank reserves advanced by the Fed, via the discount window, when a bank makes a loan.
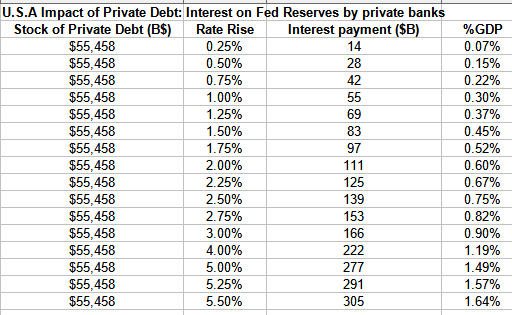
FRED and Trading Economics dot com (Source: Author calculations based on Trading Economics GDP measure)
Every 0.25% rate movement changes the cost of loan funds by $14 billion. The private banks then pass on this rate change to the customer if they can.
The interbank rate is shown in the chart below.
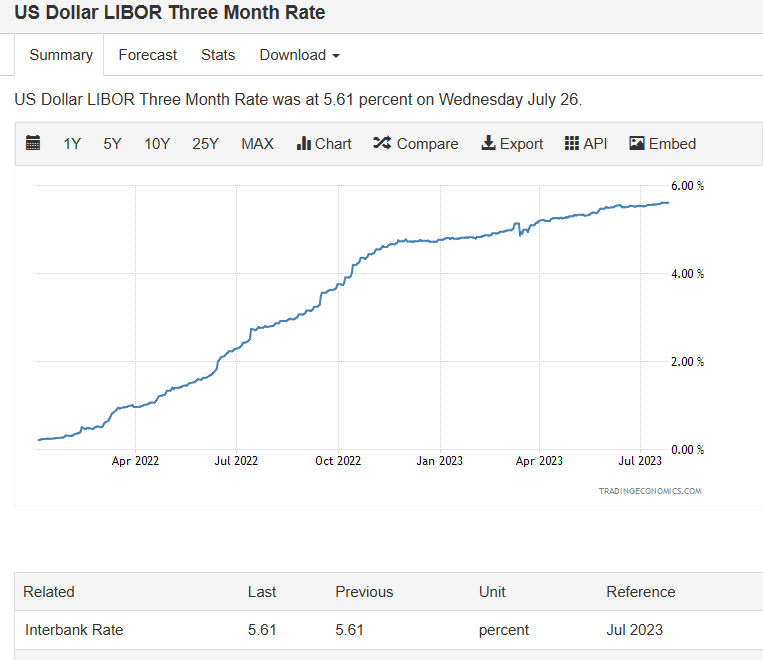
Trading Economics dot com
The chart shows that at present commercial banks can get bank reserves more cheaply at the Fed discount window rather than in the interbank market. The interbank market rate has risen out of the maximum target rate of 5.5% FFR. The Fed will need to allow the level of bank reserves to expand to put downward pressure on the FFR. The Fed does this by not issuing as many bonds to drain excess bank reserves.
The next aspect is the interest burden on private debt.
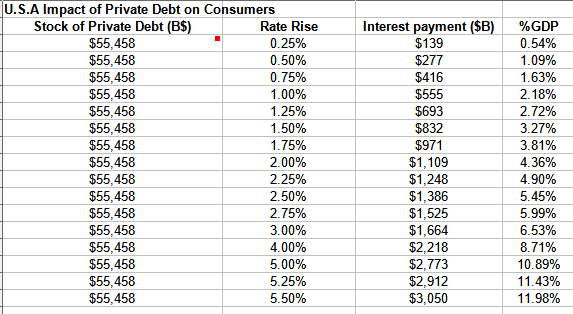
The following table shows the impact of the FFR on the stock of private debt in absolute terms and as a percentage of GDP.
FRED and Trading Economics dot com
The chart shows that with each 0.25% FFR change, $139 billion, or 0.54% of GDP, is transferred from the household and business sector to the finance sector in a macro intersectoral income transfer or vice versa.
At present, just over 11.98% of GDP goes to banks as interest on loans. Debt drag on the real economy.
The higher FFR will cause businesses and households in the real economy to transfer a flow of $139B out of real the economy and into the banking sector. This will cut aggregate demand for real goods and services and investment goods.
Treasury deposits are the next area of impact from a change in the FFR.
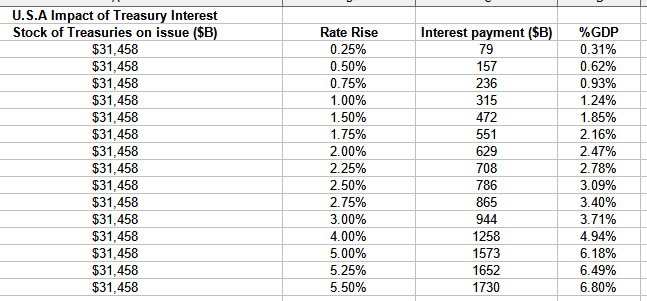
The following table shows the generalized impact of the rate rise on the stock of Treasuries.
FRED and Trading Economics dot com (Source: Author calculations based on Trading Economics Government Debt measure)
The table above shows that with each 0.25% rate change, a flow of $79 billion occurs either into or out of the economy.
An FFR increase means that the economy receives $79B more each year by way of interest payments from the Federal Government to bondholders. Overall this is a net gain of income to the economy given that the Federal Government is a net payer of interest.
The fourth and last impact of a change in the FFR is the adjustment of interest paid on reserves balance and REPOs.
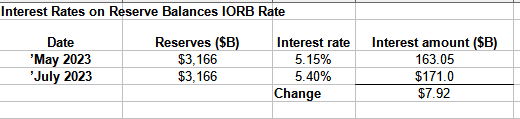
Each time the FFR changes, the IORB is set to just underneath it. The change will add $7.92 billion per annum of money to the economy. The total paid per annum is $171 billion.
The recent changes to the IORB are summarized in the table below.
FRED and Trading Economics dot com
This has been one of the most striking changes in Fed policy over the last few years and is well summarised in the following extract from Professor Galbraith.
The Federal Reserve works, in the main, for the largest banks, and since 2008 it pays interest directly on their reserves. Thanks to "quantitative easing," the policy of buying at-risk assets such as mortgage-backed securities from the private sector and warehousing them in special purpose vehicles, the big banks are flush with reserves. Paying interest gives them income; paying more interest gives more income. In return for this, nothing is demanded. As smaller banks with unstable deposit bases are hit by runs, the biggest banks can (and do) ride to the rescue, consolidating their hold on the banking system as a whole. All of this must be very well appreciated by the big bankers.
Policy Note 2023 / 3 Copyright © 2023 Levy Economics Institute of Bard College ISSN 2166-028X IN DEFENSE OF LOW INTEREST RATES James K. Galbraith
It used to be that the Fed would remit to the Treasury the income that it received from its operations less its costs. The income came from its balance sheet of T securities. In effect, it would transfer to the Treasury the income coupon it received on the federal government's own T securities. The US Treasury would then receive the interest payment from its own issued bonds.
Logic follows that if 100% of T-securities were owned by the Fed and all the interest was remitted to the US Treasury the federal government would be self-financing. It would be paying itself an income. That being the case why would you sell them to the public?
Now that the Fed pays interest to the banks on their reserve balances out of its income from operations its cost of operations vastly outweighs its income from those operations. The Fed now transfers nothing to the US Treasury each year and is building up a negative balance on its accounts. This is euphemistically termed a deferred asset and the plan is that at some stage when the pendulum swings the other way the Fed will reduce this deferred asset to zero and then start paying interest income to the US Treasury again.
For practical purposes, the effect is that this is simply money creation that flows directly to the banking sector. The following chart shows the growth of the deferred asset. This is de-facto federal government deficit spending though not recorded anywhere on its national accounts other than on this account at the Fed.
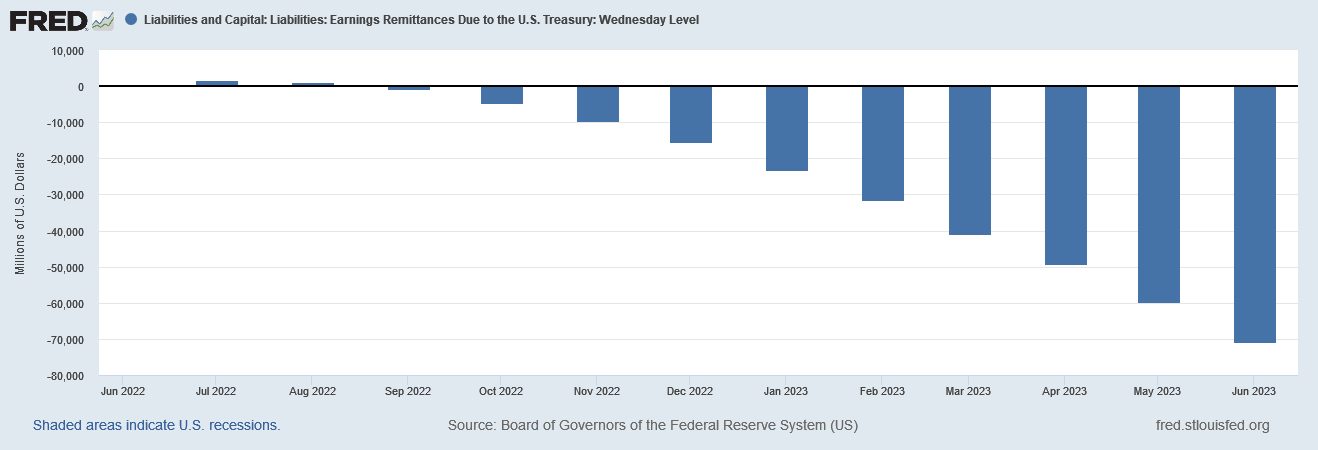
FRED
In June, over $11B flowed to the banking sector as interest on reserves. This number will increase as the IORB is raised.
The final impact is the effect on repurchase agreements [REPOs]. The result of this change is shown in the table below.
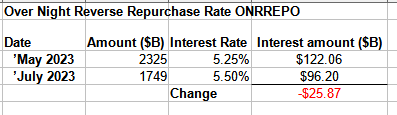
FRED and Trading Economics dot com (Source: Author's calculations based on FRED statistics and Trading Economics dot com statistics)
In this instance even though the rate is higher the earned amount is less because the overall holdings of REPOs have fallen since May.
The result is that the banking sector is receiving an income stream from the Fed of some $96B per annum.
This addition of income from IORB and REPOs increases the bank's capital base, which, in turn, means it can extend more loans given that banks are only constrained by their capital and the pool of creditworthy customers that wish to have a loan.
There are winners and losers from changes Fed policy changes, and these can be assessed in terms of critical actors in the credit markets.
Banks: Bank stocks can be expected to rise due to the increased income from:
- It increased loan interest from households and businesses on the existing loan book of over 217% of GDP.
- Interest on treasuries bought in exchange for excess reserves by the Federal Reserve goes up.
- Interest paid on reserve balances and REPOs by the Federal Reserve Bank goes up.
One could look at investing in the big banks (JPM) (MS) (C) (WFC) (FAS)
Borrowers: Rate increases mean less income can be spent on real goods and services and investment in new plant rather than going to debt and principal servicing. Aggregate demand in the economy will shrink because of this rate increase.
Official figures may show that GDP improves due to the rate rises however this is a quirk in the way that national accounting is collected and reported.
"Seemingly empirical National Income and Product Accounts (NIPA) follow this linguistic turnabout by reporting interest and rent as "earnings," as if bankers and landlords produce Gross Domestic Product (GDP) in the form of credit and ownership services. This practice is at odds with John Stuart Mill's definition of land rent as what property owners are able to make "in their sleep," by charging access fees for sites created by nature and given value by the community's overall prosperity. To depict this charge as "earnings" for providing an economic "product" is to pretend that rent extraction reflects real output, as if it is a useful service."
Hudson, Michael. J IS FOR JUNK ECONOMICS: A Guide To Reality In An Age Of Deception (Kindle Locations 364-368). ISLET/Verlag. Kindle Edition.
What is happening is that as interest rates rise a larger share of GDP goes to bankers as empty unproductive profit and deflates the rest of the productive economy, GDP appears to rise because it treats bank earnings from higher rates as production and earnings when it is merely a dead weight cost on the rest of the economy.
Macroeconomy: An income gain happens when rates go higher due mainly to the size of the interest income flow from the stock of treasuries. The following tables show the before and after effects of the Fed's policy change.
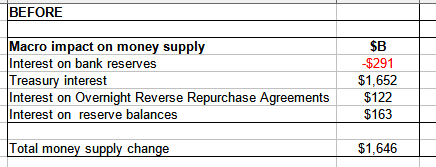
FRED and Trading Economics dot com (Source: Author's calculations based on FRED statistics and Trading Economics dot com statistics)
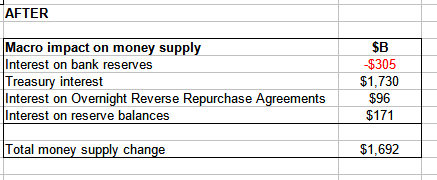
FRED and Trading Economics dot com (Source: Author's calculations based on FRED statistics and Trading Economics dot com statistics)
The net change to the money supply is $47B and expansionary overall.
The boost to the financialised economy by way of an increase in the cost of credit, a key business input, may cause the financial sector to do better and for the general stock market to rise as a result. (SPY) (DIA) (QQQ)
Editor's Note: This article discusses one or more securities that do not trade on a major U.S. exchange. Please be aware of the risks associated with these stocks.
This article was written by

Analyst’s Disclosure: I/we have no stock, option or similar derivative position in any of the companies mentioned, and no plans to initiate any such positions within the next 72 hours. I wrote this article myself, and it expresses my own opinions. I am not receiving compensation for it (other than from Seeking Alpha). I have no business relationship with any company whose stock is mentioned in this article.
Seeking Alpha's Disclosure: Past performance is no guarantee of future results. No recommendation or advice is being given as to whether any investment is suitable for a particular investor. Any views or opinions expressed above may not reflect those of Seeking Alpha as a whole. Seeking Alpha is not a licensed securities dealer, broker or US investment adviser or investment bank. Our analysts are third party authors that include both professional investors and individual investors who may not be licensed or certified by any institute or regulatory body.
Recommended For You
Comments (1)
