AngloGold Ashanti's revenues for Q1'23 were $1.028 billion. Net income was $66 million, or $0.16 per diluted share.
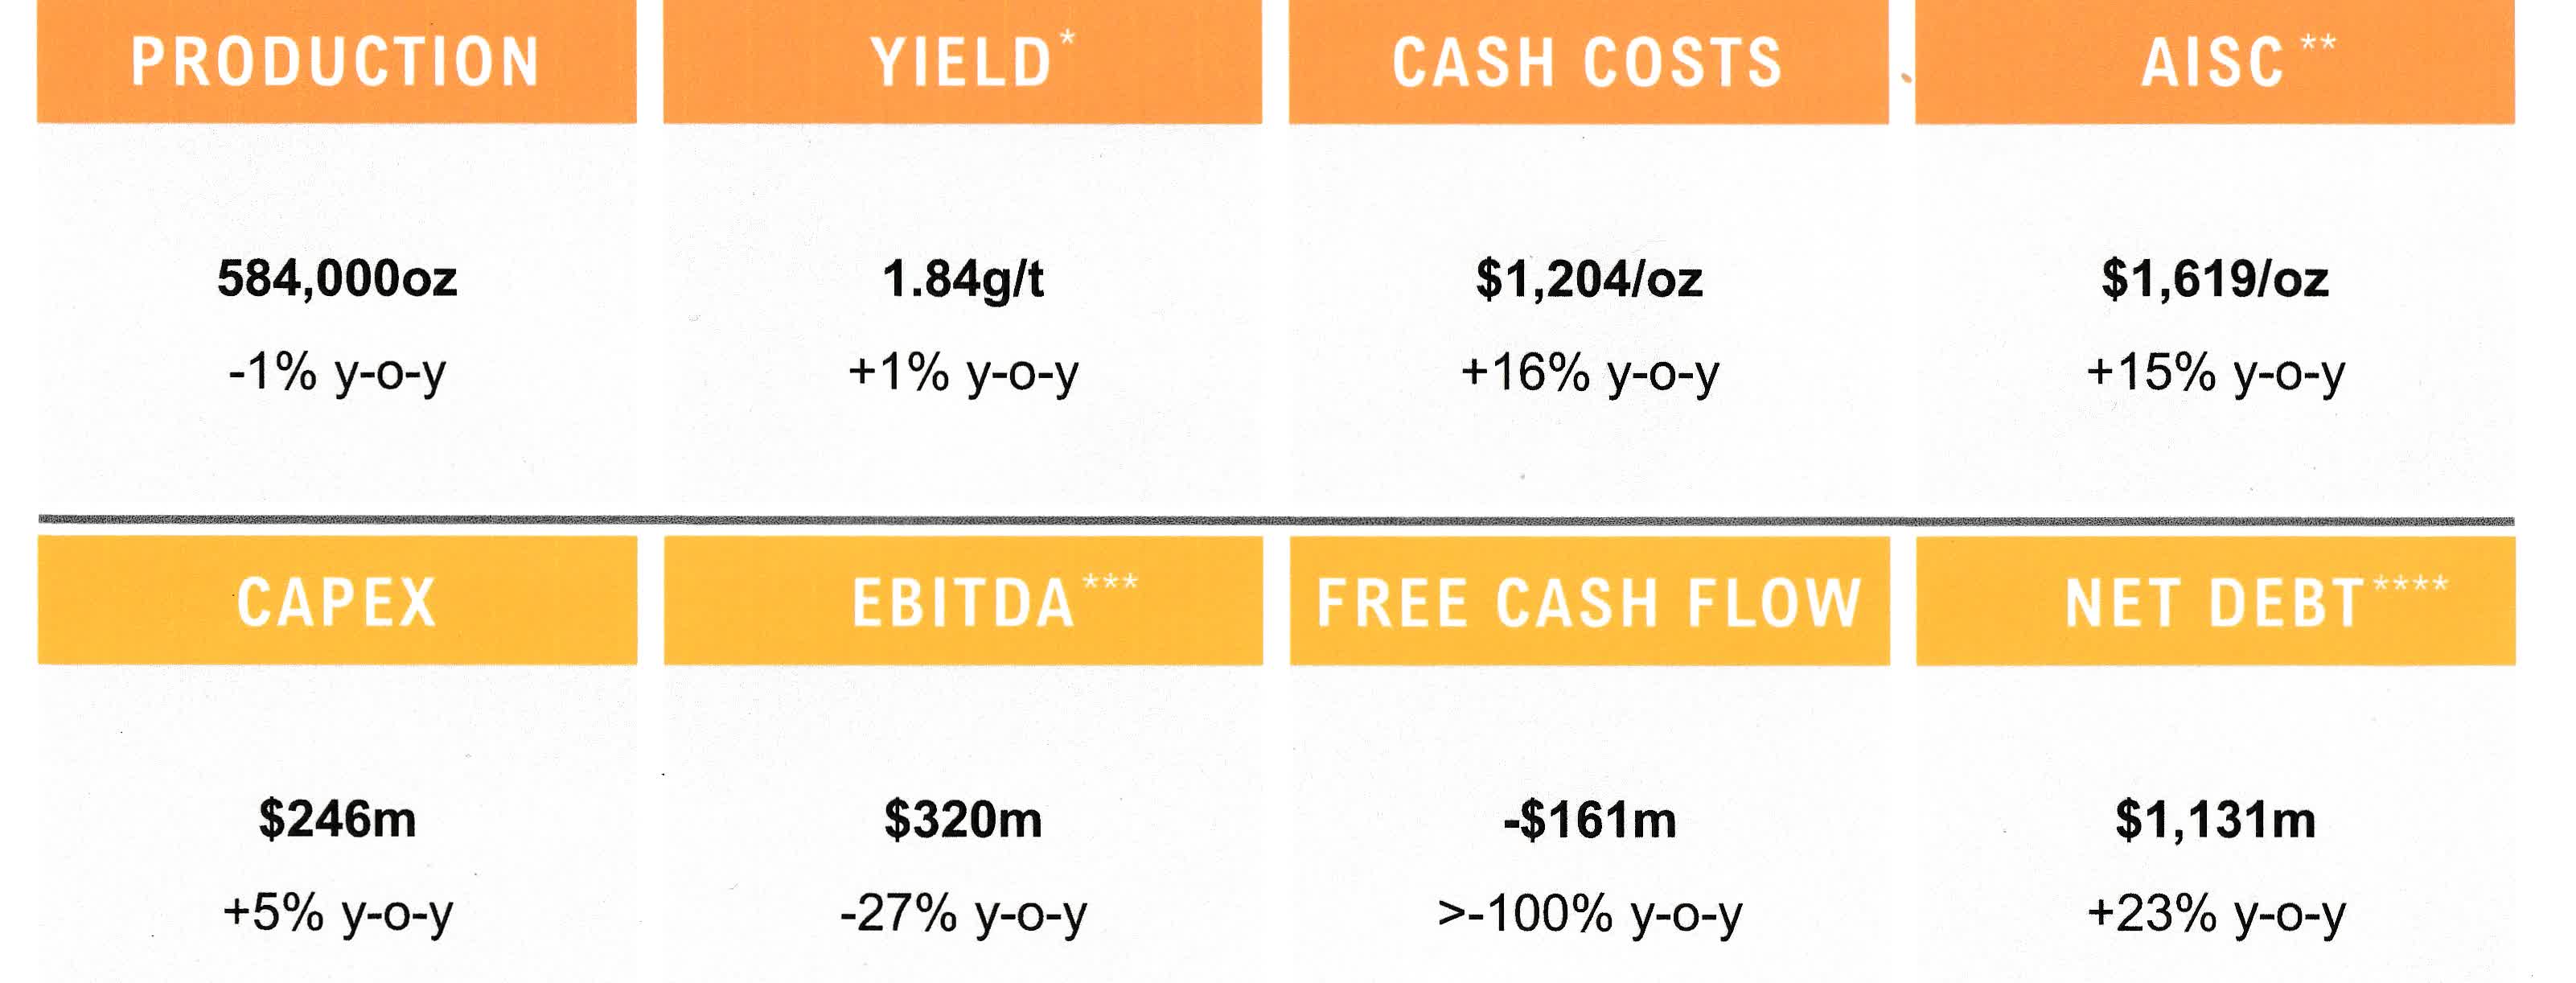
AngloGold Ashanti sold 583K Au Oz in Q1'23 and produced 584K Au Oz. Production was down 0.6% from 1Q22.
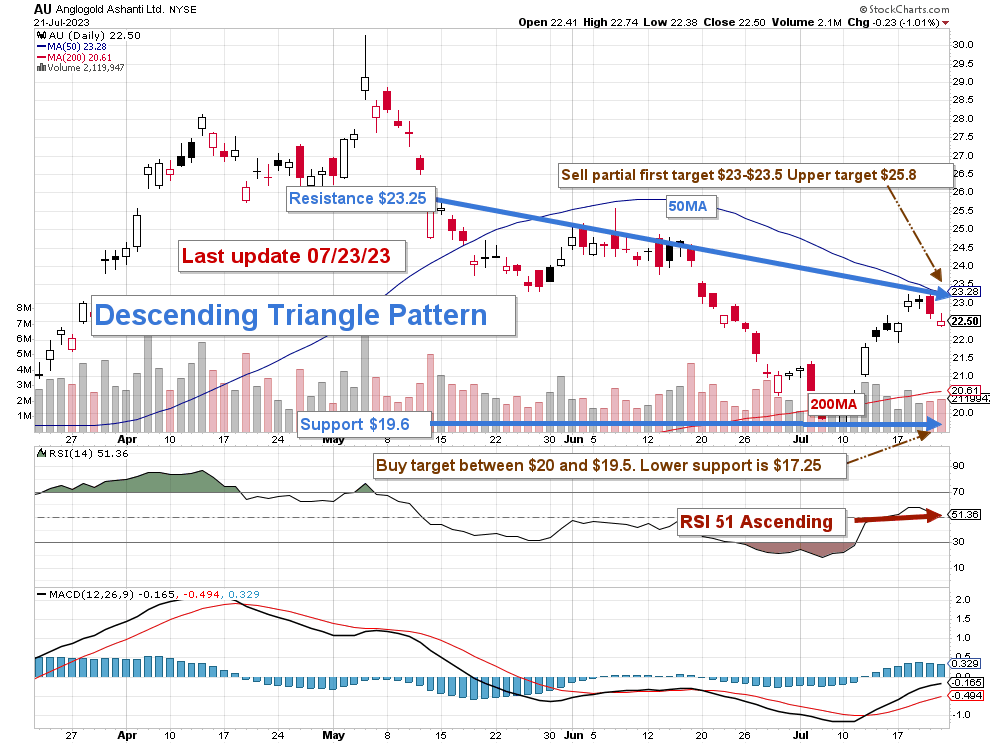
I recommend buying AU stock between $20 and $19.5 with possible lower support at $17.25.
Looking for a helping hand in the market? Members of The Gold And Oil Corner get exclusive ideas and guidance to navigate any climate. Learn More »
studiocasper
Part I - Introduction
Johannesburg-based AngloGold Ashanti Limited (NYSE:AU) released its Q1'23 results ending March 31, 2023, on May 12, 2023.
Note: This article updates my previous article on AngloGold Ashanti, published on October 17, 2022. I have been following AU's regularly since December 2020.
Note: On May 12, 2023, AngloGold Ashanti moved its primary listing to New York from the Johannesburg Stock Exchange (JSE) to access a larger pool of capital and reduce risk associated with South Africa.
1 - Q1'23 Results and Commentary
AU 1Q23 Highlights (AU Presentation)
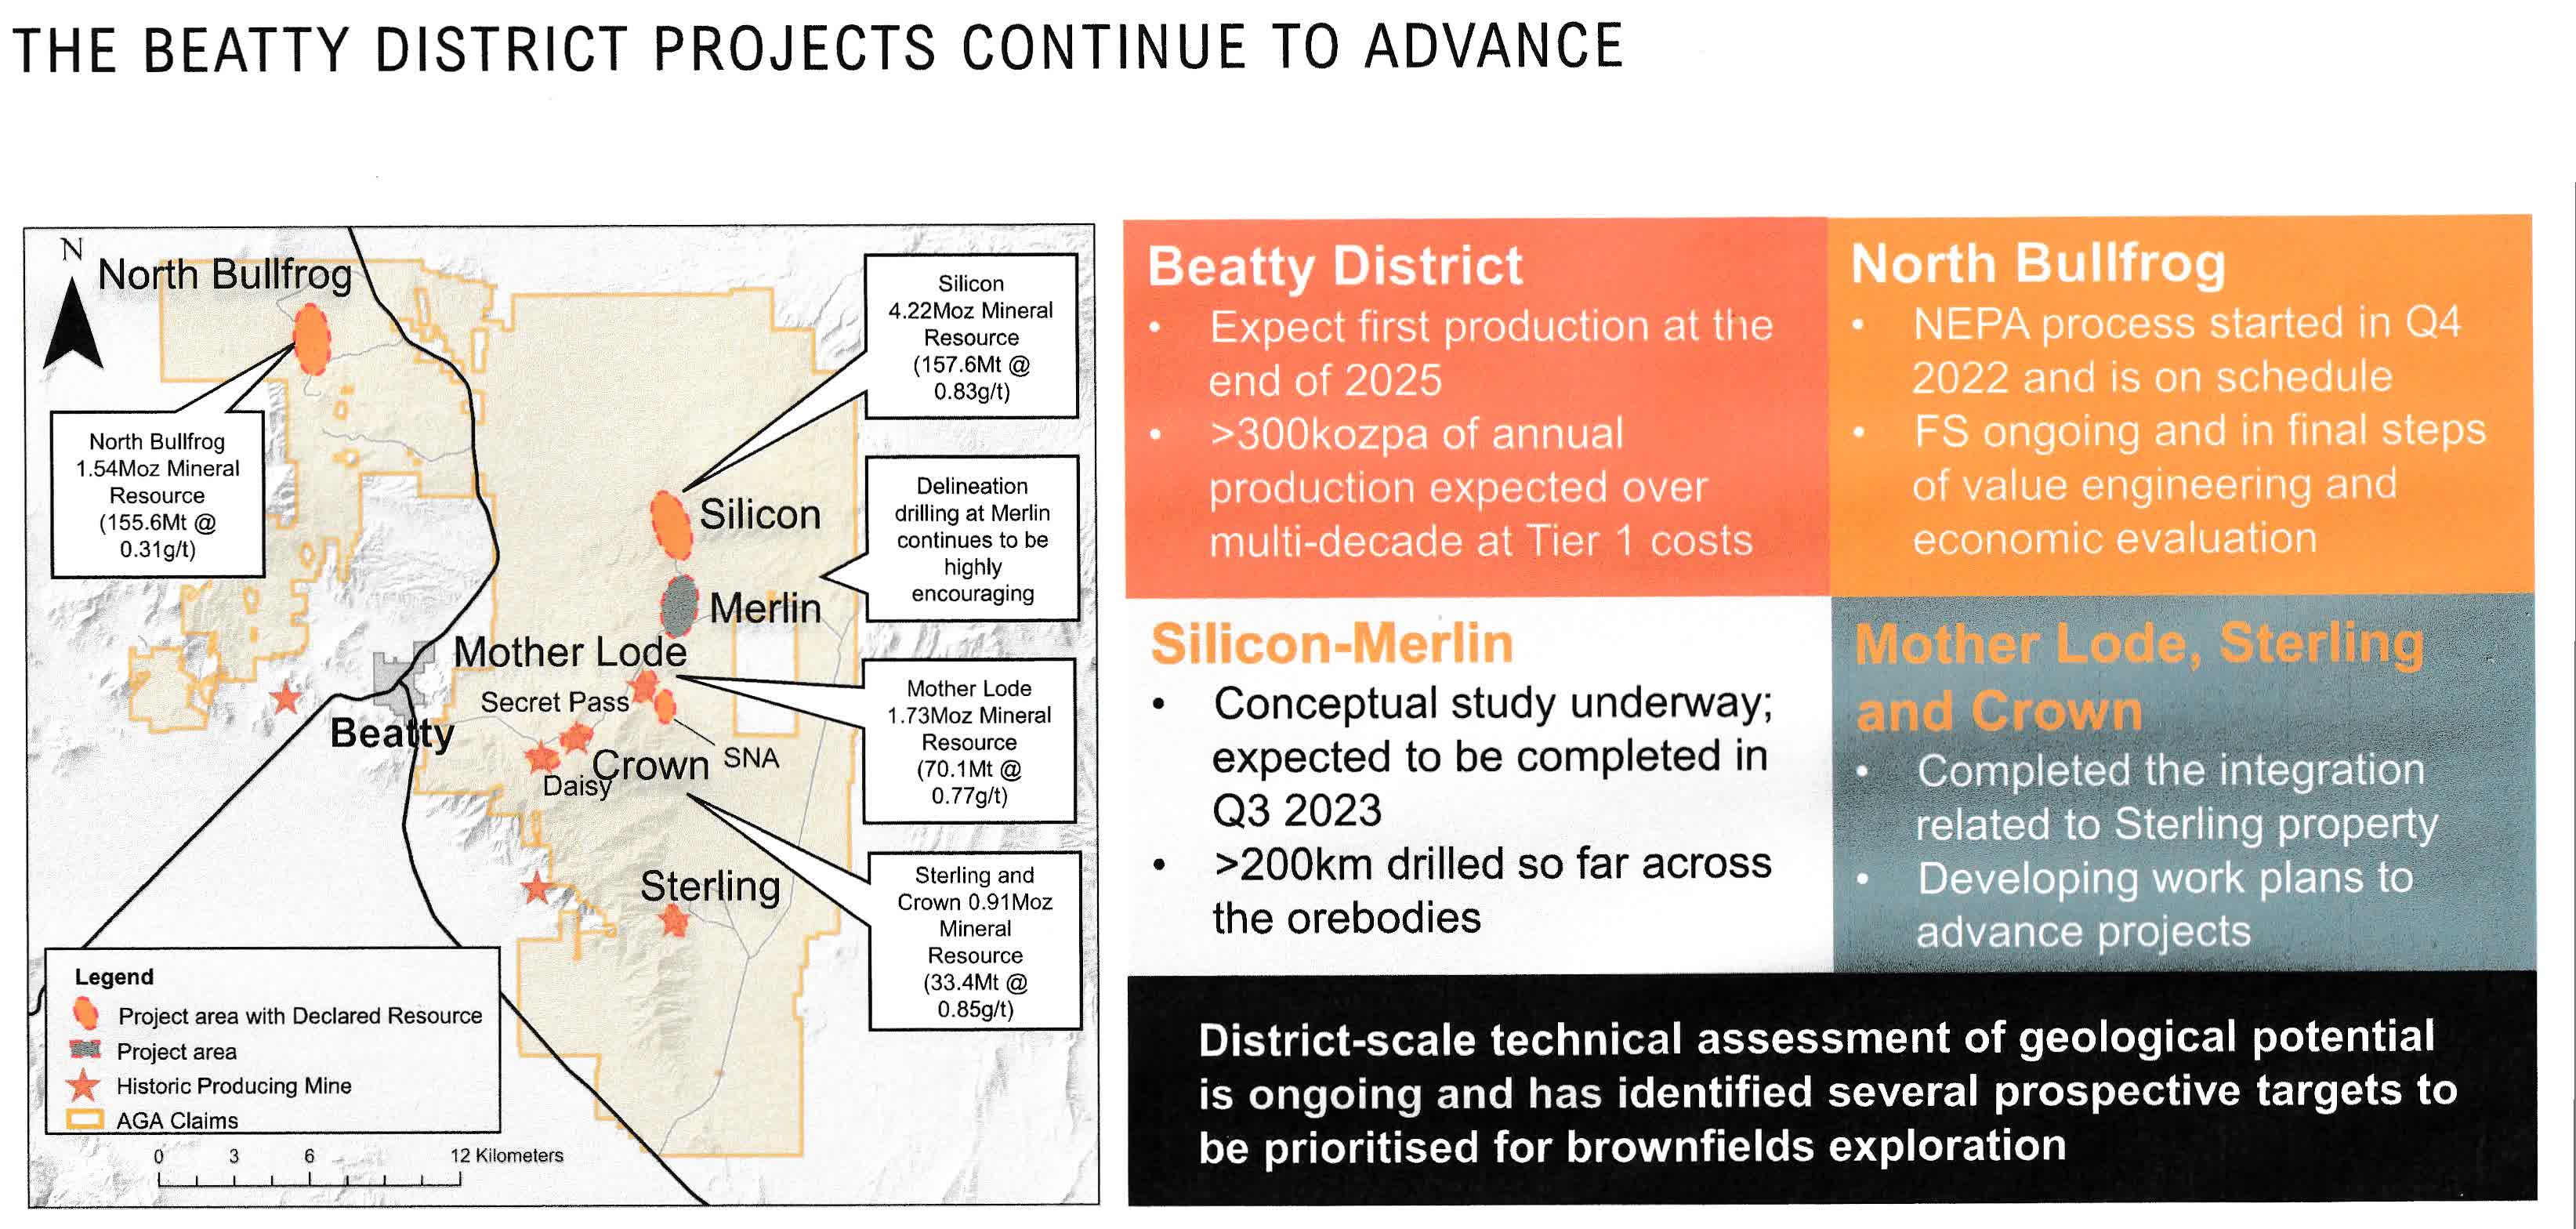
The company owns producing assets and projects in three continents, with the Beatty District projects in Nevada, USA, with expected first production at the end of 2025. Annual output of 300K Oz.
AU The Beatty Projects in Nevada, USA. (AU Presentation)
The Company continues to record an increasing underground grade trend, reaching 1.8 G/T in Q1'23.
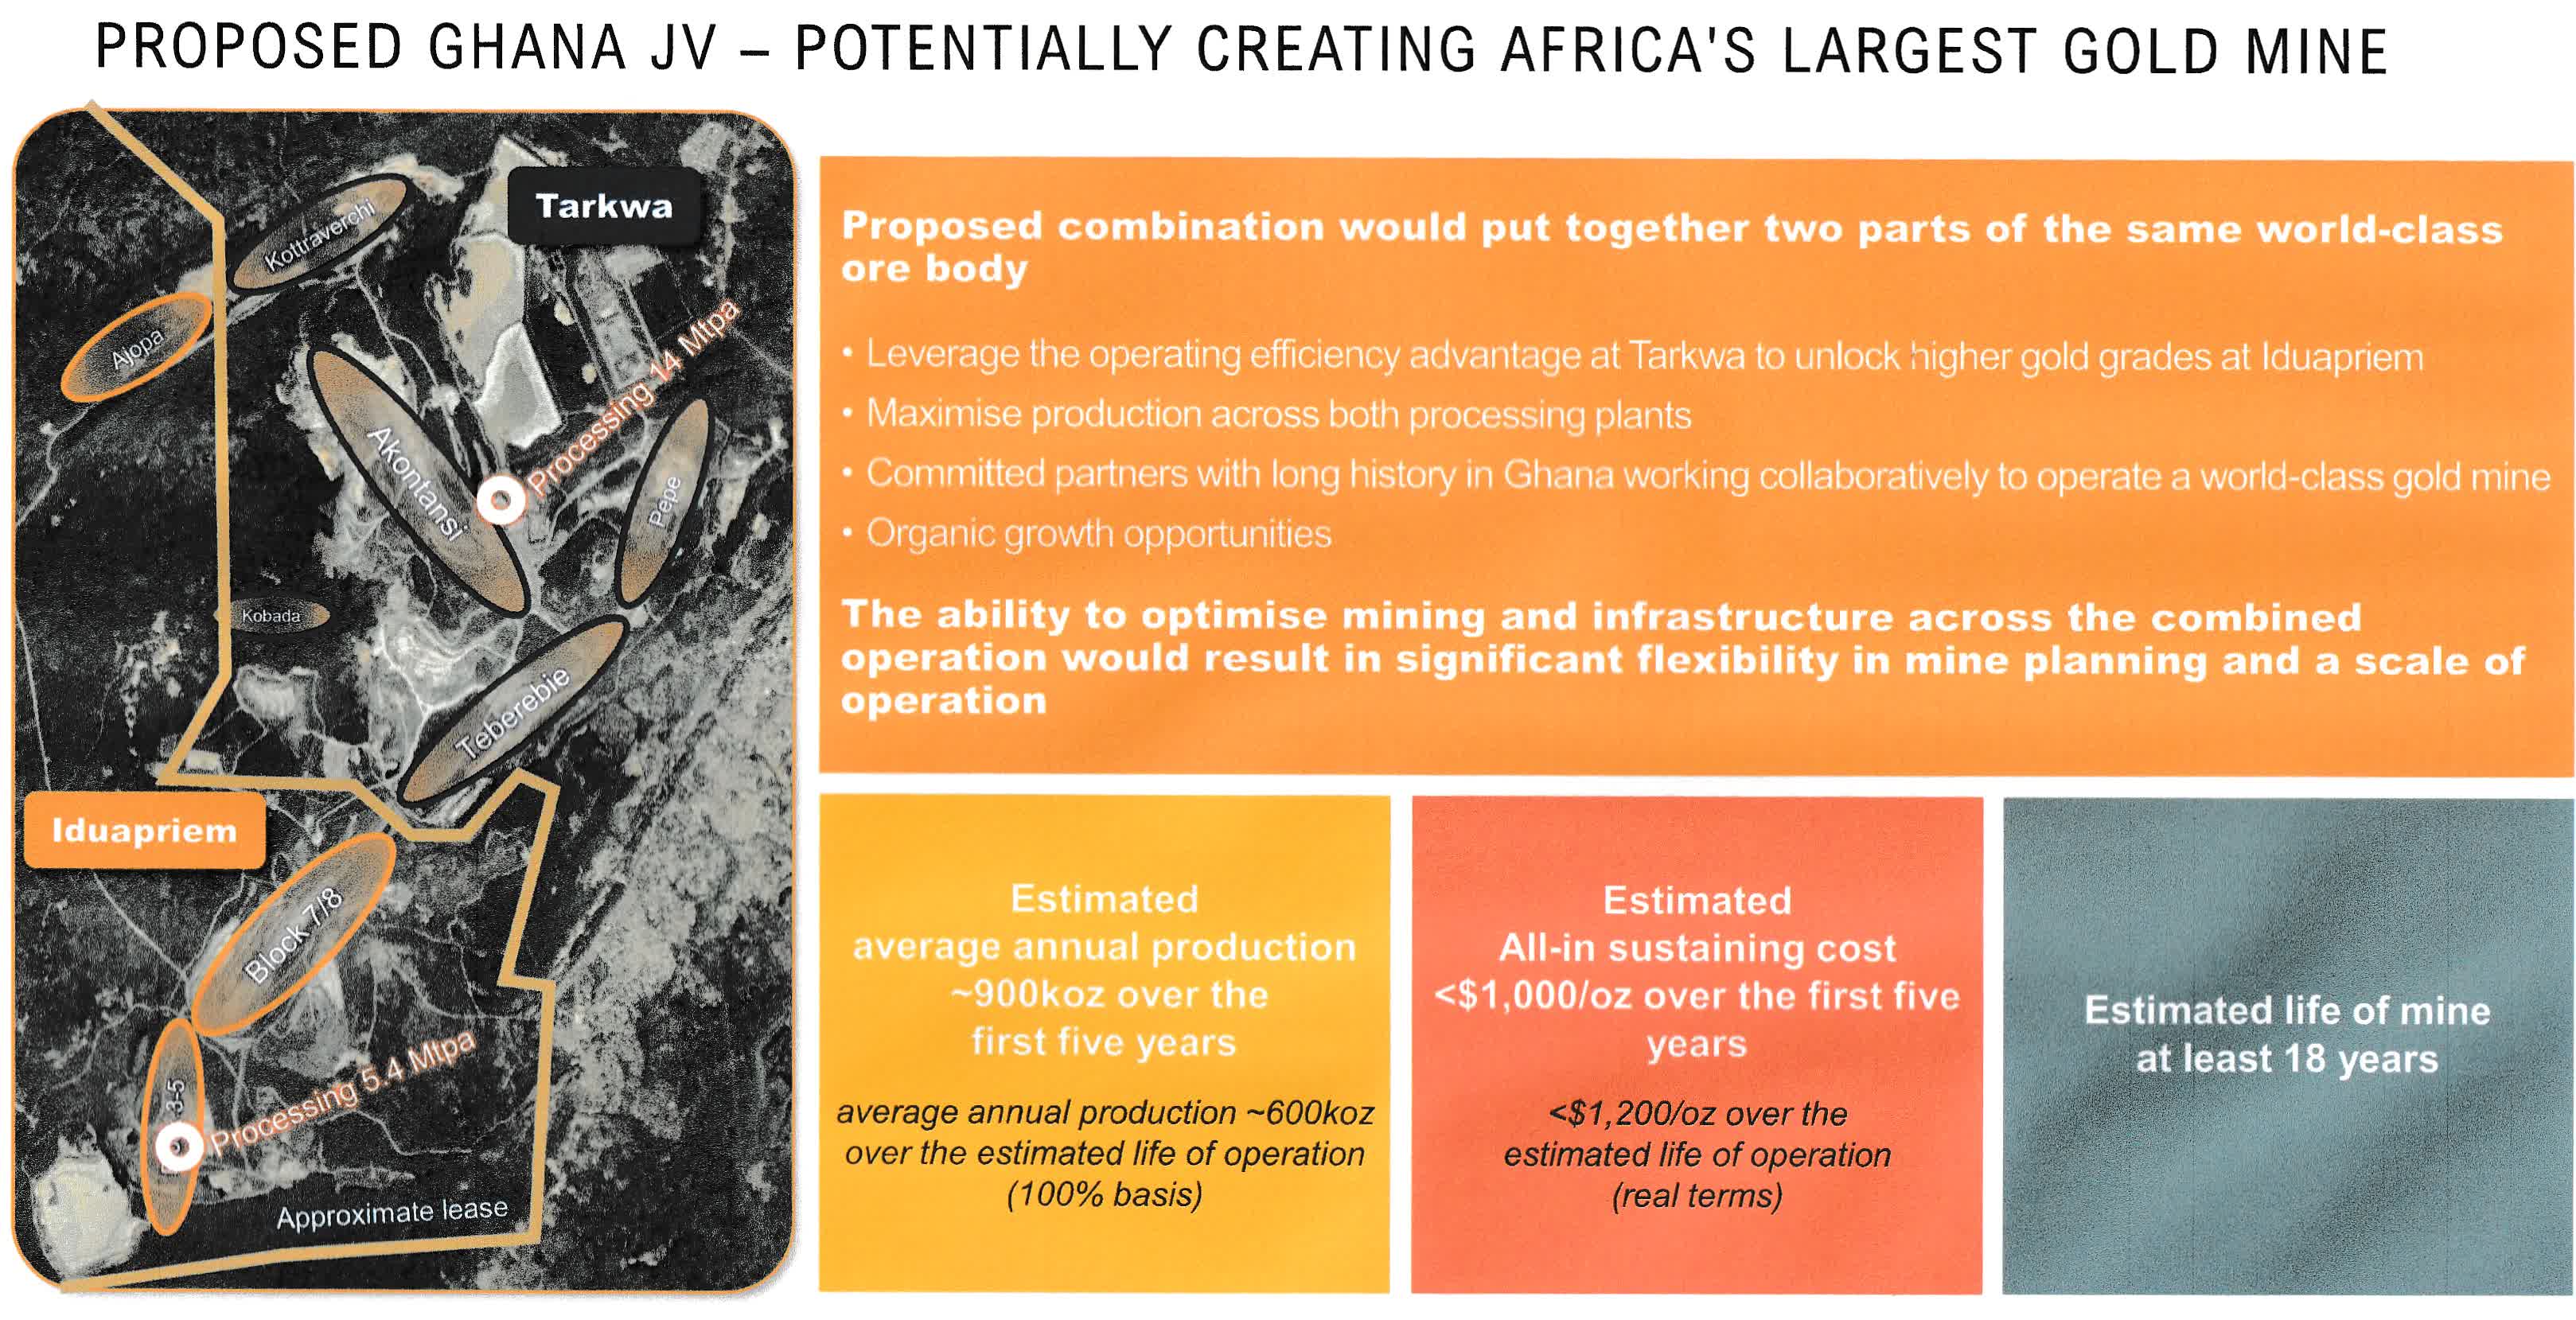
Also, on March 16, 2023, AngloGold Ashanti and Gold Fields (GFI) agreed to form a Joint Venture combining Gold Fields' Tarkwa mine and AngloGold's neighboring Iduapriem gold mine in Ghana. The JV will be completed by year-end 2023 or early next year.
The Tarkwa Mine is held by Gold Fields Ghana, in which Gold Fields currently owns a 90% share and the Government of Ghana (GoG) holds 10%. The Iduapriem Mine is currently 100% owned by AngloGold Ashanti. Both mines are located near the town of Tarkwa in the country's Western Region.
AU JV Ghana (AU Presentation)
Production per Regions in Q1'23:
1.1 - Africa
Operations produced 348KAu Oz at a total cash cost of $1,135/oz for the 3-month ended March 31, 2023. Strong performances from Iduapriem and Obuasi. Also, Obuasi continued its planned ramp-up, a 58% year-on-year jump in production.
1.2 - Latin America
The Americas operations produced 111K Au Oz at a total cash cost of $1,338/oz for the period ending on March 31, 2023. Production was down YoY.
1.3 - Australia
The Australia operations produced 125K Au Oz at a total cash cost of $1,309/oz for the period ending on March 31, 2023.
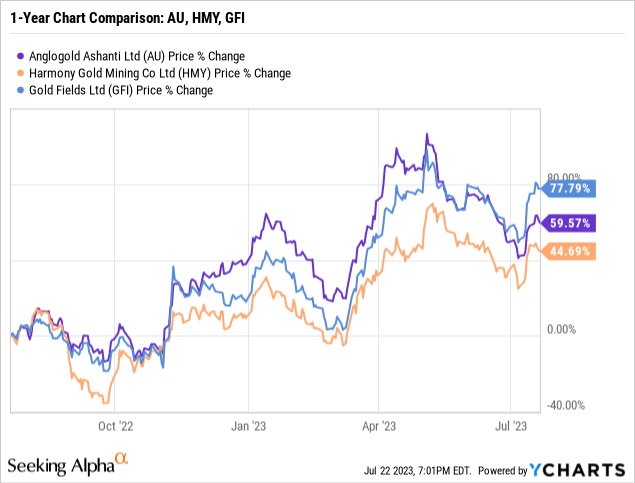
2 - Stock performance
I am covering two other gold miners mining in South Africa: Harmony Gold (HMY) and Gold Fields Ltd.
AngloGold Ashanti has dropped significantly since its peak in May 2023. However, AU is now up 60% on a one-year basis.
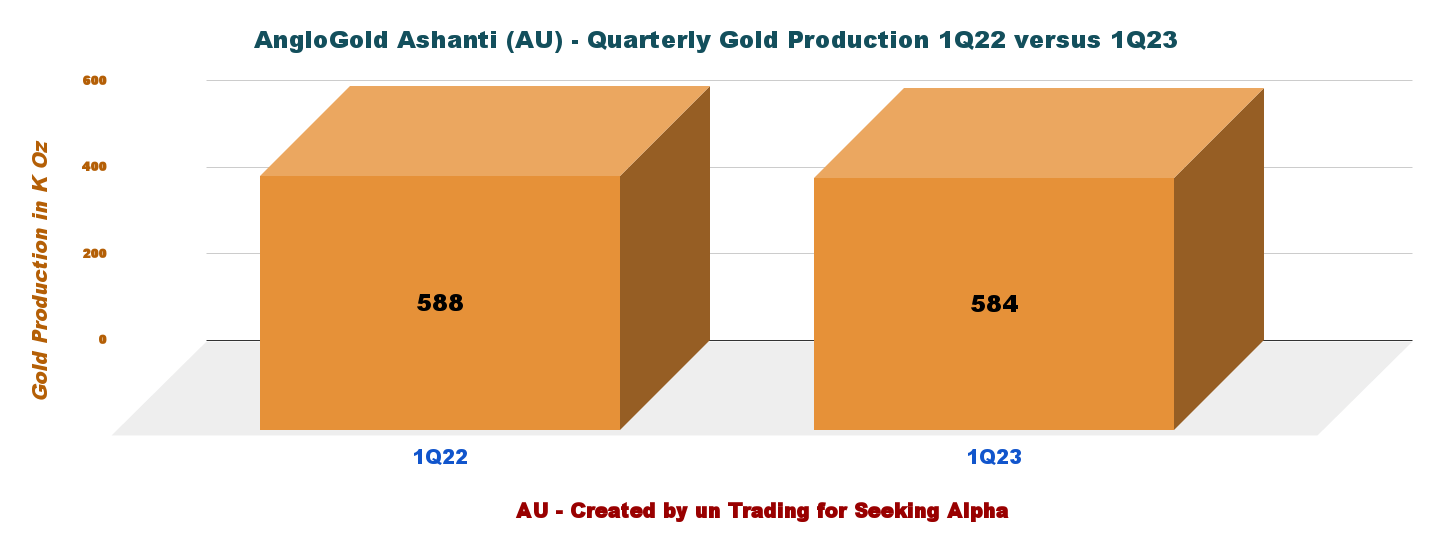
AngloGold Ashanti sold 583K Au Oz in Q1'23 and produced 584K Au Oz. Production was down 0.6% from 1Q22.
AU Quarterly Gold Production 1Q22 versus 1Q23 (Fun Trading)
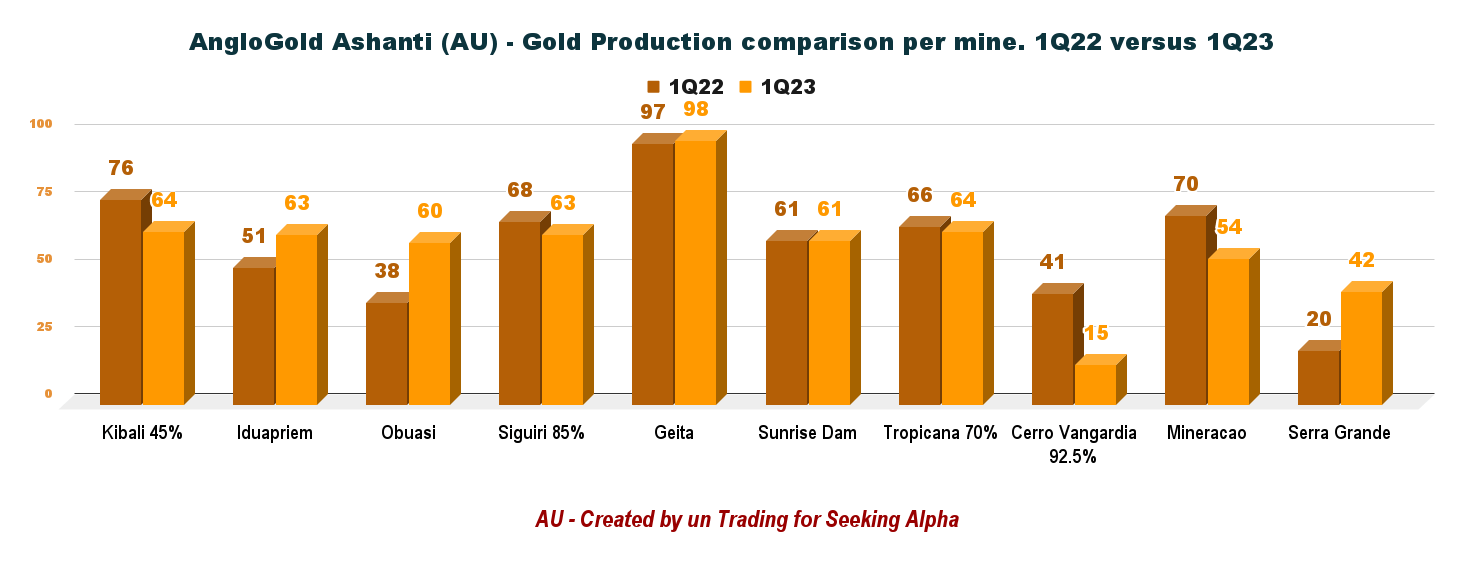
1.2 - Quarterly Production per Mine
The company produced gold from ten different mines:
AU Quarterly Production per Mine 1Q22 versus 1Q23 (Fun Trading)
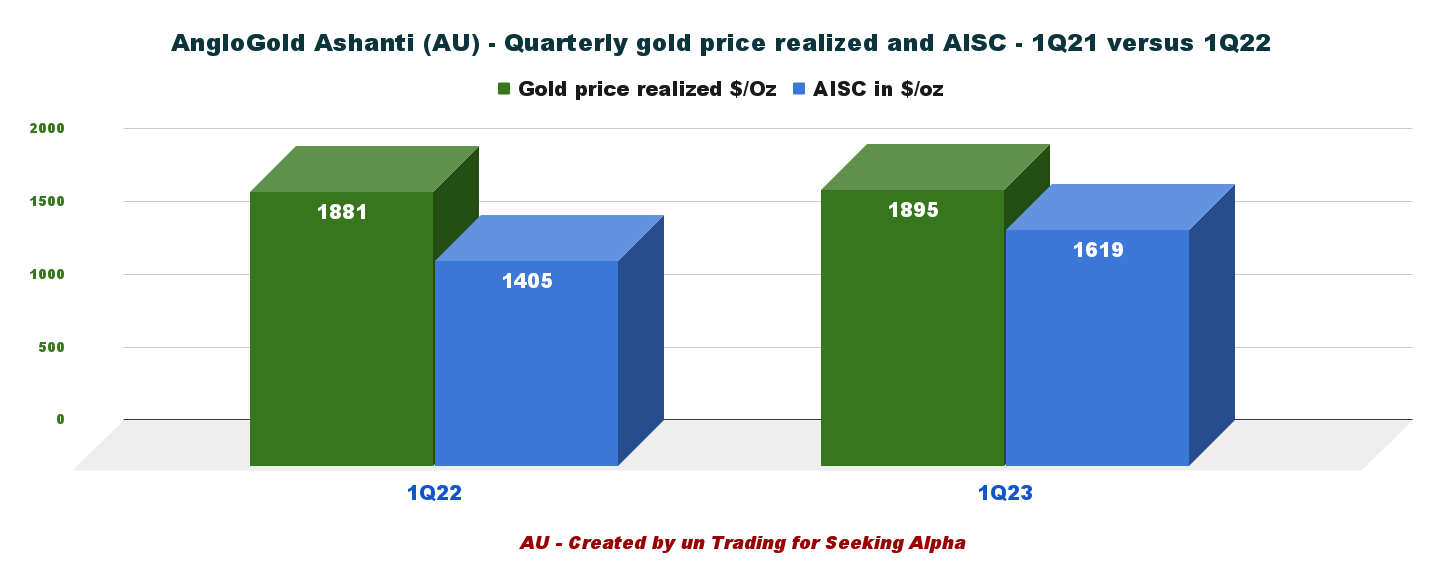
2 - All-in Sustaining Costs and Gold price realized
All-in-sustaining cost (AISC) was $1,418 per ounce in 6/2022. An increase of 6.4% from the last year-6 months was mainly due to planned higher sustaining CapEx and increased total cash costs.
AU Quarterly Gold Price and AISC 1Q22 versus 1Q23 (Fun Trading)
Part III - AngloGold Ashanti - Balance Sheet and Production Q1'22 versus Q1'23: The Raw Numbers
Note: Like most South African gold and PGM miners, full results are posted every six months, complicating the analysis.
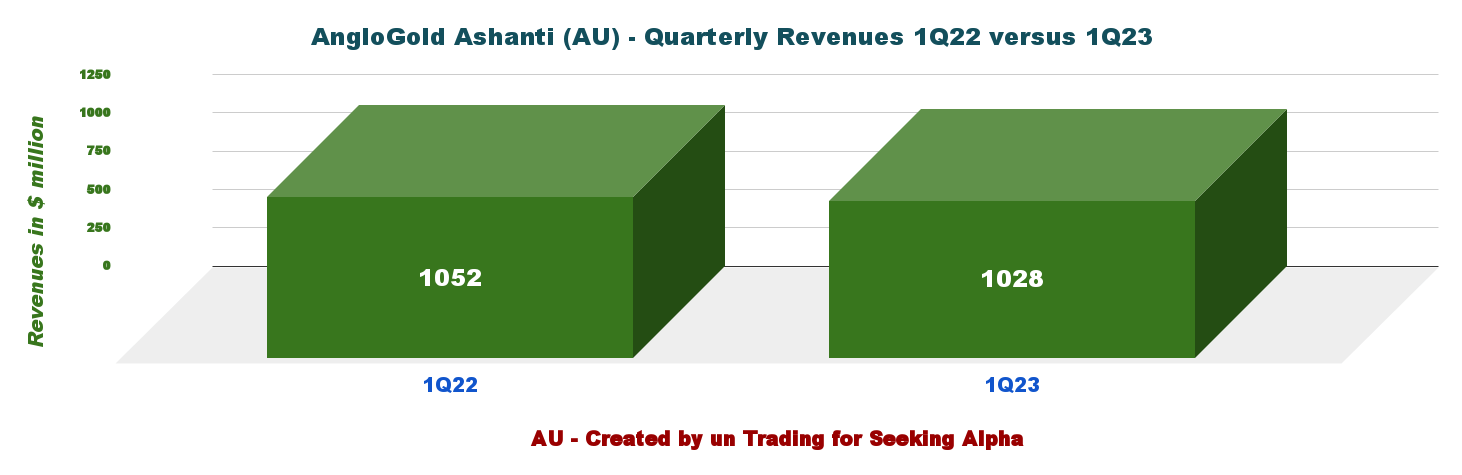
1 - Revenues and Trends. Revenues were $1,028 million in Q1'23
AU Quarterly Revenue 1Q22 versus 1Q23 (Fun Trading)
The revenues for Q1'23 were $1.028 billion. Net income was $66 million or $0.16 per diluted share.
The decrease in revenue from product sales was mainly due to the decline in gold. Condensed Consolidated Interim Financial Statements for the quarter ended 31 March 2023.
Adjusted EBITDA for the first quarter of 2023 was $320 million, compared with $438 million for 1Q22.
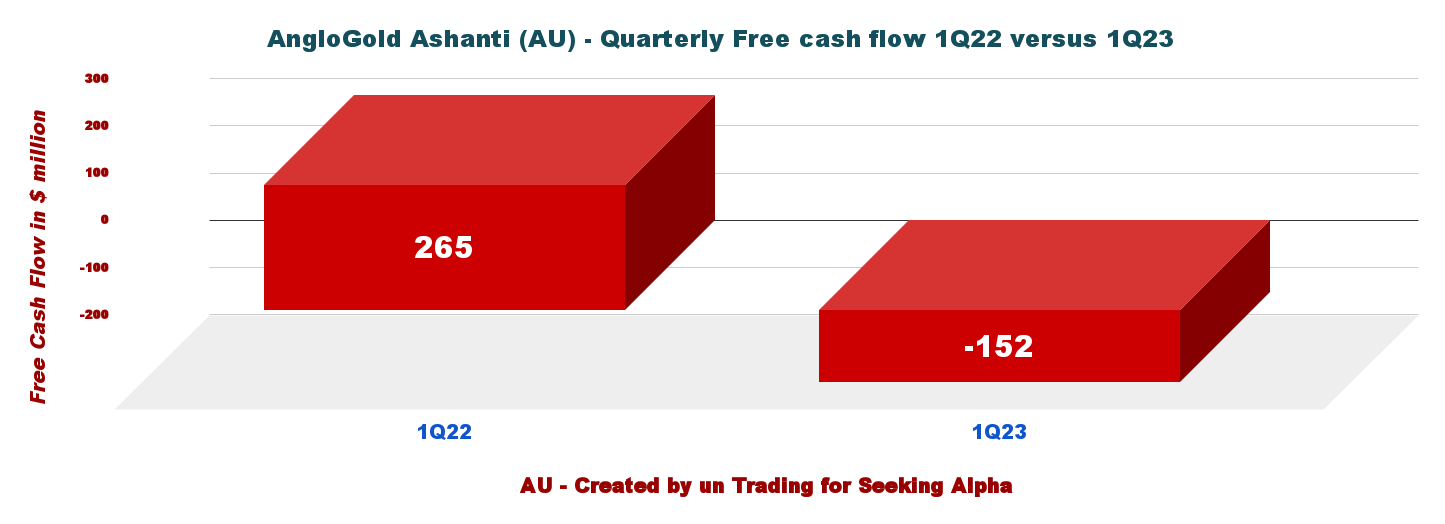
2 - Free cash flow was a loss of $152 million in Q1'23
AU Quarterly Free Cash Flow (Fun Trading)
Note: Generic free cash flow is the cash from operations minus CapEx.
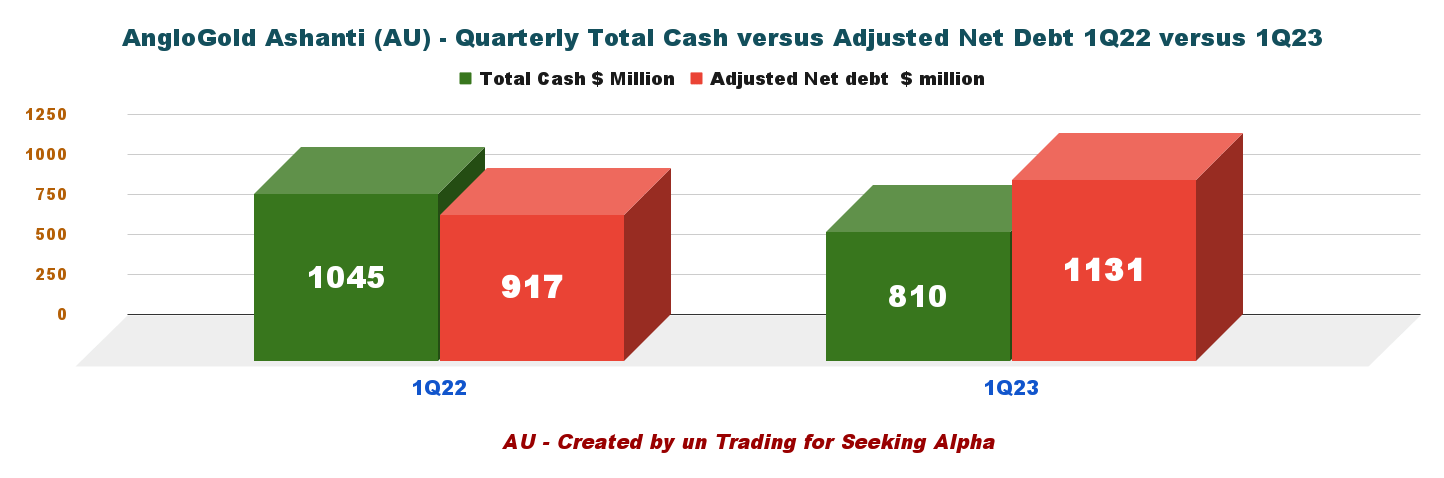
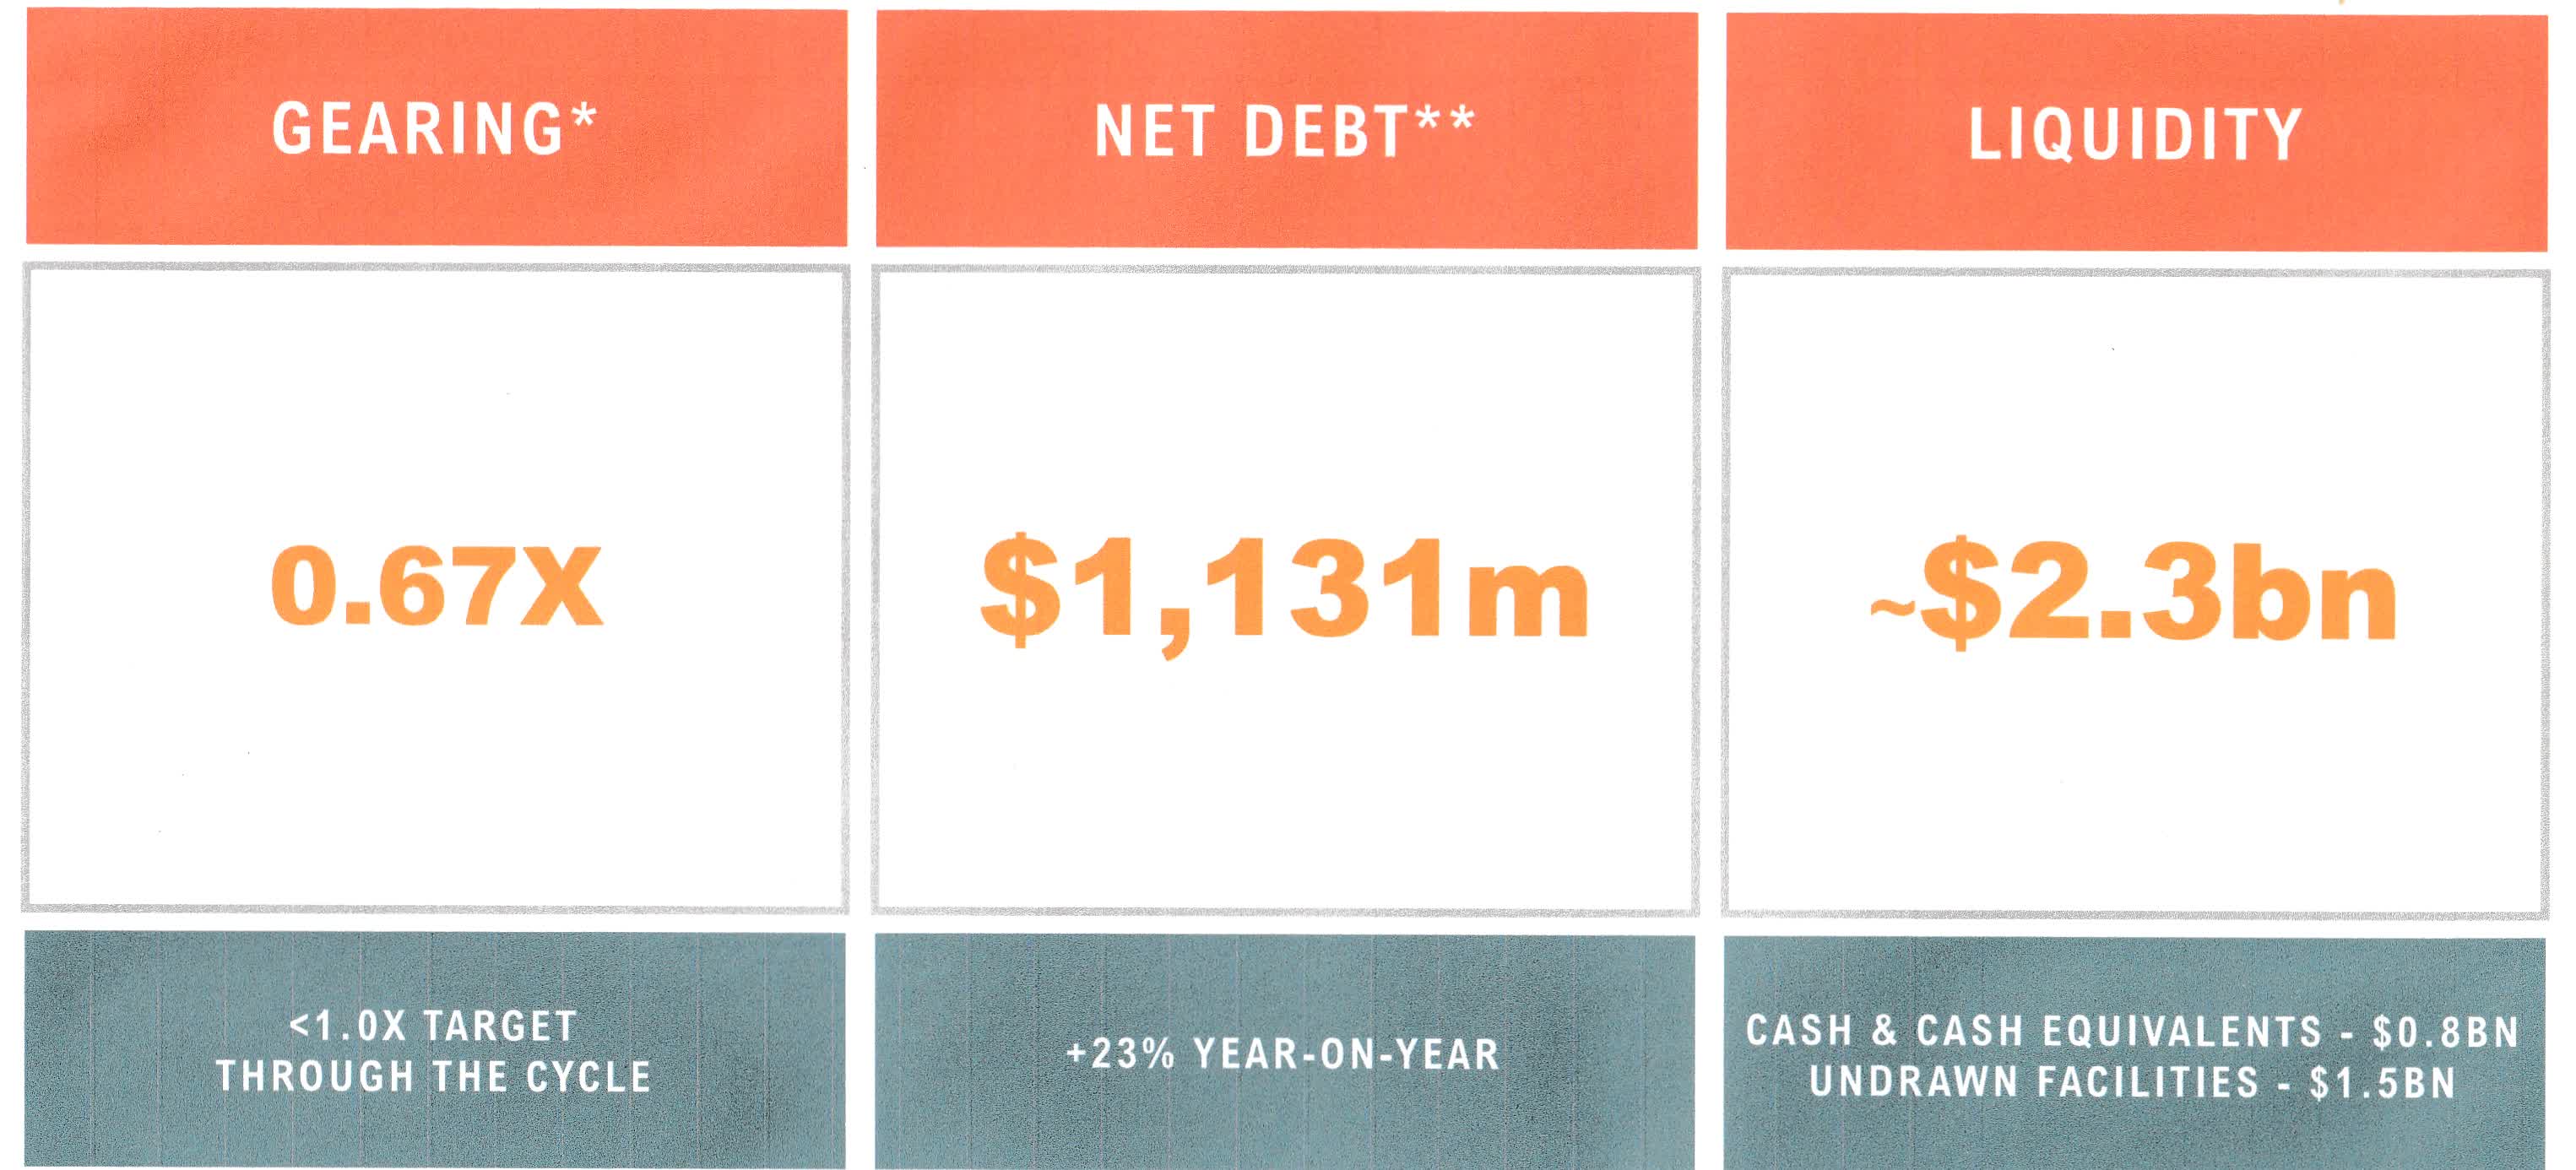
3 - AngloGold Ashanti's debt situation is stable and solid
AU Quarterly Cash and Adjusted Net Debt (Fun Trading)
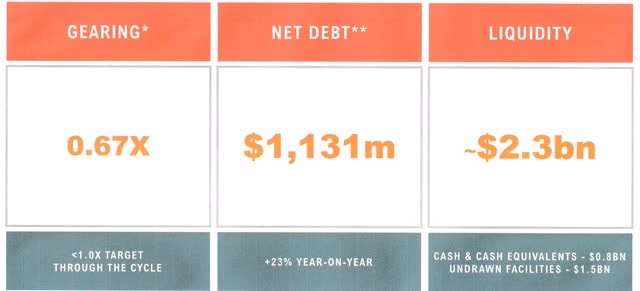
Total cash was $810 million, and net debt was $1,131 million at the end of March 2023. Liquidity is $2.3 billion.
AU Balance Sheet (AU Presentation)
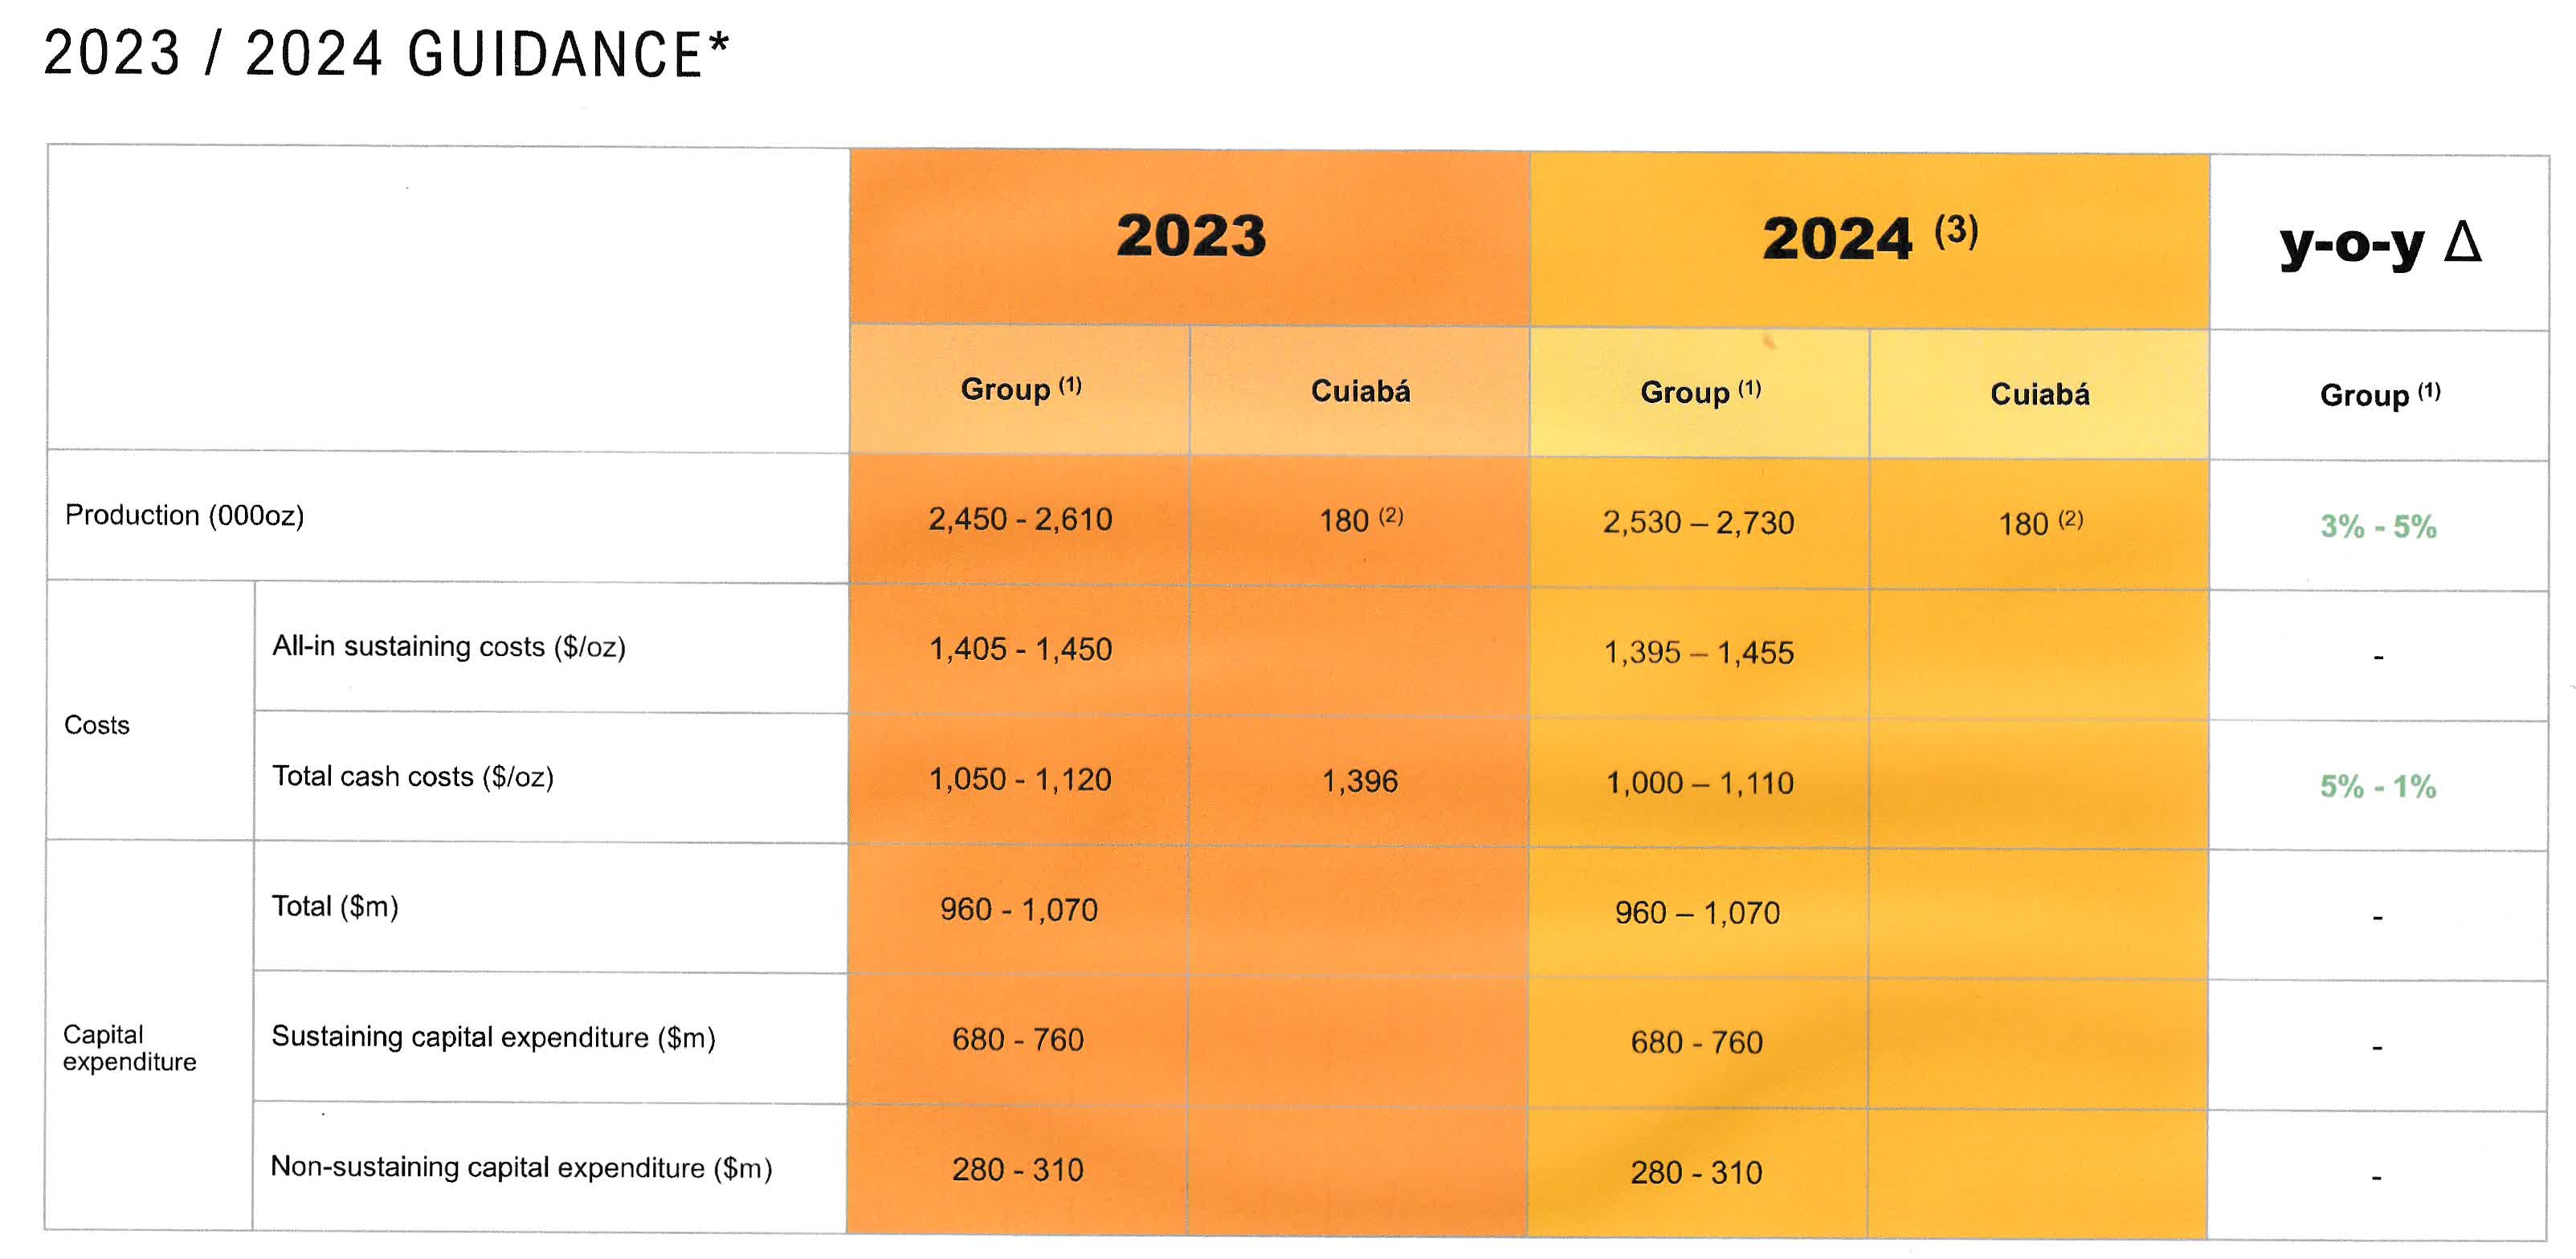
4 - 2023-2024 Guidance
2023 gold production is expected to be 2.45 Moz to 2.61 Moz, and AISC is between $1,405 and $1,450 per ounce.
CapEx will be between $0.96 billion and $1.07 billion.
AU 2023-2024 Guidance (AU Presentation)
Part IV - Technical Analysis and Commentary
AU TA Chart Short-Term (Fun Trading StockCharts)
Note: The chart has been adjusted for dividends.
AU forms a descending triangle pattern with resistance at $23.25 and support at $19.6.
The descending triangle is a bearish pattern that is characterized by a descending upper trendline and a flat lower trendline that acts as support. This pattern indicates that sellers are more aggressive than buyers as price continues to make lower highs. The pattern completes itself when price breaks out of the triangle in the direction of the overall trend.
Thus, the general strategy has not changed for AngloGold Ashanti. I recommend trading short-term LIFO about 50%-60% and keeping a core long-term position for a final target of $30. The basic strategy I recommend in my marketplace is "The Gold and Oil Corner."
For this week, I recommend trading the channel by selling about 50%-60% of your position between $23 and $23.5 with possible higher support at $25.8 and accumulating between $20 and $19.5 with possible lower support at $17.25.
Warning: The TA chart must be updated frequently to be relevant. It is what I am doing in my stock tracker. The chart above has a possible validity of about a week. Remember, the TA chart is a tool only to help you adopt the right strategy. It is not a way to foresee the future. No one and nothing can.
Join my "Gold and Oil Corner" today, and discuss ideas and strategies freely in my private chat room. Click here to subscribe now.
You will have access to 57+ stocks at your fingertips with my exclusive Fun Trading's stock tracker. Do not be alone and enjoy an honest exchange with a veteran trader with more than thirty years of experience.
"It's not only moving that creates new starting points. Sometimes all it takes is a subtle shift in perspective," Kristin Armstrong.
Fun Trading has been writing since 2014, and you will have total access to his 1,988 articles and counting.
As an experienced investor, I will help you stay on task more efficiently.
I am a former test & measurement doctor engineer (geodetic metrology). I was interested in quantum metrology for a while.
I live mostly in Sweden with my loving wife.
I have also managed an old and broad private family Portfolio successfully -- now officially retired but still active -- and trade personally a medium-size portfolio for over 40 years.
“Logic will get you from A to B. Imagination will take you everywhere.” Einstein.
Note: I am not a financial advisor. All articles are my honest opinion. It is your responsibility to conduct your own due diligence before investing or trading.
Analyst’s Disclosure:I/we have a beneficial long position in the shares of GFI either through stock ownership, options, or other derivatives. I wrote this article myself, and it expresses my own opinions. I am not receiving compensation for it (other than from Seeking Alpha). I have no business relationship with any company whose stock is mentioned in this article.
I trade short-term AU and GFI occasionally.
Seeking Alpha's Disclosure: Past performance is no guarantee of future results. No recommendation or advice is being given as to whether any investment is suitable for a particular investor. Any views or opinions expressed above may not reflect those of Seeking Alpha as a whole. Seeking Alpha is not a licensed securities dealer, broker or US investment adviser or investment bank. Our analysts are third party authors that include both professional investors and individual investors who may not be licensed or certified by any institute or regulatory body.
Recommended For You
Comments
Disagree with this article? Submit your own. To report a factual error in this article, . Your feedback matters to us!
To ensure this doesn’t happen in the future, please enable Javascript and cookies in your browser.