CEF Weekly Review: (Some) CEF Net Income Turns Negative

Summary
- We review CEF market valuation and performance through the second week of July and highlight recent market action.
- CEFs had a good week overall as NAVs gained, however, discounts remain sluggish.
- The net income profile of some CEFs has turned negative, owing to a high cost of leverage.
- We recently reduced our allocation to credit CEFs on the back of the continued rally and as high-yield corporate bond spreads moved below 4%.
- Looking for a helping hand in the market? Members of Systematic Income get exclusive ideas and guidance to navigate any climate. Learn More »
Darren415
Welcome to another installment of our CEF Market Weekly Review where we discuss closed-end fund ("CEF") market activity from both the bottom-up - highlighting individual fund news and events - as well as the top-down - providing an overview of the broader market. We also try to provide some historical context as well as the relevant themes that look to be driving markets or that investors ought to be mindful of.
This update covers the period through the second week of July. Be sure to check out our other weekly updates covering the business development company ("BDC") as well as the preferreds/baby bond markets for perspectives across the broader income space.
Market Action
CEFs were mostly up on the week in line with other income sectors. However, what was somewhat unusual was that while NAVs rallied nearly across the board, discounts tightened in only 3 of the sectors.
Systematic Income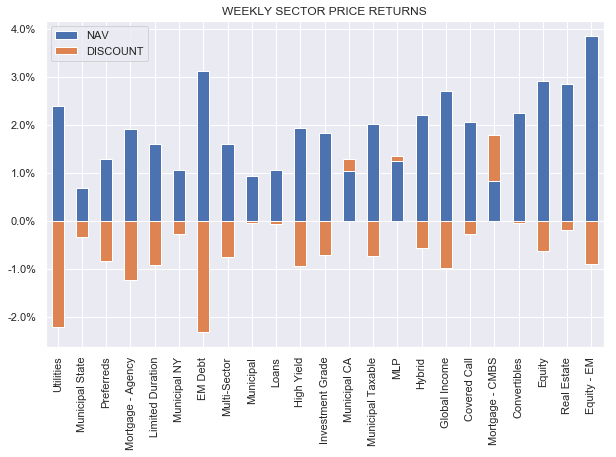
It's possible this sour risk sentiment is due to the lingering distribution cuts across the CEF space we have seen over the last 18 months or so. Alternatively, the see-saw action in CEFs is keeping investors on guard for another potential sell-off.
The average CEF sector discount remains fairly wide by historic standards as the following chart shows.
Systematic Income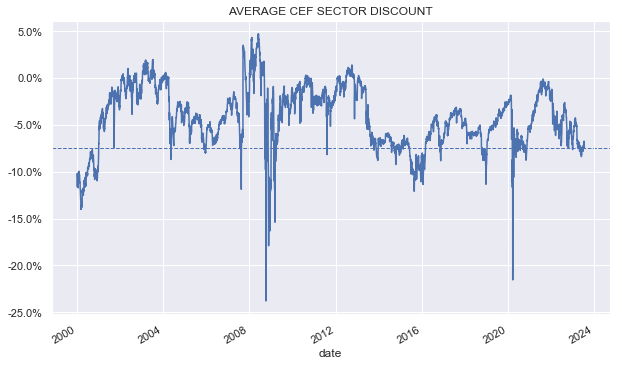
Market Commentary
A number of Calamos CEFs have issued their shareholder reports. These funds tend to hold a lot of convertible bonds and common stocks with some corporate bonds as well. They also tend to run at a fairly high level of leverage.
Convertible bonds are somewhat unusual as they tend to have rockbottom coupons - on the order of zero to 2%. This is because they derive most of their value from the option to convert to the common stock.
Investors are happy to get a low coupon because of the high convexity where the upside is uncapped but the downside is floored at the price of an unsecured bond. So while the asset side income has always been low, interest expenses have increased.
And as credit CEFs have seen drops in net income over the last 18 months, convertible bond funds have seen their net income turn negative. For example, both CSQ and CHI net income moved below zero in the last report.
Calamos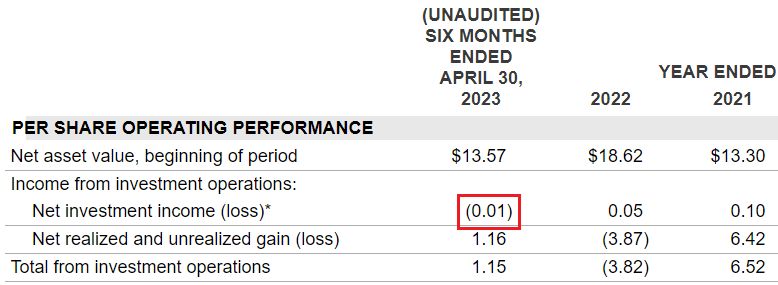
Arguably, the net income profile of these funds has always been very low. Furthermore, these funds are not held because of their high level of portfolio income but a turn to negative net income is still notable.
Market Commentary
Nuveen plans to merge four of their loan CEFs: NSL, JRO, JSD and JFR into JFR. A quick look at the NAV return correlations shows that the funds are very similar to each other so this is not a surprise.
Systematic Income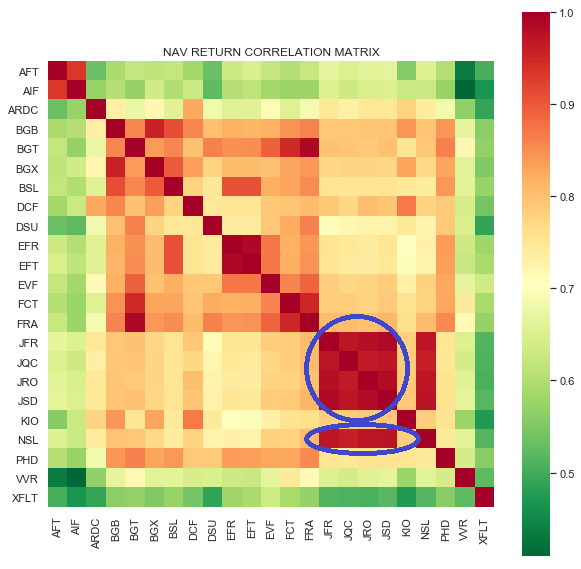
It's odd that they are also not merging JQC which is just as similar as the other 4 funds. Elsewhere in the sector, Eaton Vance should merge EFR and EFT as these two funds are also very similar to each other.
There are pros and cons to the mergers - the remaining funds should have higher liquidity and a lower level of net expenses, particularly for Nuveen which features an amortizing fee schedule, resulting in lower fees for larger funds. However, it will also reduce the number of relative value opportunities.
Utilities CEF Reaves Utility Income Fund (UTG) released its semi-annual report. UTG is on a lot of people's lists because it has never cut its distribution and, in fact, raised it substantially since its inception 20 years ago.
This is good enough for most investors, however, it's worth highlighting a couple of things. One, net investment income runs to around $0.057 versus a distribution of $0.19 or coverage of about 30%. Pretty standard for equity CEFs - not a big deal.
A bigger deal is the fund's performance. UTG has generated a total NAV return of 4.2% over the last 5 years. XLU - the benchmark Utilities ETF - has returned 8.4% or about double. That's quite a big gap, particularly when you compound it over 5 years.
This level of underperformance is especially odd given the fund's leverage. In a rising market, leverage gives you a head start. The fund runs at around 20% of leverage. Once we adjust for its leverage, we get to an unleveraged performance of around 3.4% versus XLU at the same 8.4%.
UTG is not a 100% Utilities fund - it has allocations to other sectors like REITs, Energy, Media etc for a substantial portion of its portfolio. However, what's interesting here is that had it allocated its non-Utilities holdings to SPY, it would have delivered returns roughly on par with XLU (because SPY outperformed XLU) but it didn't.
The REIT or the Energy allocation probably didn't help things, however, it's not clear that the fund is even very good at picking Utilities. Overall, it's clear that distribution level and stability carry the day in terms of investor attention, however, significant and consistent underperformance is a bigger problem not only for investor wealth but for its distribution sustainability.
Stance and Takeaways
We recently reduced our allocation to corporate bond CEFs in light of the sharp rally over the last few weeks. High-yield corporate bond spreads have moved below 4% - the tightest level since May 2022 and well below the historic average outside of recessions. Although discounts and yields remain attractive across the space, the rally leaves a much smaller margin of safety on offer for credit investors, particularly in light of the trend in the macro picture and corporate defaults.
Check out Systematic Income and explore our Income Portfolios, engineered with both yield and risk management considerations.
Use our powerful Interactive Investor Tools to navigate the BDC, CEF, OEF, preferred and baby bond markets.
Read our Investor Guides: to CEFs, Preferreds and PIMCO CEFs.
Check us out on a no-risk basis - sign up for a 2-week free trial!

This article was written by

At Systematic Income our aim is to build robust Income Portfolios with mid-to-high single digit yields and provide investors with unique Interactive Tools to cut through the wealth of different investment options across BDCs, CEFs, ETFs, mutual funds, preferred stocks and more. Join us on our Marketplace service Systematic Income.
Our background is in research and trading at several bulge-bracket global investment banks along with technical savvy which helps to round out our service.
Analyst’s Disclosure: I/we have no stock, option or similar derivative position in any of the companies mentioned, and no plans to initiate any such positions within the next 72 hours. I wrote this article myself, and it expresses my own opinions. I am not receiving compensation for it (other than from Seeking Alpha). I have no business relationship with any company whose stock is mentioned in this article.
Seeking Alpha's Disclosure: Past performance is no guarantee of future results. No recommendation or advice is being given as to whether any investment is suitable for a particular investor. Any views or opinions expressed above may not reflect those of Seeking Alpha as a whole. Seeking Alpha is not a licensed securities dealer, broker or US investment adviser or investment bank. Our analysts are third party authors that include both professional investors and individual investors who may not be licensed or certified by any institute or regulatory body.