IUSV And IUSG: Value And Growth ETFs Showing Overlap

Summary
- iShares Core S&P U.S. Value ETF and iShares Core S&P U.S. Growth ETF are supposed to represent different areas of the market but overlap on some unexpected names.
- The ETFs may not accurately reflect what is expected, with some growth names included in the value-oriented portfolio and vice versa, potentially distorting the picture of what should be represented.
- The ETFs offer diversified portfolios with low expense ratios of 0.04% and may still produce strong results over the long term.
- This idea was discussed in more depth with members of my private investing community, CEF/ETF Income Laboratory. Learn More »
Lemon_tm
Written by Nick Ackerman, co-produced by Stanford Chemist.
iShares Core S&P U.S. Value ETF (NASDAQ:IUSV) and iShares Core S&P U.S. Growth ETF (NASDAQ:IUSG) are supposed to represent quite different areas of the market. They could be considered a way to provide an investable barometer for performance in each respective category.
IUSV tracks the S&P 900 Value Index, and it states this as its investment objective:
The iShares Core S&P U.S. Value ETF seeks to track the investment results of an index composed of large- and mid-capitalization U.S. equities that exhibit value characteristics
IUSG tracks the S&P 900 Growth Index, and it states this as its investment objective:
The iShares Core S&P U.S. Growth ETF seeks to track the investment results of an index composed of large- and mid-capitalization U.S. equities that exhibit growth characteristics
However, these barometers actually have some overlap. In particular, it is interesting that Meta Platforms (META), Amazon (AMZN) and Netflix (NFLX) are included as value investments.
IUSV And IUSG Top Ten Holdings (Seeking Alpha)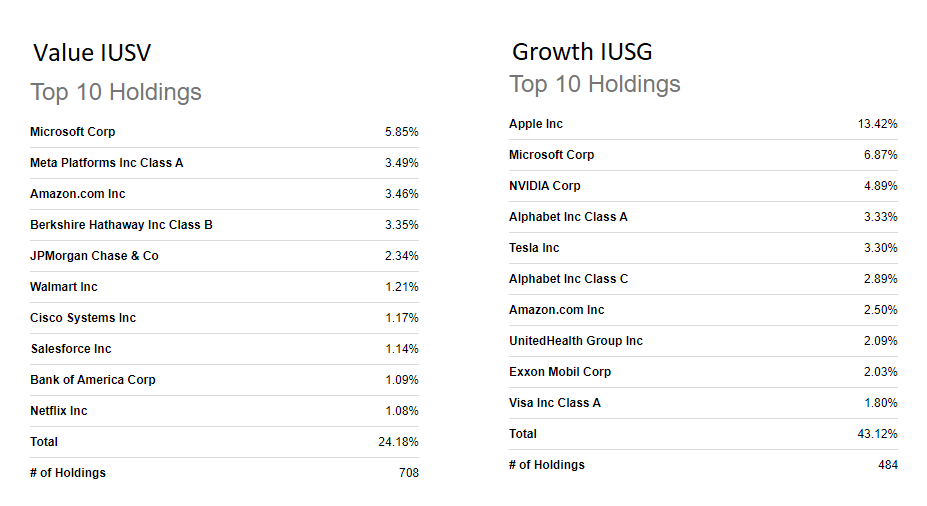
Generally, a low P/E and low P/B would be metrics associated with value-oriented positions. A higher dividend yield than the S&P 500 Index could also be considered another feature. AMZN, in particular, is off the charts with its P/E ratio, and META appears to be the only thing closely related to "value," if you could call it that.
META, AMZN And NFLX P/E (Portfolio Insight)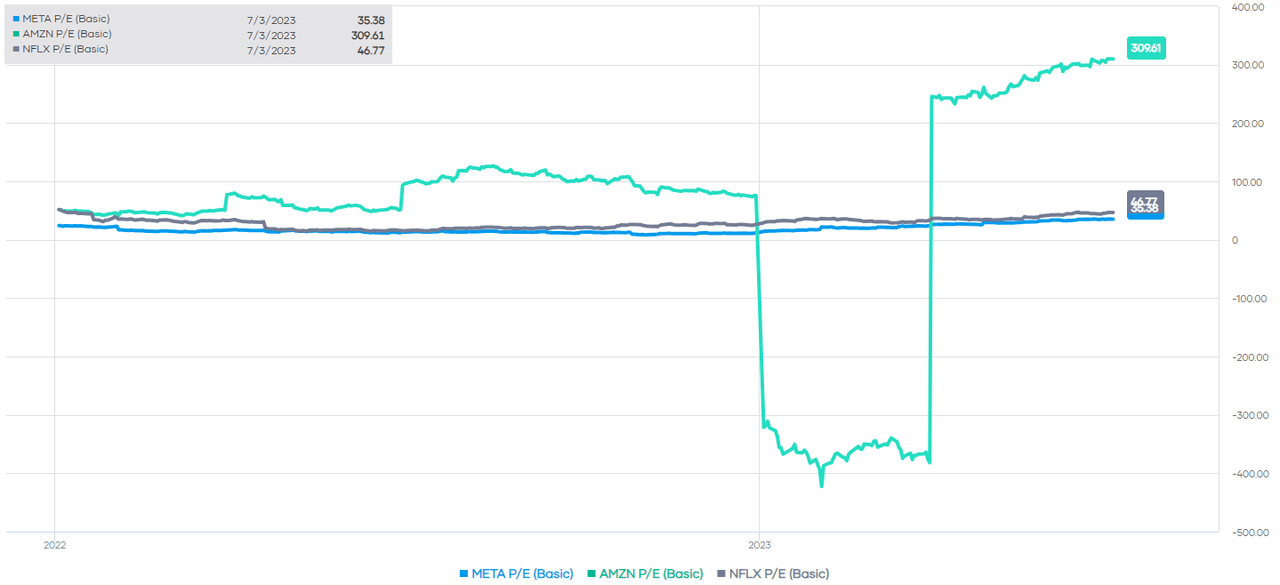
The forward P/E on these companies is a bit lower. For example, AMZN's forward P/E is a bit more grounded at 83x compared to its current P/E. Clearly, we're still looking at richly valued companies based on this traditional valuation metric.
On a P/B basis, these would clearly be richly valued as well.
META, AMZN And NFLX P/B (Portfolio Insight)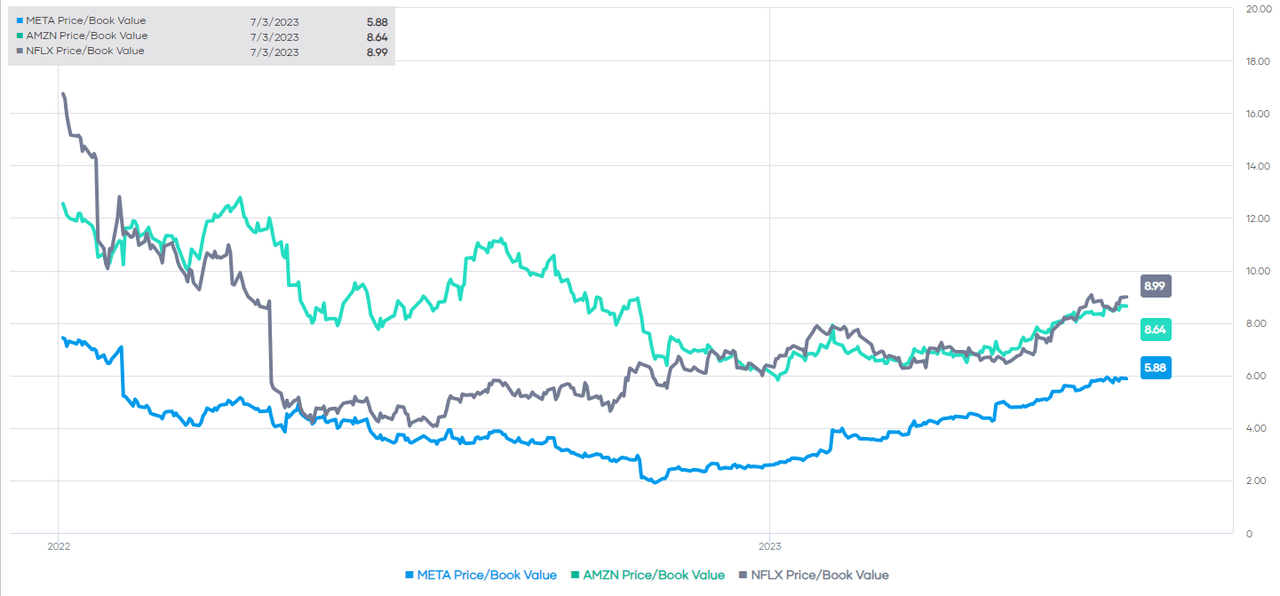
Microsoft (MSFT) could also be considered more growth-oriented, with a forward P/E of 35x. At least MSFT provides a dividend, which checks that value position box. Otherwise, these holdings are the quintessential examples of growth.
The value index takes the S&P 500 and S&P MidCap 400 for potential inclusion. The methodology then includes book value, earnings and sales-to-price ratios as measurements for inclusions. It still clearly allows for some pricey positions to be considered.
That being said, conversely, Exxon Mobil (XOM) is included in the growth-oriented ETF IUSG. That's something that would generally be assumed to be a value-oriented holding and comes with those characteristics of lower valuations. It even sports a nice dividend yield.
XOM P/B, P/E And Dividend Yield (Portfolio Insight)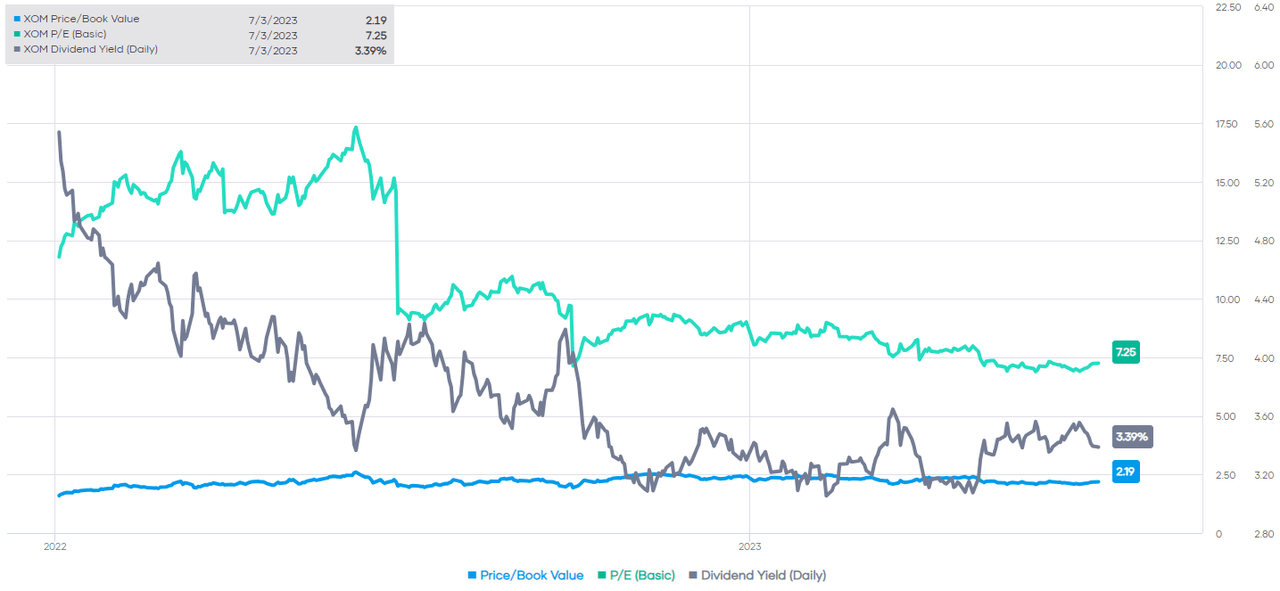
For inclusion in the growth index that's being tracked, they also take the same broader indexes as the value index. Then the methodology includes "sales growth, the ratio of earnings change to price and momentum."
If one is trying to use these sorts of benchmarks, it could be providing a fairly inaccurate picture. At least, what one might believe should be represented when looking at these barometers.
Being positioned in these growth names will also limit the dividend yield for IUSV. When thinking about value, it's more about mature companies that provide tons of cash flows and pass those cash flows onto investors. The yield for IUSV is higher relative to IUSG and compared to the S&P 500 Index, as represented by the SPDR S&P 500 ETF (SPY). However, if they were holding all dividend-paying value-oriented positions, the yield could be even higher.
IUSV, IUSG And SPY Dividend Yields (Seeking Alpha)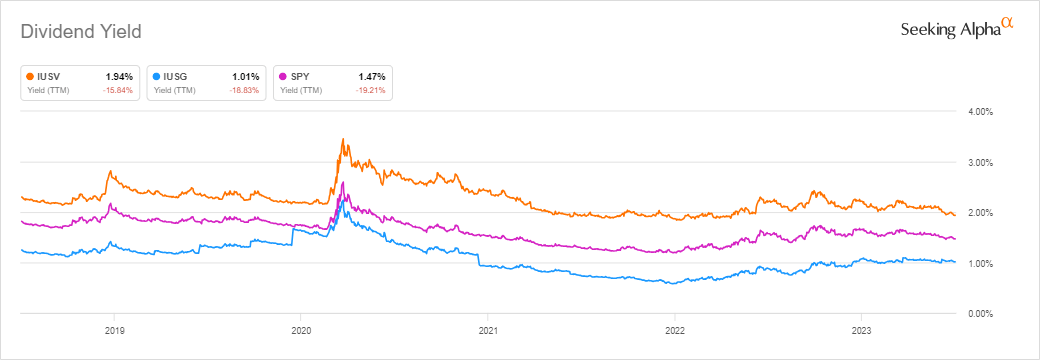
The dividend yield for IUSV is low when compared to the broader ETF space too. The dividend growth rate was also low over the last year, three years and five years.
IUSV Dividend Grade (Seeking Alpha)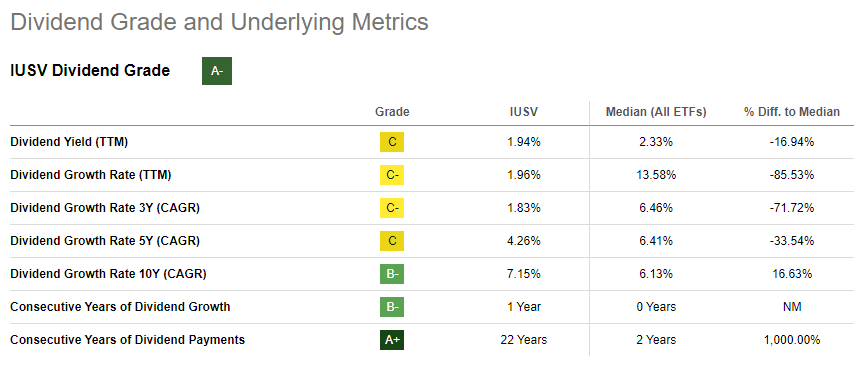
Speaking of the S&P 500, this is all somewhat related to how the S&P 500 Index is often regarded as the 'market.' However, even that index is becoming less reliable as it gravitates towards more and more tech weighting. Instead, I believe that the Invesco S&P 500 Equal Weight ETF (RSP) may represent a better barometer of the overall market.
On a total return basis, YTD, the SPY has outperformed RSP significantly, but RSP reduces the overweighting that MSFT and Apple (AAPL) represent. MSFT and AAPL now account for around 14.5% of SPY. Earlier in the year, these two barometers of the market were actually correlating quite closely; that was before the March banking crisis.
SPY And RSP Total Return Comparison (Seeking Alpha)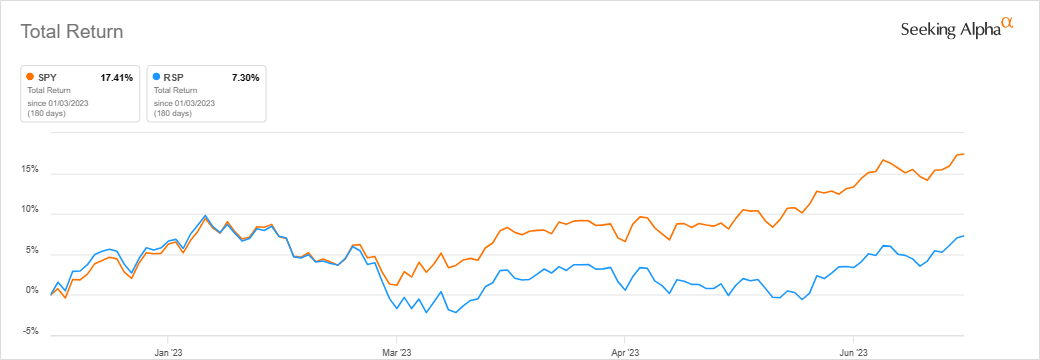
To be fair, these are only a few selections based on the top holdings that I'm picking on. Underneath the surface, there are plenty of differences, and that has led to fairly significant performance YTD.
IUSV And IUSG Price Return (Seeking Alpha)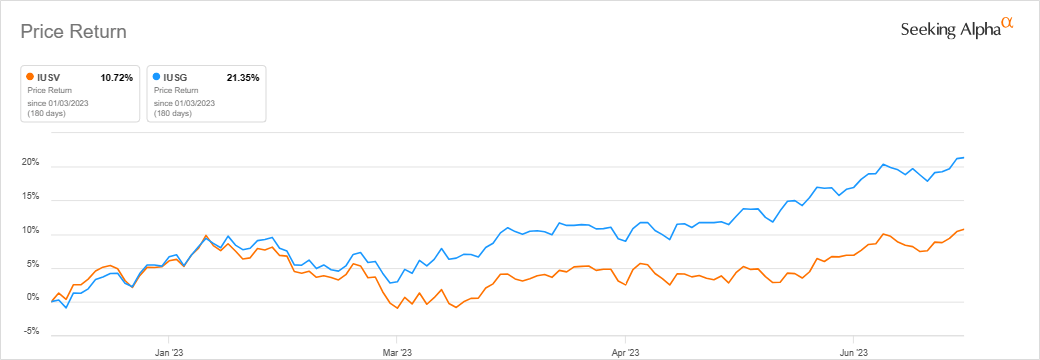
These differences can start to be seen a bit more broadly when looking at the sector allocations between these two ETFs. Tech is often associated with growth, and IUSG is significantly overweight relative to the rest of the fund's sector exposure. Some of this is simply due to just how much IUSG allocates to MSFT and AAPL. Those two positions represent over 20% of the fund.
On the other side, IUSV has its largest allocation dedicated to financials. Financials tend to be value-oriented. However, it's to a much less prevalent level relative to how overweight IUSG is showing. That leaves a higher percentage that can be allocated elsewhere. In particular, tech represents the second largest sector at a fairly material weight. The weighting is almost as high as the financial exposure for the fund.
IUSV And IUSG Sector Exposure Comparison (BlackRock)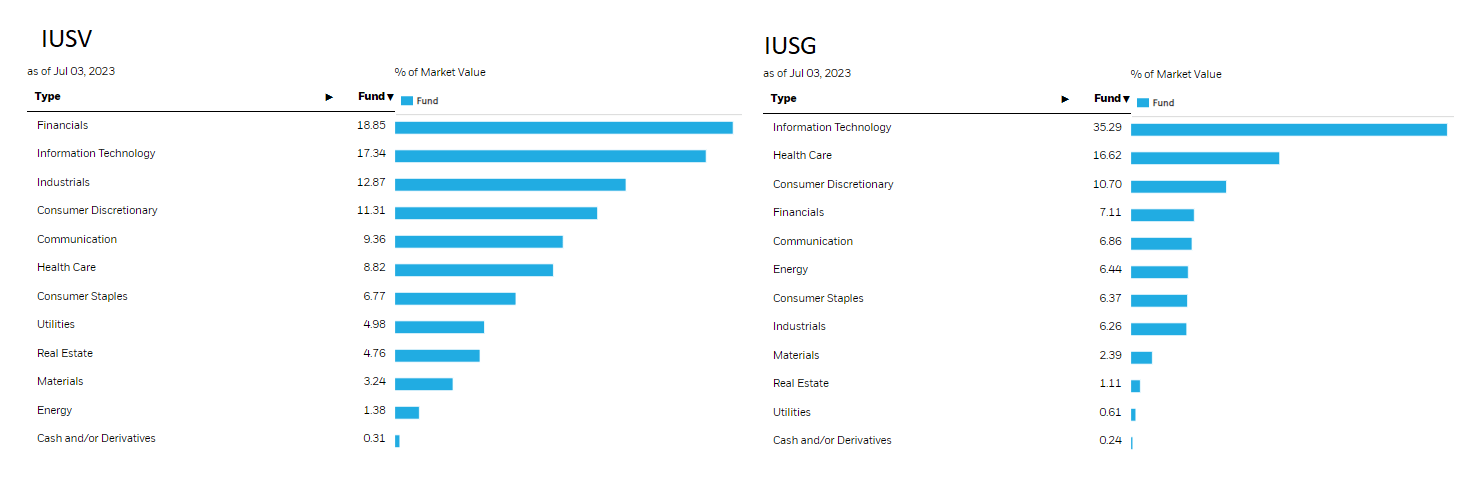
Finally, we can see more differences when looking at the valuation metrics provided by each fund's benchmark index. While trailing P/E is similar for each, the forward P/E ratios show a divergence. Additionally, the P/B and the P/Sales show a significant difference as well. These tables were provided by the latest fact sheets of the S&P 900 Value Index and the S&P 900 Growth Index located on each website.
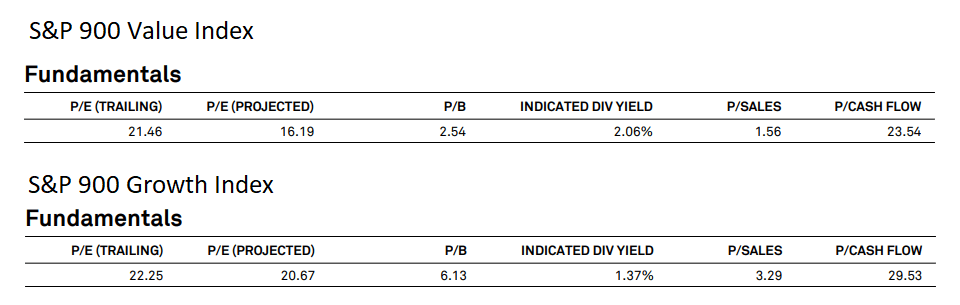
S&P 900 Value And Growth Index Fundamental Comparisons (S&P Global)
Conclusion
All this isn't to say that these ETFs aren't worth investing in. They're fairly diverse portfolios with a strong chance of producing respectable total return results over the long term or as long as equities perform well. Both of these ETFs are passively invested funds that track indexes, so they are simply providing positioning how their benchmarks dictate.
As passively managed ETFs that track indexes, they can offer incredibly low expense ratios of 0.04%. That can be compared to all ETFs' median 0.49% expense ratio. However, they might not be positioned exactly as one might initially expect. Of course, this would become apparent when one starts their due diligence for considering either of these funds.
At the CEF/ETF Income Laboratory, we manage closed-end fund (CEF) and exchange-traded fund (ETF) portfolios targeting safe and reliable ~8% yields to make income investing easy for you. Check out what our members have to say about our service.

To see all that our exclusive membership has to offer, sign up for a free trial by clicking on the button below!

This article was written by

---------------------------------------------------------------------------------------------------------------
I provide my work regularly to CEF/ETF Income Laboratory with articles that have an exclusivity period, this is noted in such articles. CEF/ETF Income Laboratory is a Marketplace Service provided by Stanford Chemist, right here on Seeking Alpha.
Analyst’s Disclosure: I/we have a beneficial long position in the shares of MSFT either through stock ownership, options, or other derivatives. I wrote this article myself, and it expresses my own opinions. I am not receiving compensation for it (other than from Seeking Alpha). I have no business relationship with any company whose stock is mentioned in this article.
Seeking Alpha's Disclosure: Past performance is no guarantee of future results. No recommendation or advice is being given as to whether any investment is suitable for a particular investor. Any views or opinions expressed above may not reflect those of Seeking Alpha as a whole. Seeking Alpha is not a licensed securities dealer, broker or US investment adviser or investment bank. Our analysts are third party authors that include both professional investors and individual investors who may not be licensed or certified by any institute or regulatory body.
Recommended For You
Comments (1)
CEFs are too complicated and frustrating.