EWI: Italian Stocks Are Positioned For Momentum

Summary
- Key indicators suggest the iShares MSCI Italy ETF's surge near 45% year-over-year might continue.
- Regional risk premiums are among the best in Europe.
- The EWI ETF has a value-centric investment approach, which could benefit in a "higher for longer" interest rate environment.
- Cyclical sector exposure and a high beta coefficient mean the EWI ETF is suitable for risk-seeking investors.
- Non-negligible risks remain. However, we believe the EWI ETF's positives outweigh its negatives.
- Looking for a helping hand in the market? Members of The Factor Investing Hub get exclusive ideas and guidance to navigate any climate. Learn More »
adisa/iStock via Getty Images
The iShares MSCI Italy ETF (NYSEARCA:EWI) presents an interesting prospect to research analysts and investors alike. The exchange-traded fund ("ETF") has gained by nearly 45% in the past twelve months amid support from Italy's endogenous macroeconomic factors. Moreover, the ETF holds exposure to a few high-quality companies, providing it with an advantage during a trying time for global financial markets.
EWI's Returns (Seeking Alpha)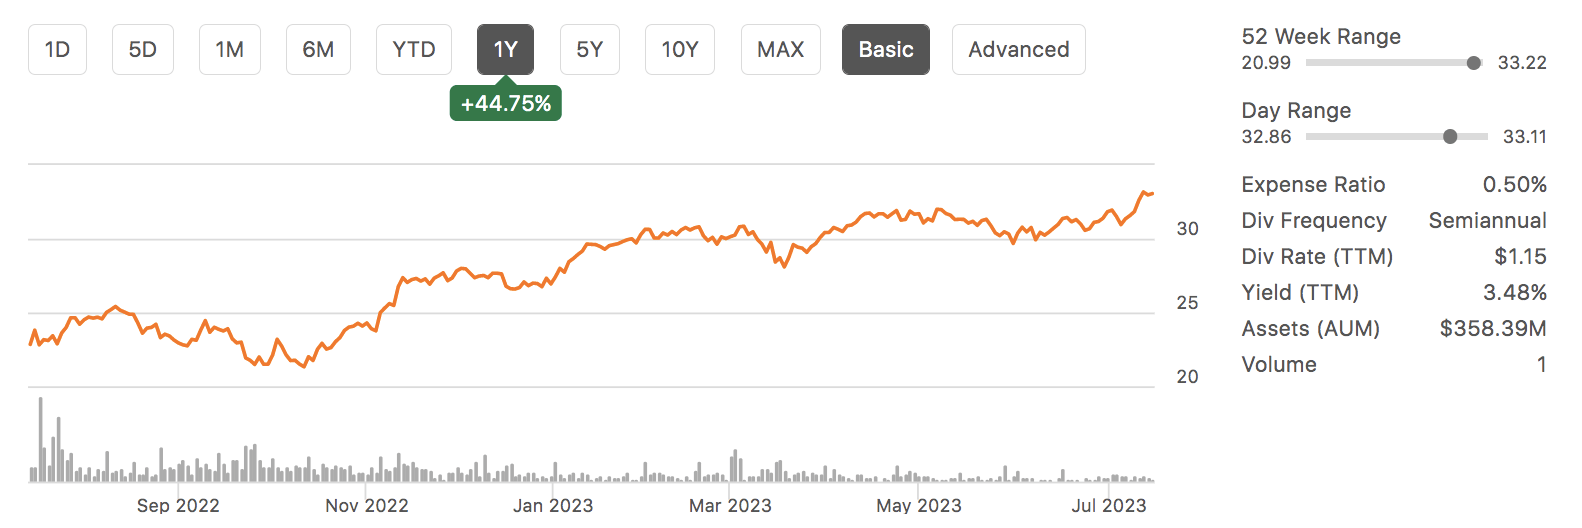
Although EWI has performed strongly in recent times, we need to remind ourselves that the stock market is cyclical. As such, we thought it might be prudent to assess and discuss EWI's prospects after its strong year-over-year gains.
Here are a few factors to consider.
Positives
Many European markets are suffering from inverted yield curves amid recessionary fears and high levels of government bond supply, leading to depleted stock valuations. However, if the world's economic challenges are considered, one might have to conclude that Italy's moderately upward-sloping yield curve is admirable.
For those unaware, the yield curve illustrates the market's anticipation of short-term interest rates. Moreover, the financial markets typically use the yield curve as a reference for future economic growth, and a moderately upward-sloping yield curve is deemed desirable. A moderate curve concurrently results in lower market risk premiums and higher stock valuations.
Italian Yield Curve (worldgovernmentbonds.com)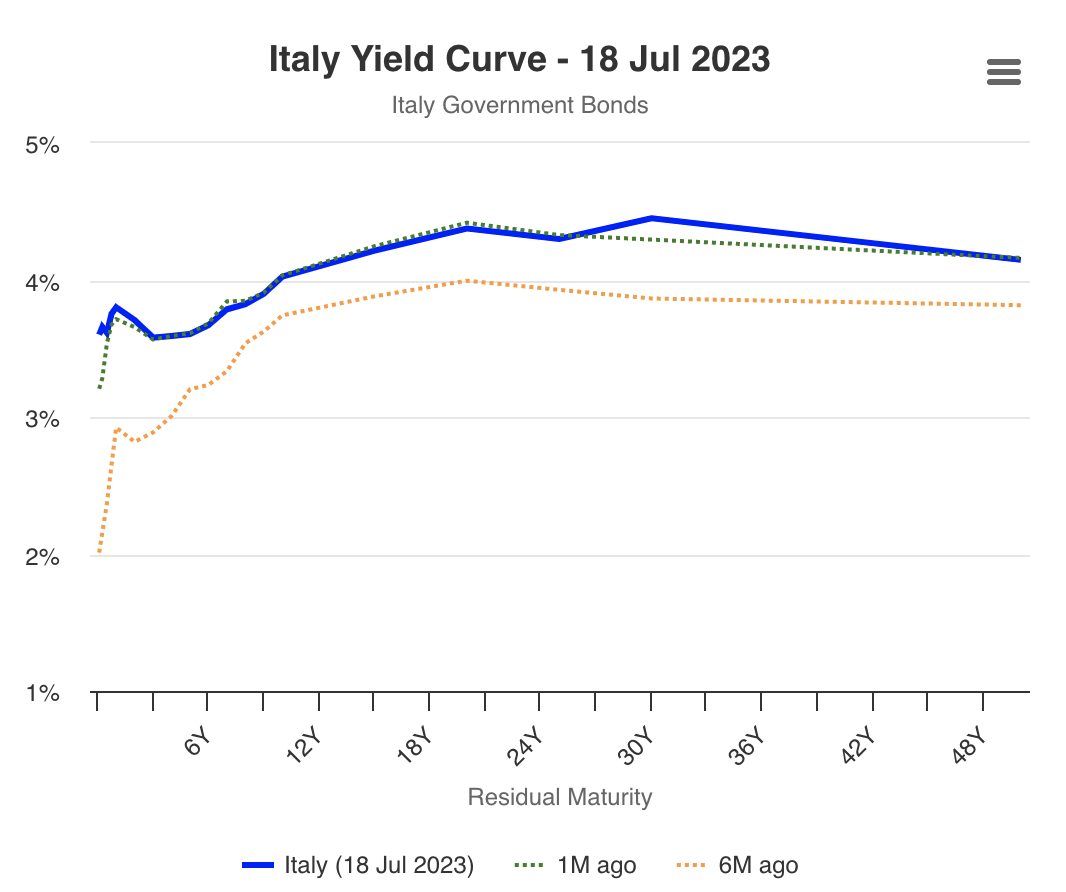
Another interesting fact about Italy's financial markets is the limited credit risk. As displayed in the diagram below, Italy's 5-year CDS values have tapered significantly in the past year, suggesting lower credit risk spreads, which might allow risky assets such as stocks to gain value.
Although these values are retrospective, Italy's latest inflation and GDP numbers suggest a prolonged trend might realize.
5-Year CDS Values (worldgovernmentbonds.com)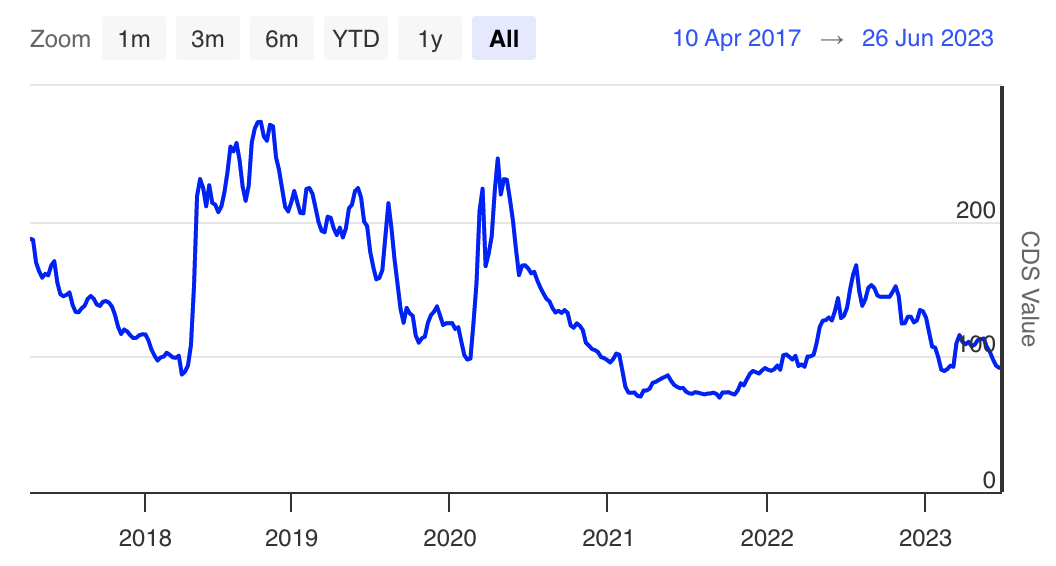
Let's drift away from our economic analysis and into the ETF's portfolio.
According to EWI's fund fact sheet, the ETF has a turnover ratio of 14%, meaning its average portfolio position lasts approximately seven months, give or take. With less than 30 holdings in its portfolio, we think frequent rebalancing is a good way to maintain the fund's investment thesis.
As things stand, the iShares MSCI Italy ETF has a value-centric style, with a bias towards medium market capitalization securities. We believe value stocks could be winners in the coming years due to the "higher for longer" interest rate outlook, which theoretically supports value stocks.
Furthermore, we encourage investors to consider the ETF's risk profile. The ETF's medium-capitalization exposure contributes to a high beta coefficient (1.11), which is compelling to risk-seeking investors but might be discouraging to risk-averse investors.
Yahoo Finance; Morningstar
A glance at EWI's sector exposure shows an intense focus on the financial sector and durable goods, with utilities and industrials close behind. The vehicle's procyclical exposure is conducive to a market characterized by low credit risk and a healthy bond market, which is why we are bullish about the ETF's systemic risk exposure.
EWI Sector Allocation (Seeking Alpha)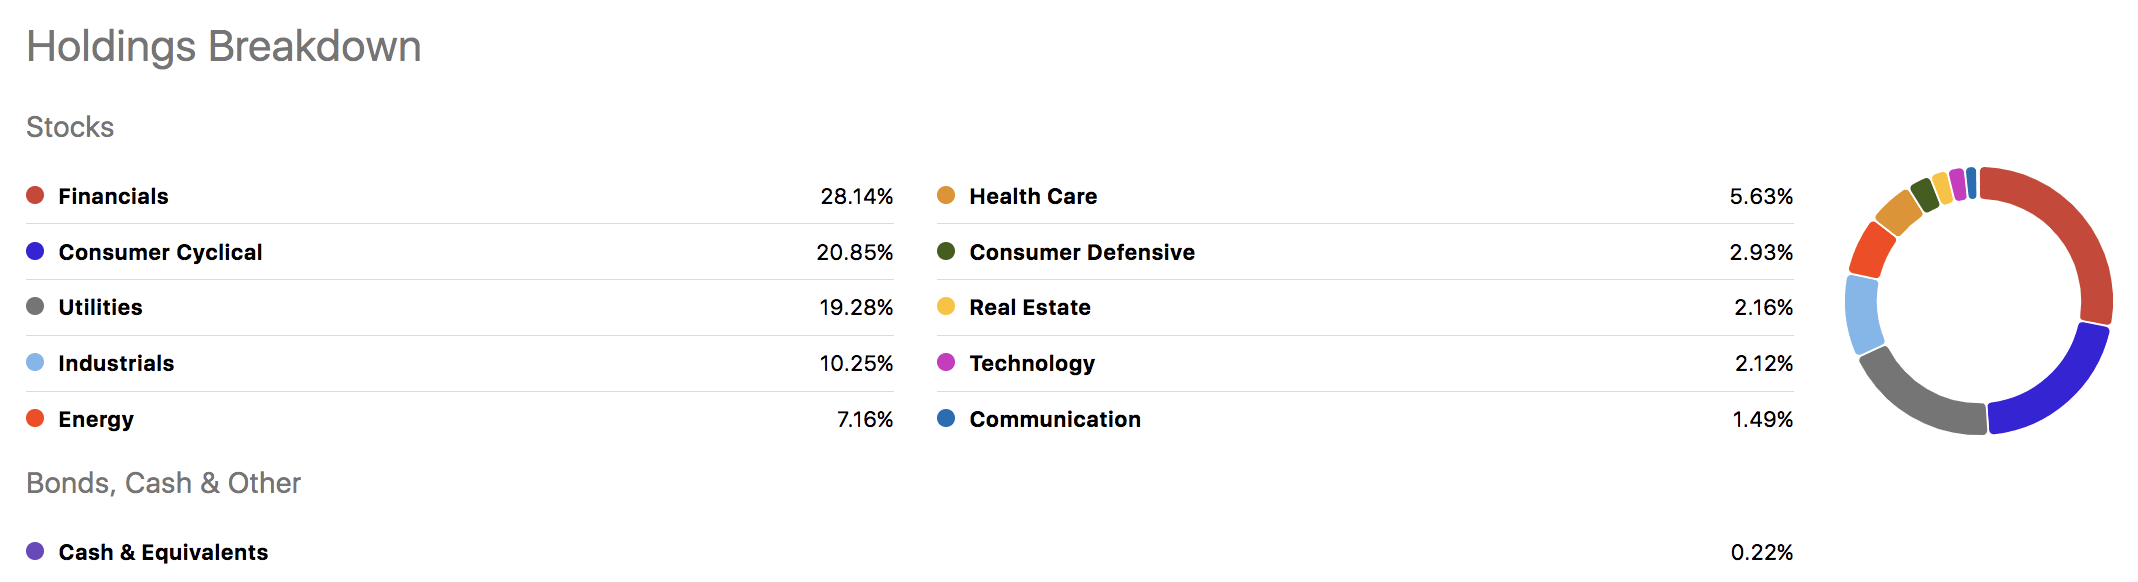
An additional attraction to the iShares MSCI Italy ETF is its valuation metrics. As mentioned before, EWI has a value-centric investment approach, which is reflected by its price-to-earnings and price-to-book multiples.
The ETF's P/B multiple is at a 3.81x discount to the SPDR® S&P 500 ETF Trust (SPY), while its P/E ratio is at a 2.3x discount. Although the Italian and U.S. markets are exposed to different economic environments, a relative comparison holds validity as both the U.S. and Italy are developed markets.
iShares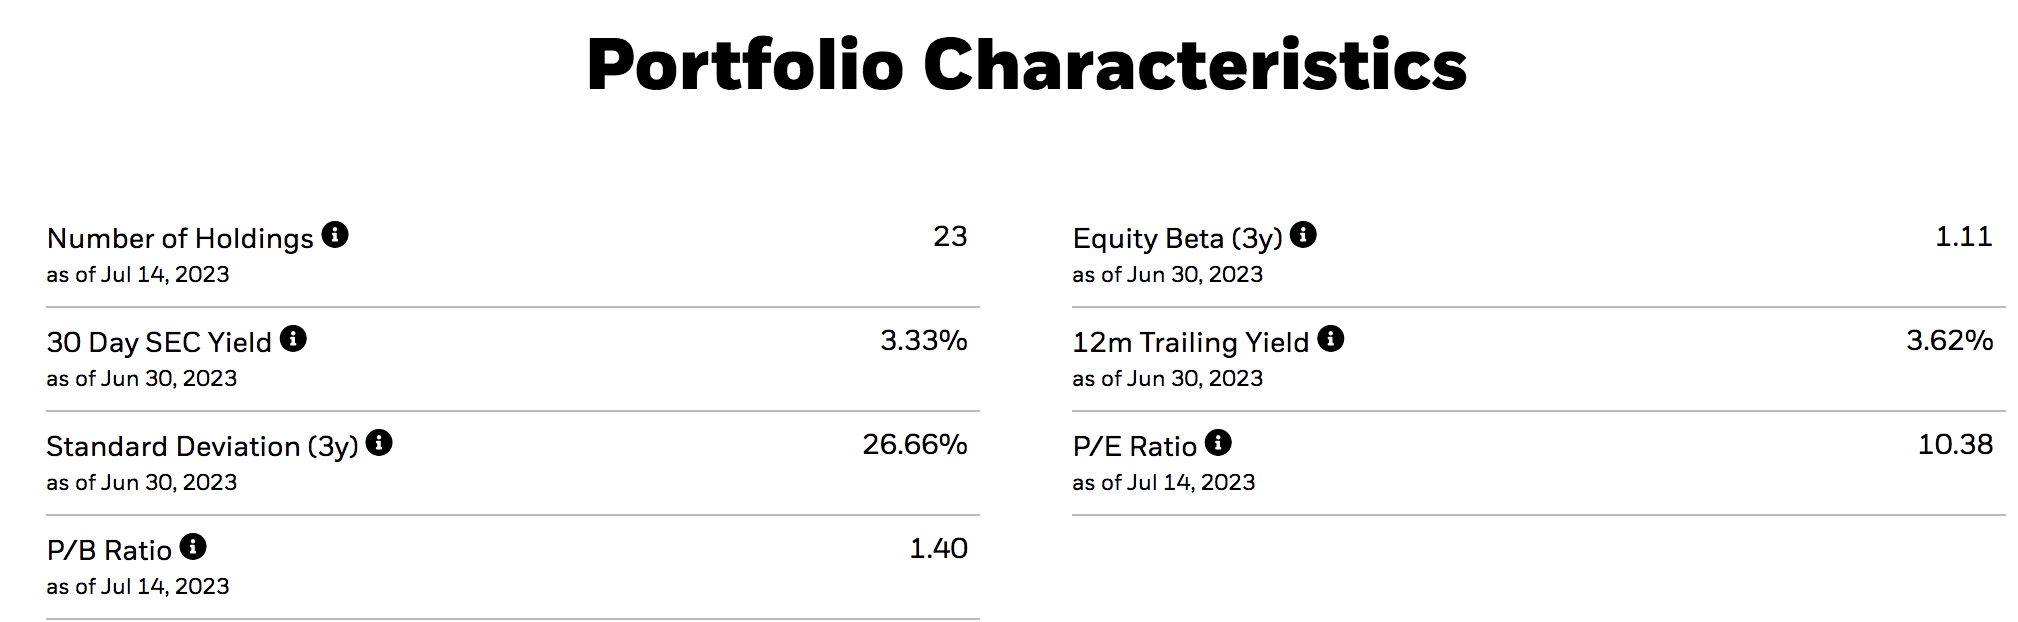
Lastly, the iShares MSCI Italy ETF might be an attractive proposition to income-seeking investors as the ETF's dividend yield of 3.48% is compelling. For comparison, the SPY has a dividend yield of 1.45%, with the worst historical dividend growth rates.
Seeking Alpha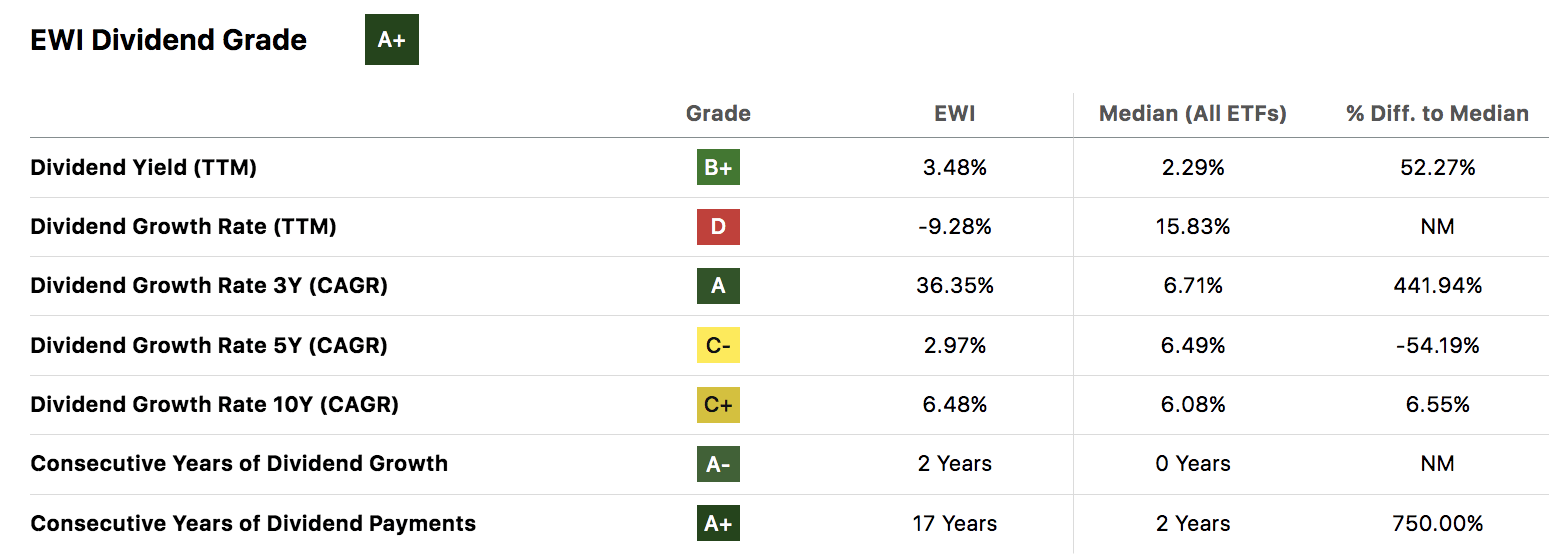
Risk Factors
Most risk factors that we identified pertain to the risk-return attribution and portfolio management of the ETF.
Firstly, EWI possesses a negative information ratio. The information ratio reveals a portfolio manager's skill by measuring a portfolio's excess return (over benchmark) versus its excess risk (over benchmark). As such, the ETF's negative IR indicates underwhelming risk-adjusted returns.
Furthermore, the iShares MSCI Italy ETF's Sharpe Ratio is slightly subdued, especially when compared to the SPY. Thus, suggesting underwhelming volatility-adjusted returns.
ETF Performance Ratios - Click on Image to Enlarge (Portfolio Visualizer)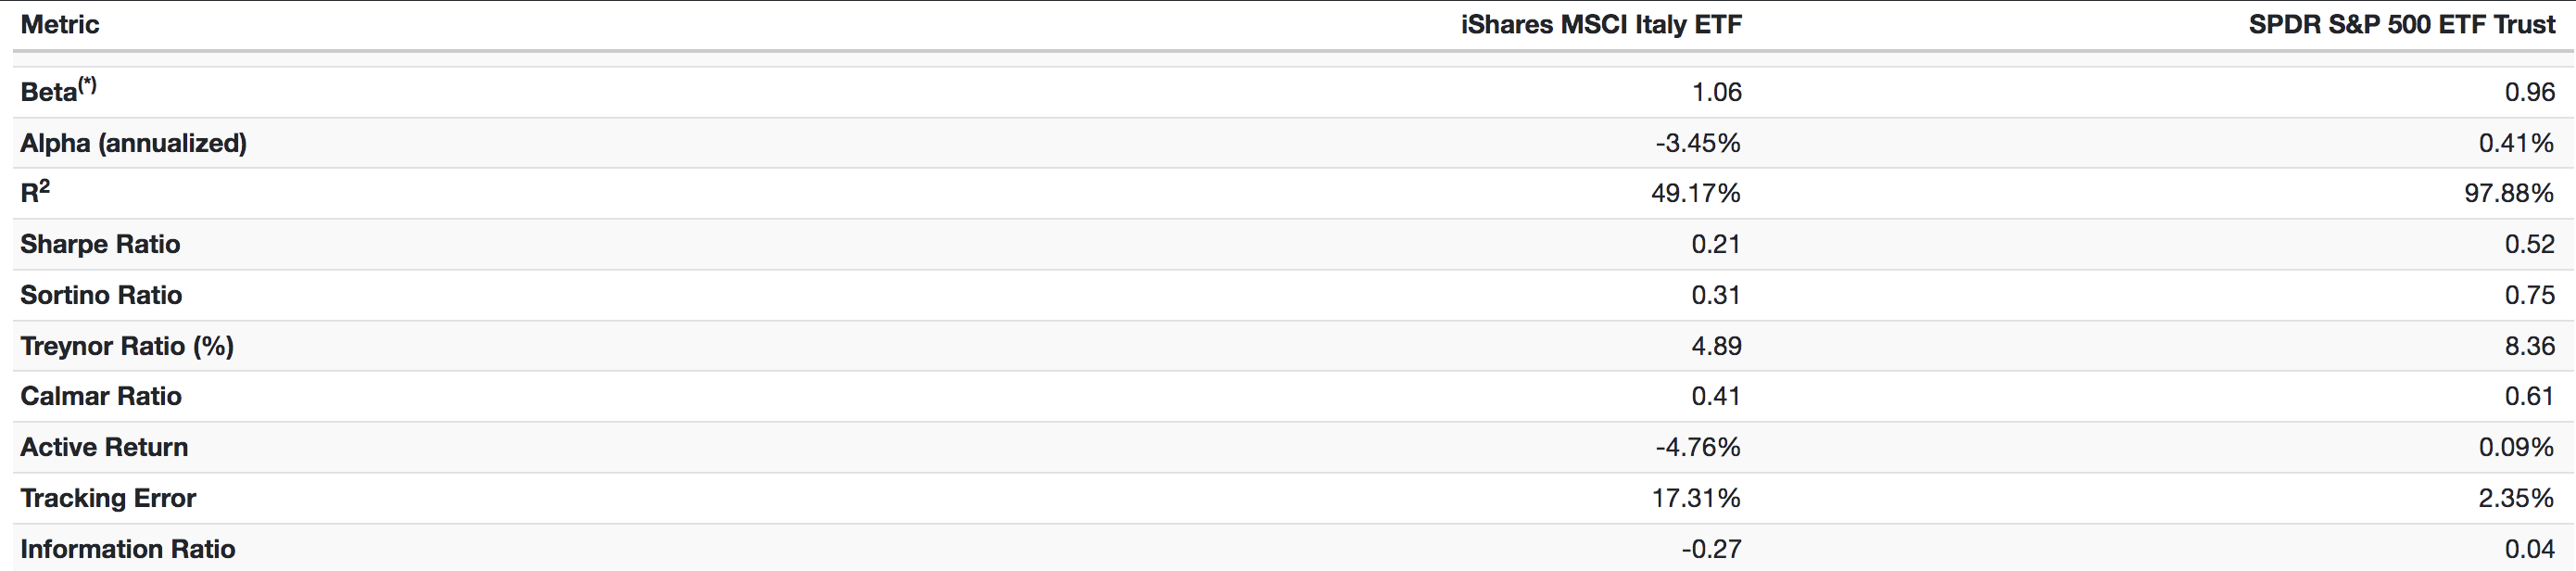
An additional risk factor worth considering is Italy's slowing economic growth. The country's trend growth has slowed considerably in the last decade amid structural struggles among the European Union's main constituents.
Long-term stock returns tend to coalesce with nominal GDP growth, which is worrisome to investors with long-term regional exposure.
Trading Economics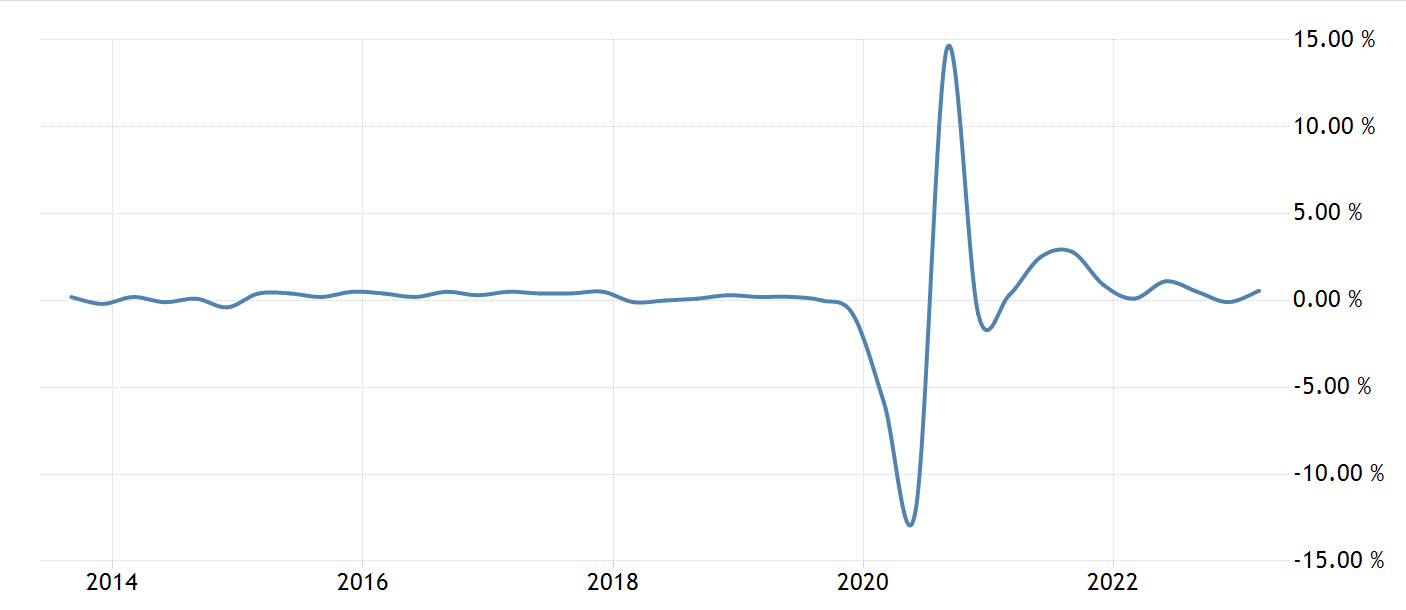
Final Word
Our analysis shows that the iShares MSCI Italy ETF is still in good shape after solid year-on-year returns. Despite possessing both structural and systemic risks, the ETF is exposed to a market driven by favorable risk premiums. Furthermore, the ETF shows signs of value and has a desirable dividend profile.
Looking for structured portfolio ideas? Members of The Factor Investing Hub receive access to advanced asset pricing models. Learn More >>>
This article was written by

Quantitative Fund & Research Firm with a Qualitative Overlay.
Coverage: Global Equities, Fixed Income, ETFs, and REITs.
Methods: Factor Analysis, Fundamental, Valuation, Street Gossip, and Common Sense.
Our work on Seeking Alpha consists of independent research and not financial advice.
Analyst’s Disclosure: I/we have no stock, option or similar derivative position in any of the companies mentioned, and no plans to initiate any such positions within the next 72 hours. I wrote this article myself, and it expresses my own opinions. I am not receiving compensation for it (other than from Seeking Alpha). I have no business relationship with any company whose stock is mentioned in this article.
Seeking Alpha's Disclosure: Past performance is no guarantee of future results. No recommendation or advice is being given as to whether any investment is suitable for a particular investor. Any views or opinions expressed above may not reflect those of Seeking Alpha as a whole. Seeking Alpha is not a licensed securities dealer, broker or US investment adviser or investment bank. Our analysts are third party authors that include both professional investors and individual investors who may not be licensed or certified by any institute or regulatory body.