Pioneer Natural Resources: Exxon Mobil Potential Merger Is Not Materializing

Summary
- Pioneer Natural Resources Company came out with adjusted quarterly earnings of $5.21 per share in Q1 2023, beating analysts' expectations, compared to earnings of $7.74 a year ago.
- Production was a record of 680.440k Boep/d in 1Q23.
- I recommend buying Pioneer Natural Resources stock between $204.9 and $201, with possible lower support at $197.5.
- Looking for a helping hand in the market? Members of The Gold And Oil Corner get exclusive ideas and guidance to navigate any climate. Learn More »
Sean Hannon
Introduction
Pioneer Natural Resources Company (NYSE:PXD) is one of the largest independent E&P companies in the United States.
The company produces exclusively in the Permian Basin and owns extensive acreage. The company said it holds a deep inventory of high-quality locations in the Midland Basin, tier 1 & 2.
PXD Assets Presentation (PXD Presentation)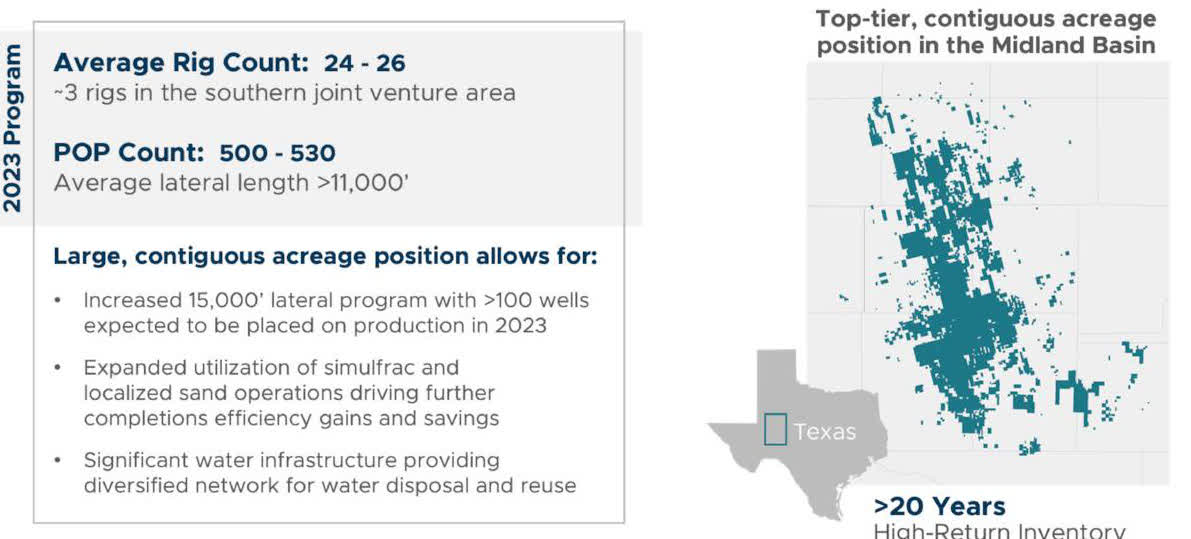
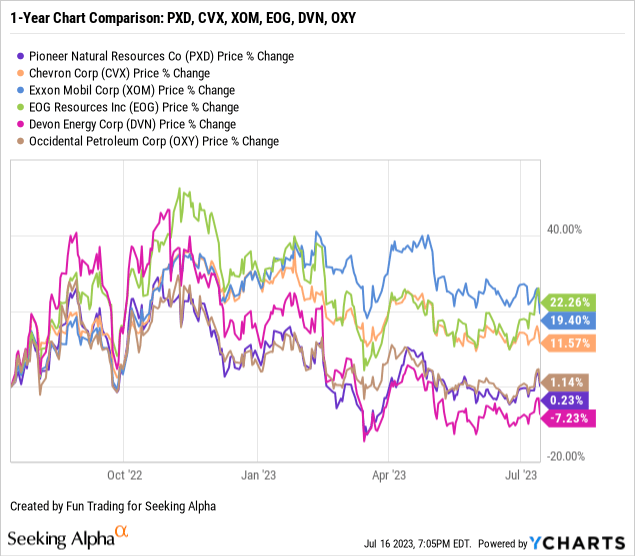
This solid oil company has been added to my domestic E&P in the past three quarters, which includes EOG Resources (EOG), Occidental Petroleum (OXY), Devon Energy (DVN), and two US supermajors, Chevron Corp (CVX) and Exxon Mobil (XOM).
On April 26, 2023, Pioneer Natural Resources reported its 1Q23 results.
Note: I have followed PXD quarterly since 2022. This new article is a quarterly update of my article published on April 10, 2023.
1 - Investment Thesis
Pioneer Natural Resources came out with adjusted quarterly earnings of $5.21 per share in 1Q23, beating analysts' expectations, compared to earnings of $7.74 a year ago.
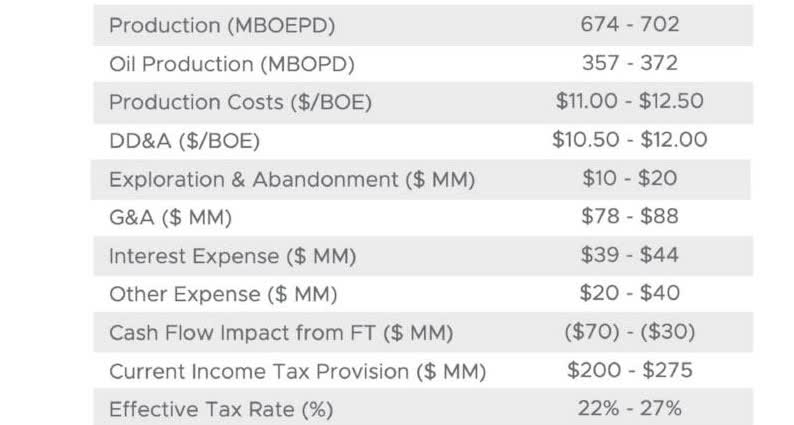
The company estimates production for 2023 between 670K Boep/d and 700K Boep/d and an estimated $4+ billion in free cash flow.
PXD 2023 Outlook (PXD Presentation) PXD 2Q23 Guidance (PXD Presentation)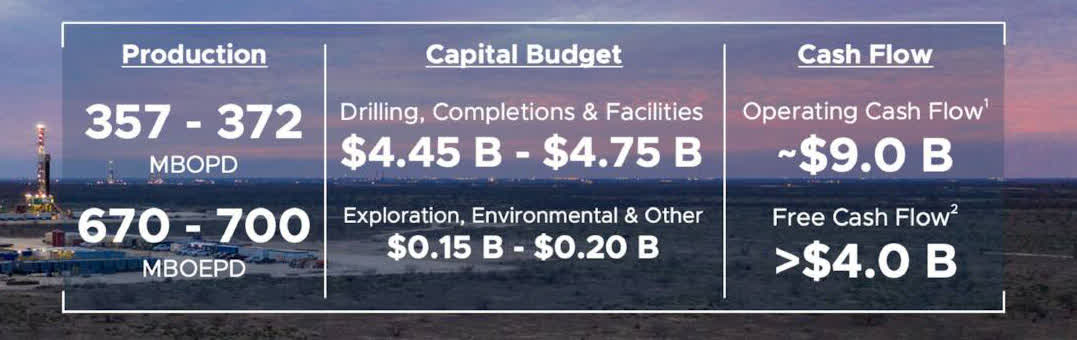
However, oil prices have been highly volatile recently and retraced significantly due to continued weakness in China's economy.
Slower than expected Q2 GDP growth in China, the world's second-largest economy, has stirred uncertainty in global markets, impacting US equity futures, European stocks, and commodities, and leading to a rise in bond yields.
Furthermore, the risk of recession due to the FED's action may not help oil prices for long as demand may tumble in H2 2023. The natural gas price has dropped significantly in the past few months, representing about 30% of the total PXD output.
Thus, I expect weak Second quarter 2023 results (expected post-market August 2) despite a solid production expected, and I warn investors about a possible stock slide again, assuming no unexpected positive news.
Natural gas prices are down 62% on a one-year basis, while oil prices are down 20%. See the chart below:
PXD 1-Year Chart Brent and NG (Fun Trading StockCharts)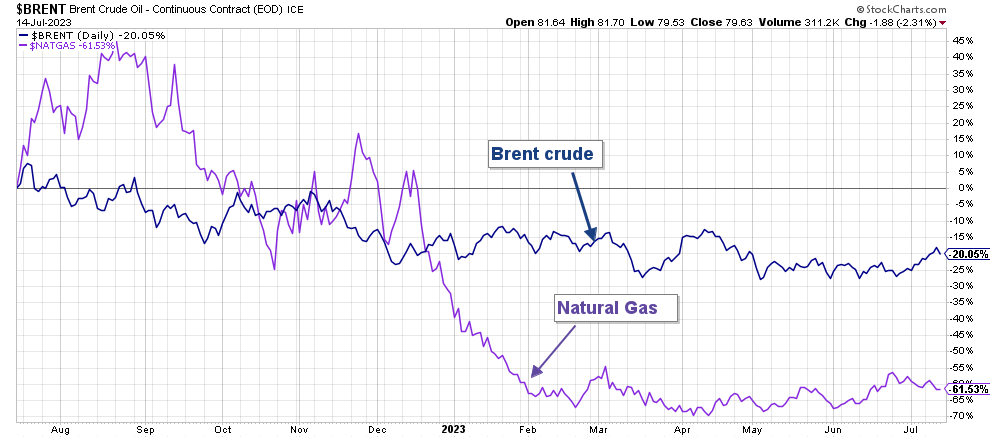
Also, the rumor about a merger between XOM and PXD is not materializing soon after XOM indicated it was acquiring Denburry Resources (DEN) on July 13, 2023, for $4.9 billion.
The acquisition is an all-stock transaction valued at $4.9 billion, or $89.45 per share based on ExxonMobil’s closing price on July 12, 2023. Under the terms of the agreement, Denbury shareholders will receive 0.84 shares of ExxonMobil for each Denbury share.
Therefore, I have mixed feelings about the future strength of PXD.
Thus, using any upticks to take short-term profit LIFO is crucial as I have advocated for many years in my marketplace, "the Gold and oil corner."
2 - Stock Performance And Commentary
PXD is flat on a one-year basis. However, PXD rewards shareholders with a very high dividend policy.
Pioneer Resources - Financial Table 1Q23 - The Raw Numbers
| Pioneer Natural Resources | 1Q22 | 2Q22 | 3Q22 | 4Q22 | 1Q23 |
| Revenues in $ Million | 6,147 | 7,005 | 6,057 | 5,174 | 4,597 |
| Total Revenues + other in $ Million | 6,172 | 6,920 | 6,093 | 5,108 | 4,541 |
| Net Income in $ Million | 2,009 | 2,371 | 1,984 | 1,481 | 1,222 |
| EBITDA $ Million | 3,212 | 3,681 | 3,164 | 2,562 | 2,286 |
| EPS diluted in $/share | 7.85 | 9.30 | 7.93 | 5.98 | 5.00 |
| Operating cash flow in $ Million | 2,584 | 3,221 | 2,945 | 2,598 | 2,314 |
| CapEx in $ Million | 917 | 917 | 972 | 1,114 | 1,180 |
| Free Cash Flow in $ Million | 1,667 | 2,304 | 1,973 | 1,484 | 1,134 |
| Cash and cash equivalent $ Million | 3,256 | 3,252 | 1,822 | 1,204 | 1,311 |
| Total Debt in $ Million | 5,690 | 5,693 | 5,214 | 4,904 | 5,908 |
| Dividend per share in $ | 3.78 | 7.38 | 8.57 | 5.58 | 3.34 |
| Shares outstanding (diluted) in Millions | 256 | 254 | 250 | 249 | 244 |
| Oil Production | 1Q22 | 2Q22 | 3Q22 | 4Q22 | 1Q23 |
| Oil Equivalent Production in K Boep/d continuing operations) | 637.756 | 642.844 | 656.582 | 661.573 | 680.440 |
| Global Natural gas price ($/MMBtu) | 4.81 | 6.72 | 7.58 | 4.98 | 3.79 |
| Price per $/Boe | 68.48 | 79.31 | 69.93 | 57.76 | 51.69 |
Source: PXD press release.
Analysis: Revenues, Earnings Details, Free Cash Flow, Debt, An Oil & Gas Production
1 - Total Revenue and Others was $4,597 million in 1Q23
PXD Quarterly Revenue History (Fun Trading)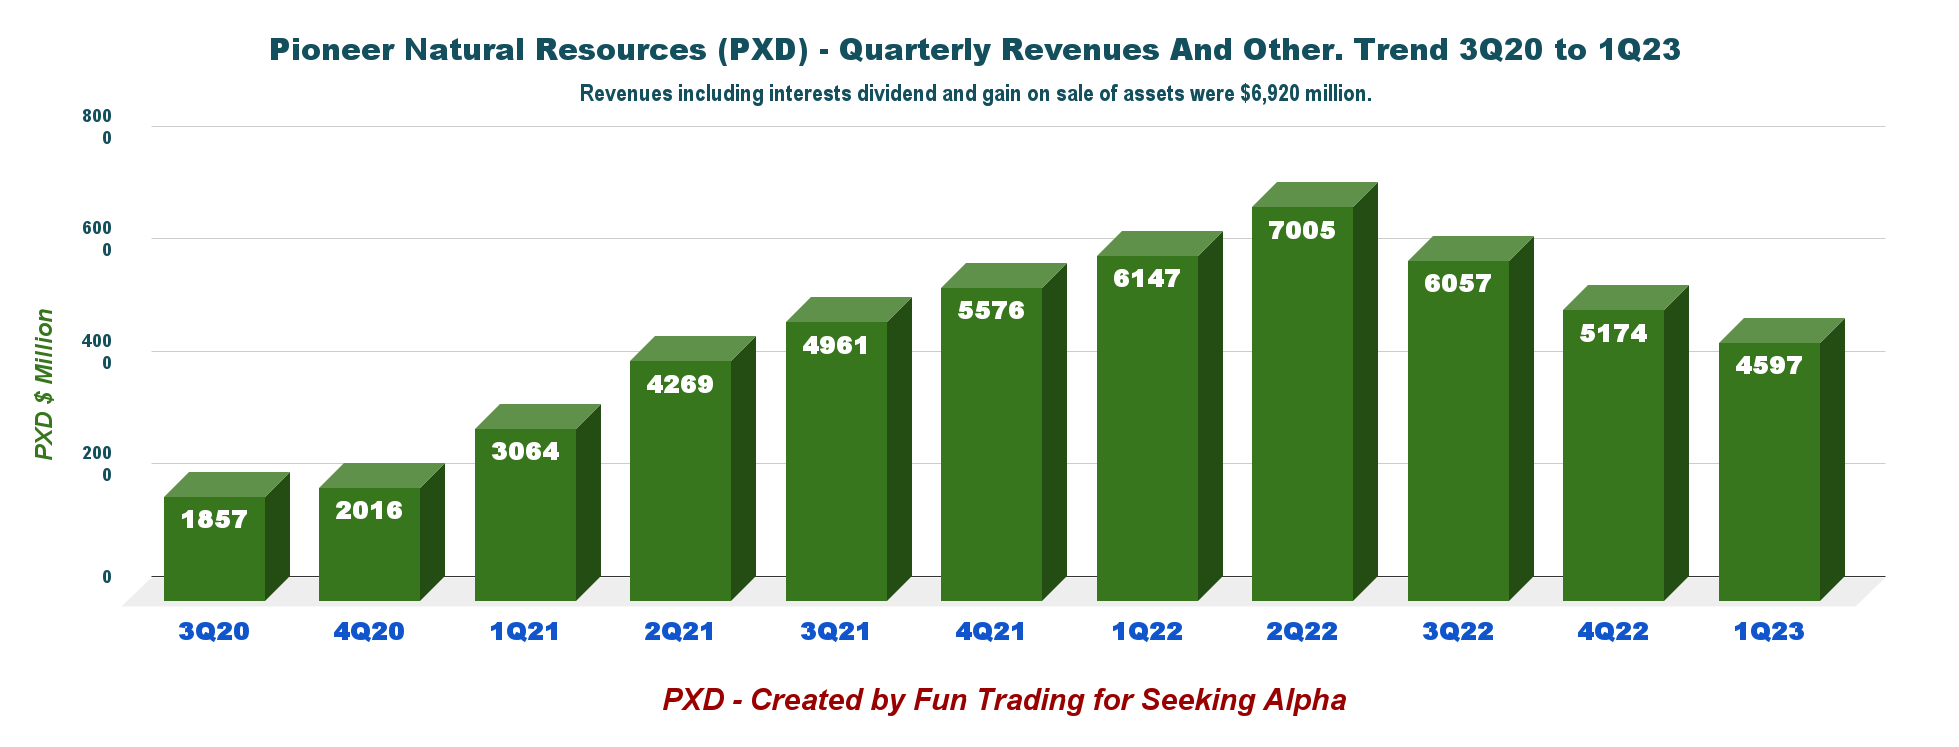
Note: Revenues from oil and gas and others were $4,541 million in 1Q23.
Total Revenues were $4,597 million in 1Q23. Pioneer Natural Resources reported a net income of $1,222 million, or $5.00 per diluted share, for the first quarter of 2023, compared to $2,009 million or $7.85 in 1Q22.
The net cash provided by continuing operations activities in 1Q23 was $2,314 million, compared with $2,581 million in 1Q22.
Below are the 1Q23 highlights from the Presentation:
PXD 1Q23 Highlights (PXD Presentation)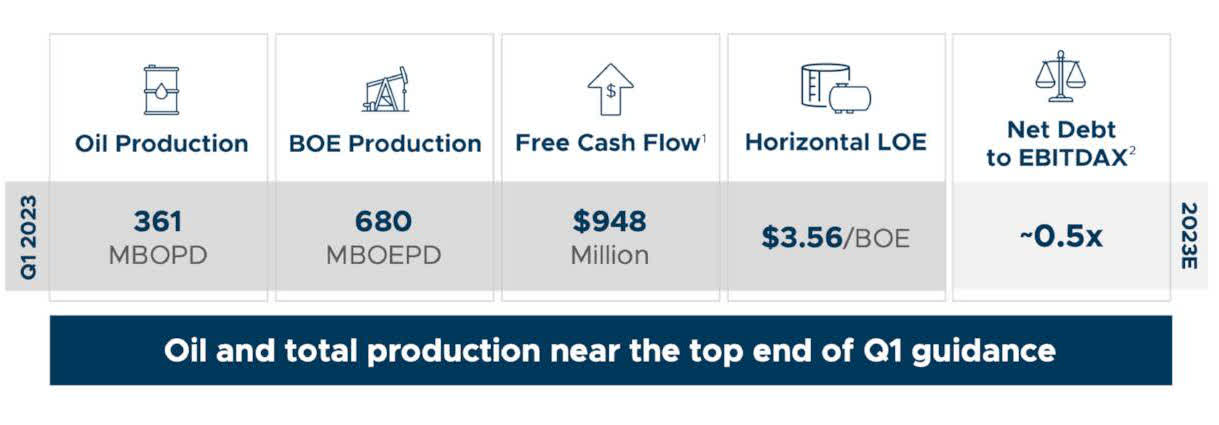
2 - Free Cash Flow was $1,134 million in 1Q23
PXD Quarterly Free Cash Flow History (Fun Trading) The generic free cash flow was $1,134 million in 1Q23. The trailing 12-month free cash flow is $6,895 million.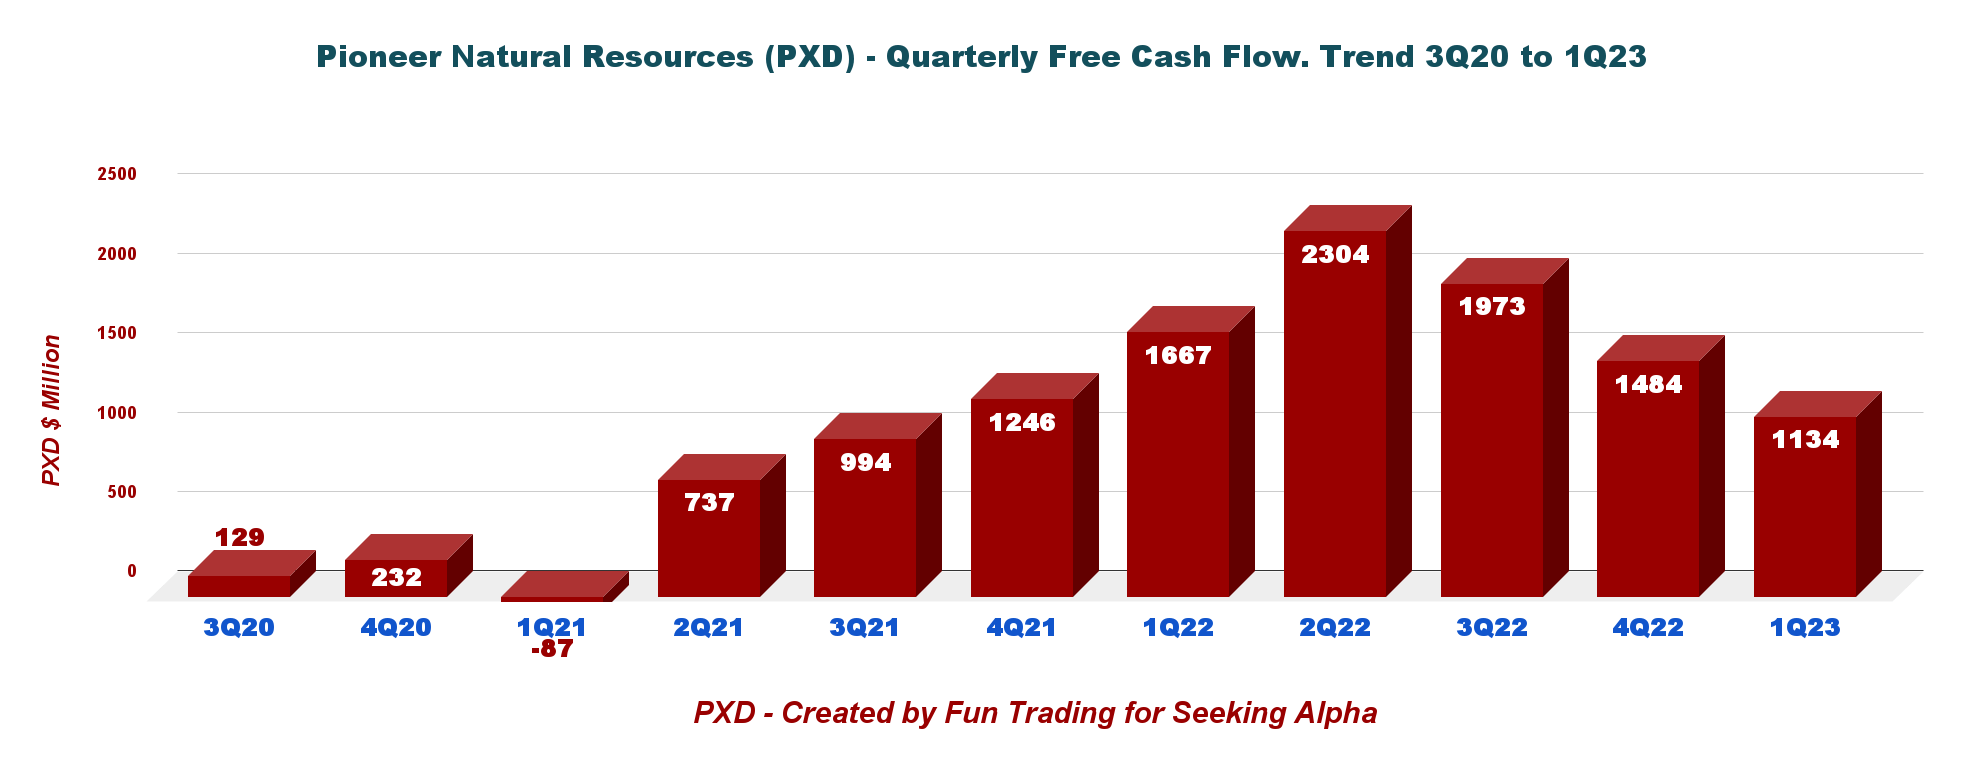
For the first quarter of 2023, the Company's Board of Directors (Board) has declared a quarterly base-plus-variable dividend of $3.34 per share, comprised of a $1.25 base dividend and a $2.09 variable dividend. The first quarter dividend represents a forward dividend yield of 6.45%.
Also, Pioneer Resources has an ongoing $4 billion share buyback program and has bought $2.1 billion worth of shares since January 1, 2023, or $500 million executed in 1Q23.
PXD Shares buyback program 1Q23 (PXD Presentation)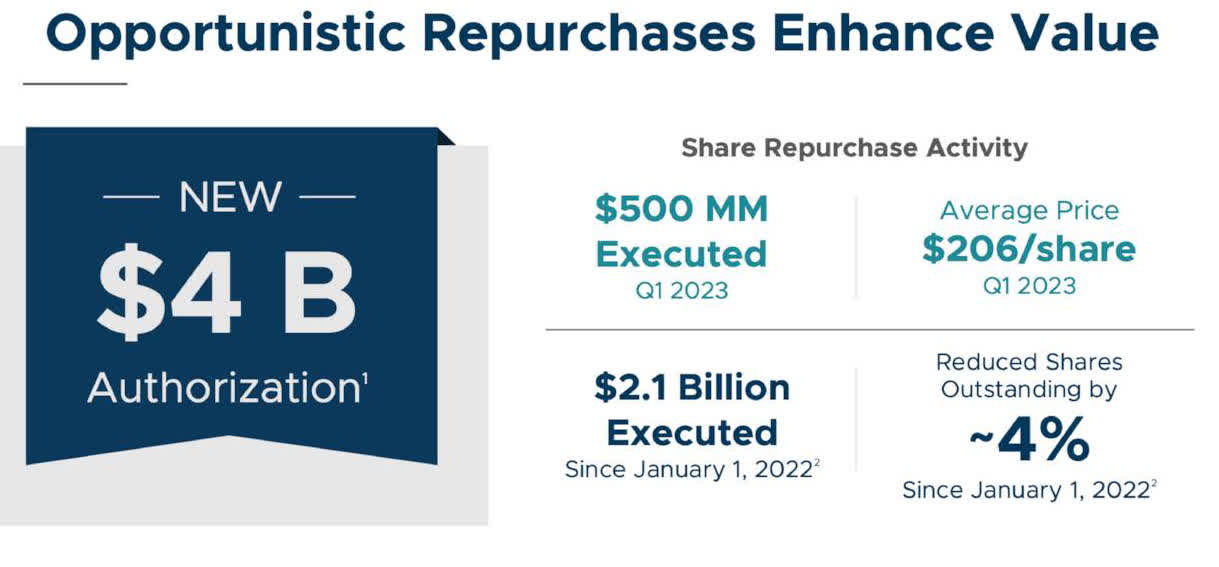
3 - Production was a record of 680.440k Boep/d in 1Q23
3.1 - Quarterly Oil Equivalent Production
PXD Quarterly Oil Equivalent Production History (Fun Trading)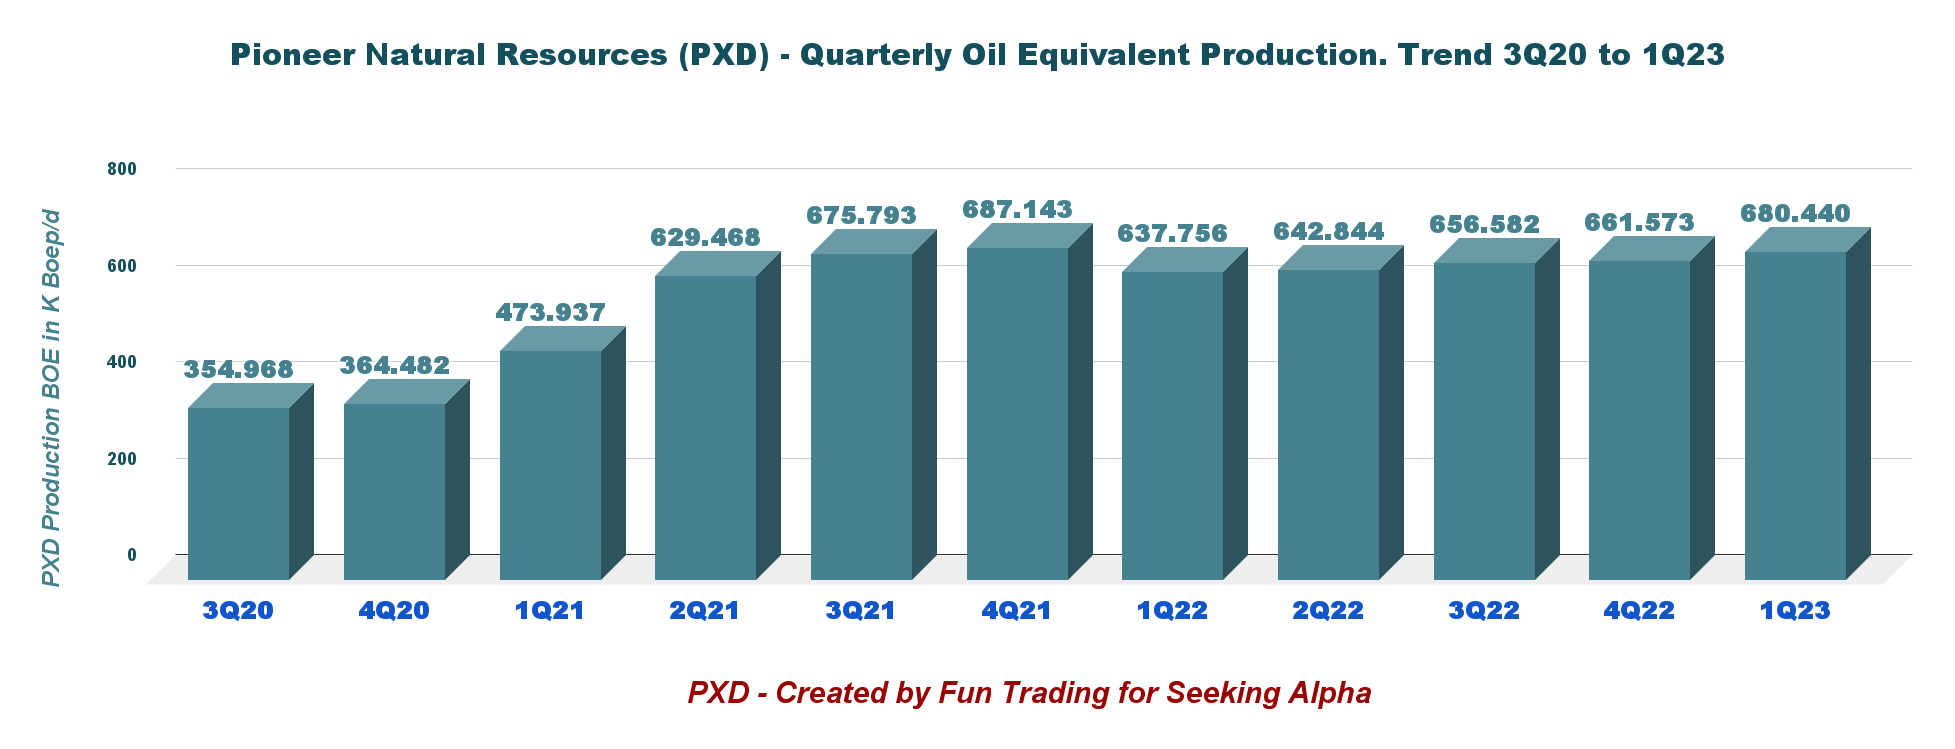
The company produced a record 680.44K Boep/d in the first quarter, comprising 77.7% of liquids (Oil+NGL). Production comes from the Permian Basin.
Production costs, including taxes, averaged $10.82 per barrel of oil equivalent, progressing from $11.08 per BOE in the preceding quarter.
PXD Production Costs per BOE (PXD Presentation)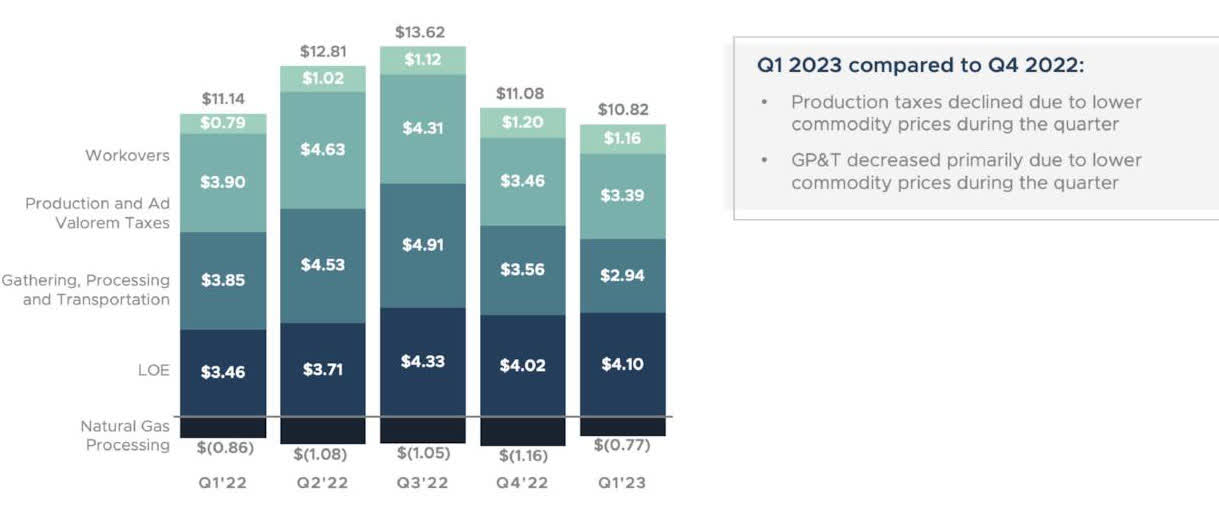
3.2 - Equivalent production is spread between oil, NGL, and natural gas.
Liquids represented 77.7% of the total input.
PXD Quarterly Production per Oil, NGL, NG (Fun Trading)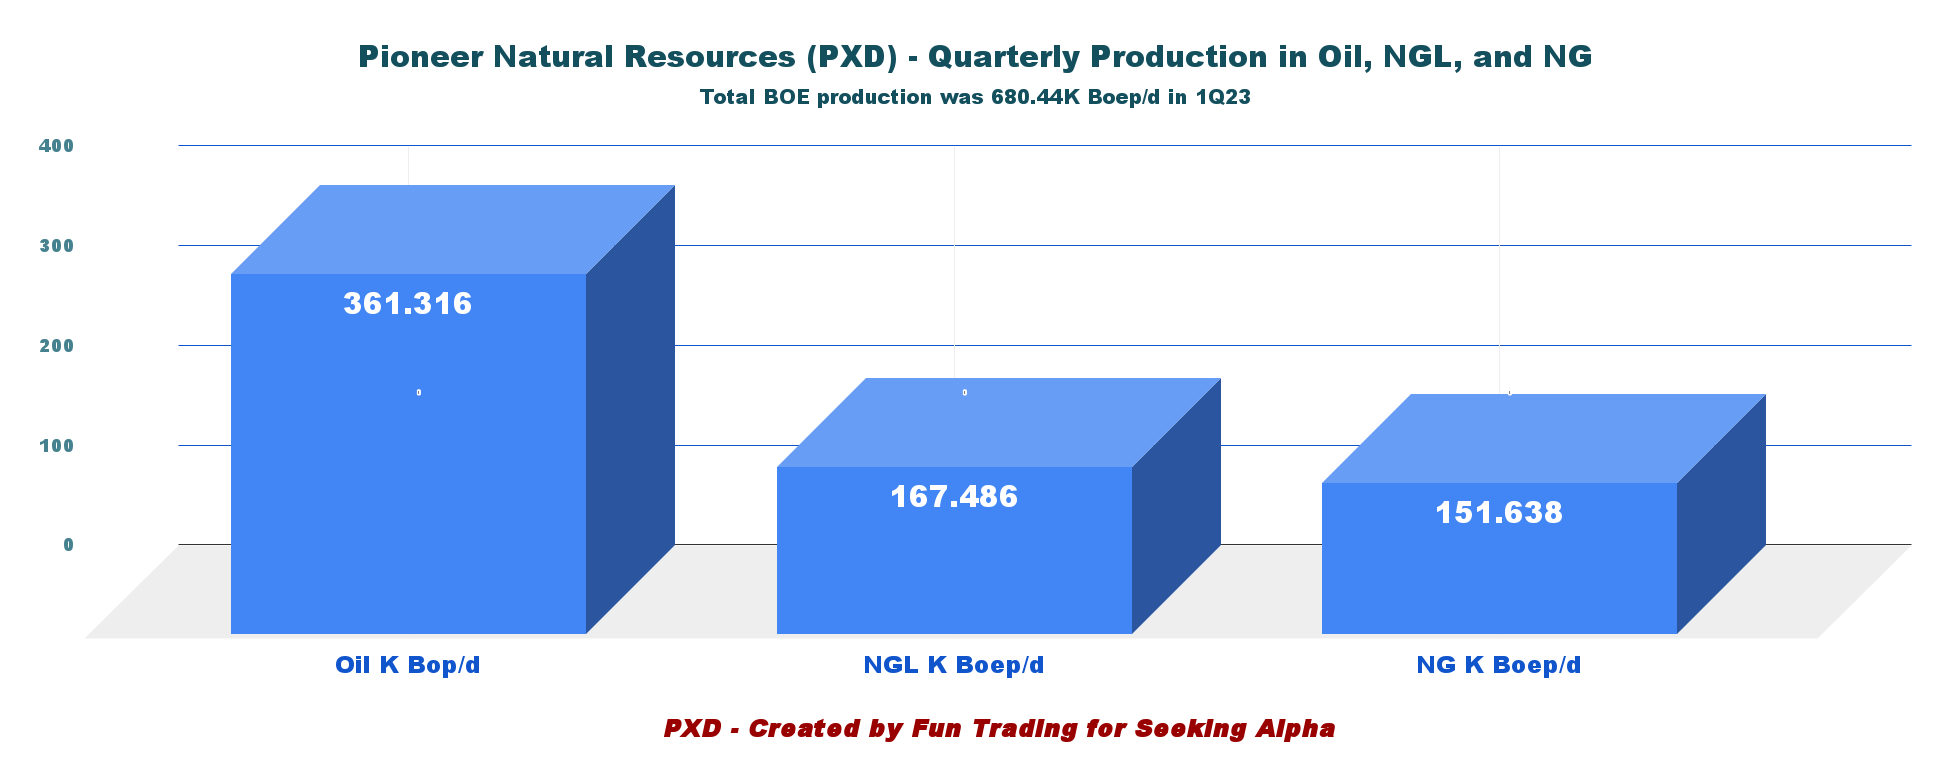
3.3 - Realized prices per Boe
- The oil price is $75.15 per barrel.
- The NGL price is $27.30 per barrel
- The NG price is $3.79 per barrel
- The price per BOE was $51.69 in 1Q23.
PXD Quarterly Oil and Gas Prices History (Fun Trading)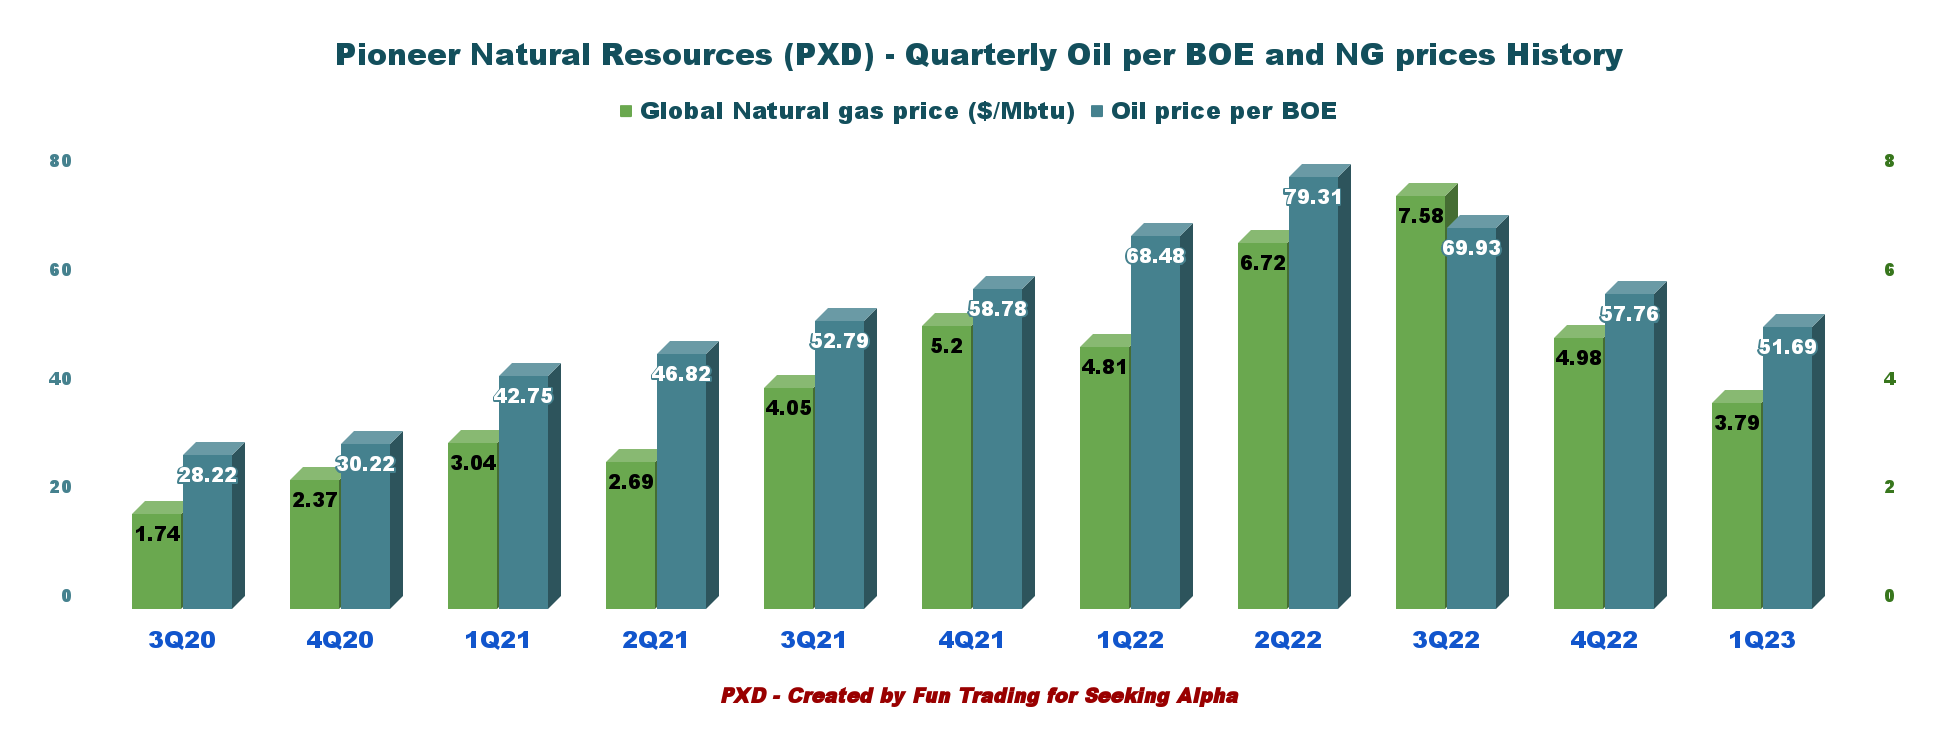
Prices of oil and NG have been strong the past few quarters and have nearly doubled on a year-over-year basis.
However, oil prices have dropped significantly since Q2 2022 and will potentially be even lower in Q2 2023, hurting Free Cash Flow and dividends.
I have estimated $49.25 per Boe in 2Q23.
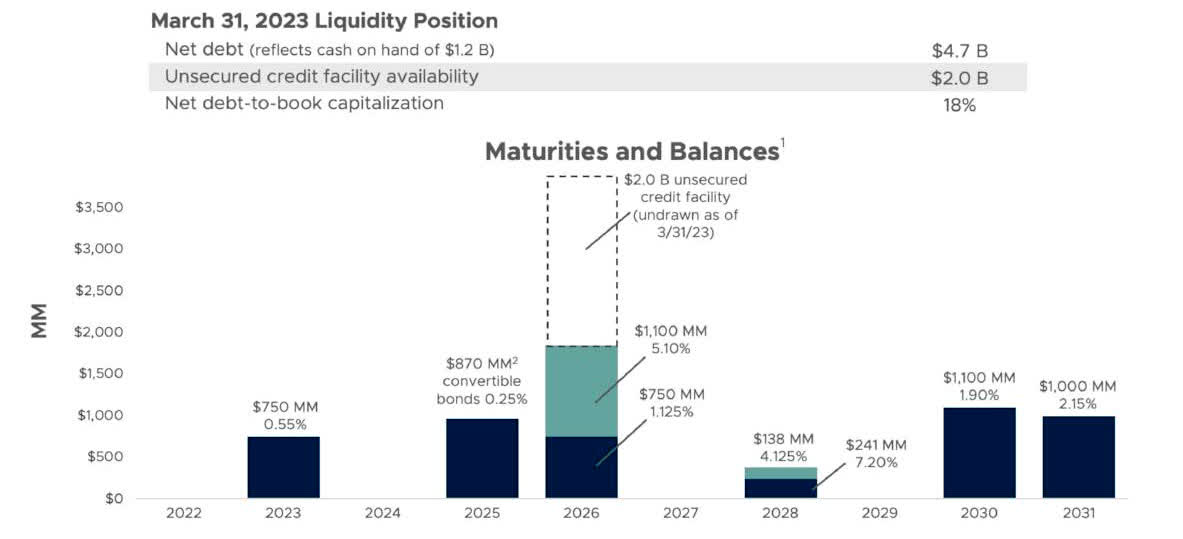
4 - Net Debt was $4.6 billion in 1Q23
Pioneer Natural Resources had cash and cash equivalents of $1,311 million as of March 31, 2023, compared with $3,256 million as of March 31, 2022.
PXD Quarterly Cash versus Debt History (Fun Trading) The total Debt was $5,908 million at the end of March 2023, including current. Net Debt to book capitalization was 18% in 1Q23, which is excellent. Total liquidity is $3.3 billion. Below are shown debt maturities and balances. The difference in Net Debt comes from the cash on hand used by the company, which is only a part of the total cash. PXD Liquidity Position (PXD Presentation)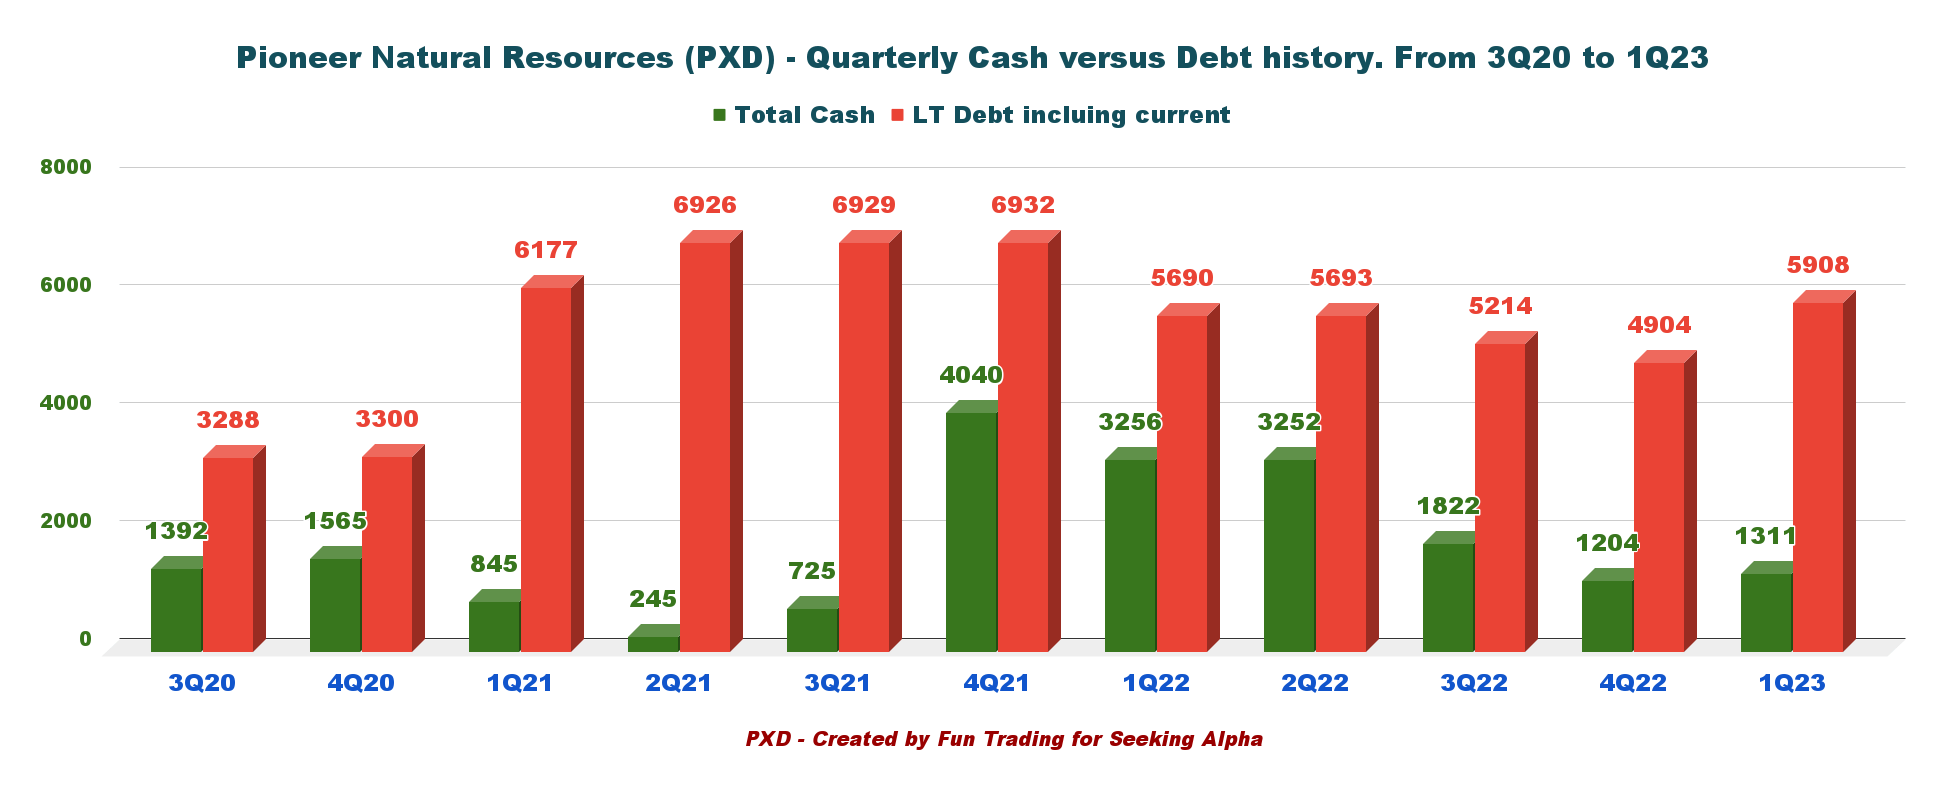
Technical Analysis (Short Term) And Commentary
PXD TA Chart Short-Term (Fun Trading StockCharts)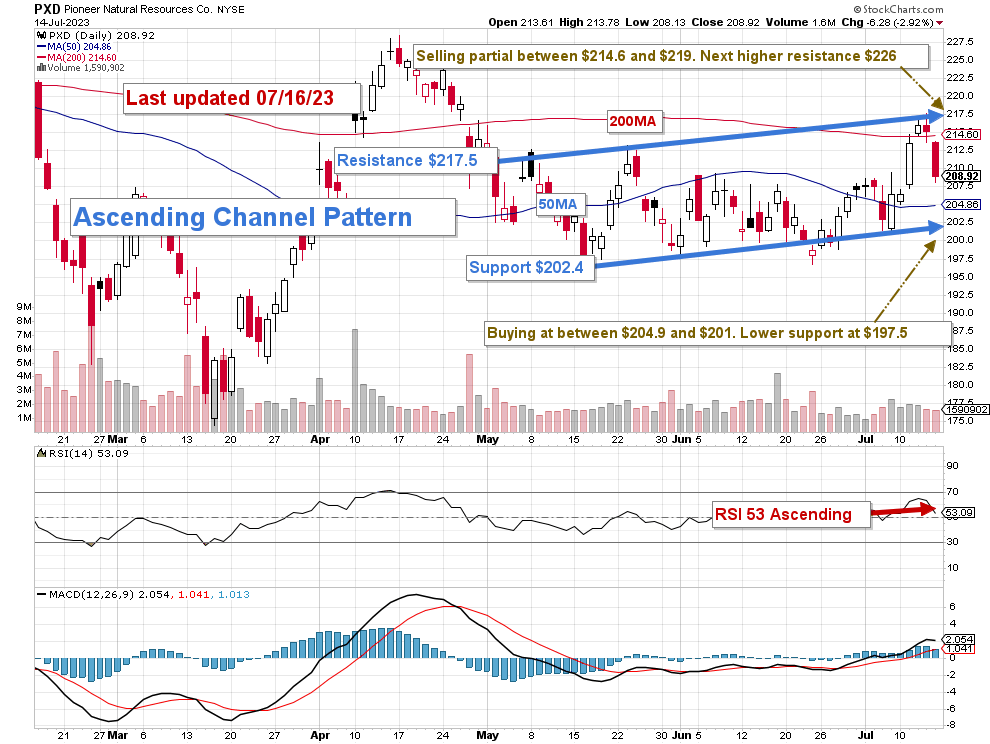
Note: The chart is adjusted for the dividend.
PXD forms an ascending channel pattern with resistance at $217.5 and support at $202.4.
Ascending channel patterns or rising channels are short-term bullish in that a stock moves higher within an ascending channel, but these patterns often form within longer-term downtrends as continuation patterns. The ascending channel pattern is often followed by lower prices.
Thus, I recommend selling PXD between $214.6 and $219 with possible higher resistance at $226. Conversely, as indicated in the chart above, I think it is safe to accumulate PXD between $204.9 and $201, with possible lower support at $197.5.
However, you must base your expectation on oil and gas prices and adjust depending on the daily forecast. The oil market is very volatile and could change direction without any warning.
Trading LIFO is the most suitable solution, in my opinion. It lets you keep a long-term position delivering a sizeable dividend and allowing you to trade short-term fluctuations and accumulate short-term gain.
Warning: The TA chart must be updated frequently to be relevant. It is what I am doing in my stock tracker. The chart above has a possible validity of about a week. Remember, the TA chart is a tool only to help you adopt the right strategy. It is not a way to foresee the future. No one and nothing can.

Join my "Gold and Oil Corner" today, and discuss ideas and strategies freely in my private chat room. Click here to subscribe now.
You will have access to 57+ stocks at your fingertips with my exclusive Fun Trading's stock tracker. Do not be alone and enjoy an honest exchange with a veteran trader with more than thirty years of experience.
"It's not only moving that creates new starting points. Sometimes all it takes is a subtle shift in perspective," Kristin Armstrong.
Fun Trading has been writing since 2014, and you will have total access to his 1,988 articles and counting.
This article was written by

I am a former test & measurement doctor engineer (geodetic metrology). I was interested in quantum metrology for a while.
I live mostly in Sweden with my loving wife.
I have also managed an old and broad private family Portfolio successfully -- now officially retired but still active -- and trade personally a medium-size portfolio for over 40 years.
“Logic will get you from A to B. Imagination will take you everywhere.” Einstein.
Note: I am not a financial advisor. All articles are my honest opinion. It is your responsibility to conduct your own due diligence before investing or trading.
Analyst’s Disclosure: I/we have no stock, option or similar derivative position in any of the companies mentioned, and no plans to initiate any such positions within the next 72 hours. I wrote this article myself, and it expresses my own opinions. I am not receiving compensation for it (other than from Seeking Alpha). I have no business relationship with any company whose stock is mentioned in this article.
I trade short-term PXD but do not own a long-term position at the moment.
Seeking Alpha's Disclosure: Past performance is no guarantee of future results. No recommendation or advice is being given as to whether any investment is suitable for a particular investor. Any views or opinions expressed above may not reflect those of Seeking Alpha as a whole. Seeking Alpha is not a licensed securities dealer, broker or US investment adviser or investment bank. Our analysts are third party authors that include both professional investors and individual investors who may not be licensed or certified by any institute or regulatory body.
Recommended For You
Comments (2)
