SPLV Vs. LGLV: Another Little Known ETF Bettering Big Brother

Summary
- The article compares two low-volatility equity ETFs: Invesco S&P 500 Low Volatility ETF and SPDR SSGA US Large Cap Low Volatility Index ETF.
- The Invesco ETF invests at least 90% of its total assets in the S&P 500 Low Volatility Index, measuring the performance of the 100 least volatile constituents of the S&P 500 Index.
- The SPDR SSGA ETF aims to provide investment results that correspond to the total return performance of the SSGA US Large Cap Low Volatility Index.
- The LGLV ETF gets a Buy rating for those willing to trade some return for less risk.
- Looking for more investing ideas like this one? Get them exclusively at Hoya Capital Income Builder. Learn More »
(This article was co-produced with Hoya Capital Real Estate)
anton5146
Introduction
Roller coasters were made to give riders an exciting ride with their steep climbs and then rapid drops, only to be whipped around sharp bends before arriving at the final destination. Investors can experience the same "thrill" by using 2X/3X ETFs that take the kiddie ride into that screaming adventure. I consider myself too old for that and use some funds designed to smooth the investment ride. Even in my option trading, I use some of the most conservative strategies, Cash-Secure-Puts and Covered-Calls. There are several sets of equity ETFs for investors forgoing the coaster for the merry-go-round, one of which is Low-Volatility funds. Here I compare the very popular Invesco S&P 500 Low Volatility ETF (NYSEARCA:SPLV) with is 11k followers against the SPDR SSGA US Large Cap Low Volatility Index ETF (NYSEARCA:LGLV), which has a lot less followers and AUM. Over its decade of existence, LGLV has had a higher return and better risk ratios despite a higher Beta. The LGLV ETF gets a Buy rating for those willing to trade some return for less risk.
Invesco S&P 500 Low Volatility ETF review
Seeking Alpha describes this ETF as:
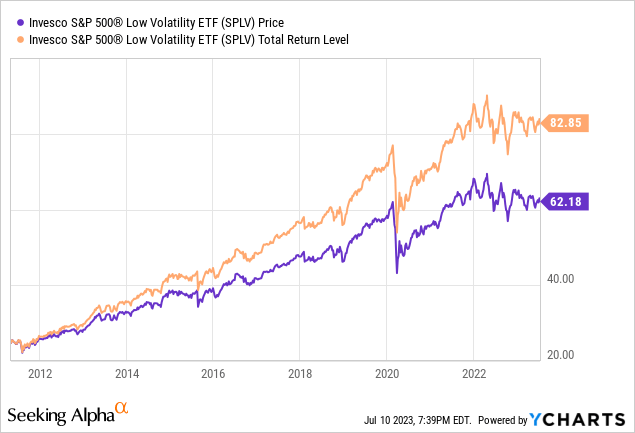
The fund generally will invest at least 90% of its total assets in the securities that comprise the S&P 500 Low Volatility Index. The underlying index is designed to measure the performance of the 100 least volatile constituents of the S&P 500 Index over the past 12 months as determined by the index Provider. SPLV started in 2011.
Source: seekingalpha.com SPLV
SPLV has $9.15b in AUM, with 25bps in fees. The TTM Yield is 2.26%.
Index review
The index managers describe their index as:
The S&P 500® Low Volatility Index measures performance of the 100 least volatile stocks in the S&P 500. The index benchmarks low volatility or low variance strategies for the U.S. stock market. Constituents are weighted relative to the inverse of their corresponding volatility, with the least volatile stocks receiving the highest weights.
Source: spglobal.com Index
The Methodology PDF states that at each rebalancing, the weight for each index constituent is set inversely proportional to its volatility, which is defined as the standard deviation of the security’s daily price returns, in local currency, over 252 trading days.
SPLV holdings review
seekingalpha.com SPLV sectors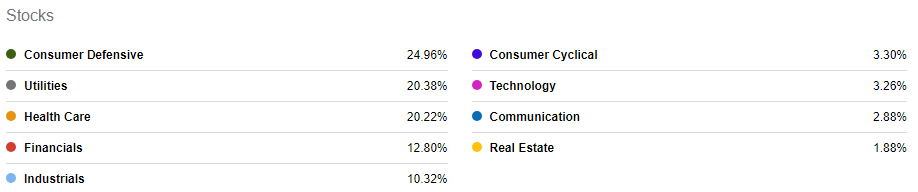
The low volatility filter definitely changes the sector allocations from a standard ETF based on the S&P 500 index; more on this later.
The Top 20 stocks comprise 23% of the portfolio, out of the 100 SPLV would be expected to hold. The smallest weight is .85% so all stocks have an effect on the ETF's performance almost equally.
invesco.com; compiled by Author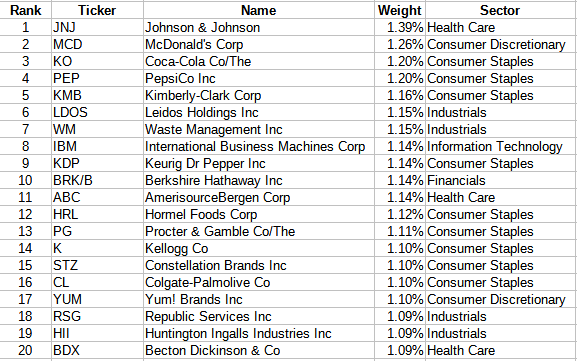
SPLV distribution review
seekingalpha.com SPLV DVDs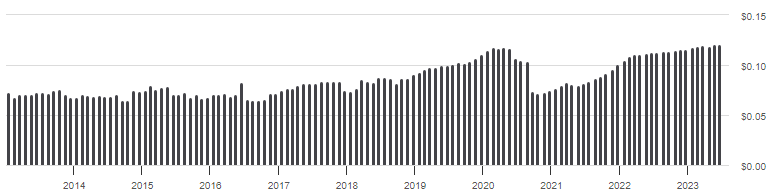
The recent monthly dividends near $.12 top those reached just prior to COVID. SPLV has garnered a "B-" grade for this factor.
seekingalpha.com DPLV scorecard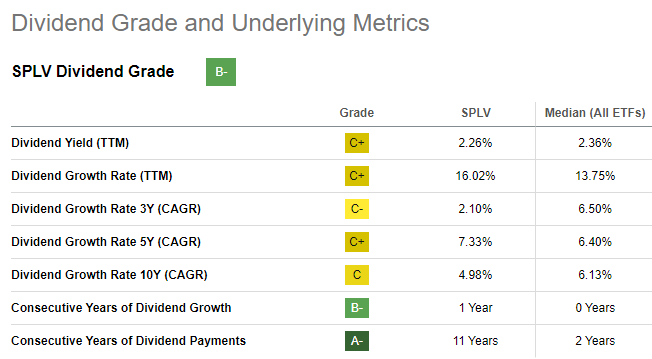
SPDR SSGA US Large Cap Low Volatility Index ETF review
Seeking Alpha describes this ETF as:
The investment seeks to provide investment results that, before fees and expenses, correspond generally to the total return performance of the SSGA US Large Cap Low Volatility Index. The fund generally invests substantially all, but at least 80%, of its total assets in the securities comprising the index. The index is designed to measure the performance of the stocks of U.S. large capitalization companies that exhibit low volatility. Volatility is a statistical measurement of the magnitude of movements in a stock's price over time. LGLV started in 2013.
Source: seekingalpha.com LGLV
LGLV has only $804m in AUM with lower fees of only 12bps. The TTM Yield is lower too at 1.93%.
Index review
SSGA provides this about the index:
The SSGA US Large Cap Low Volatility Index is designed to track the performance of U.S. large capitalization companies that exhibit low volatility. Volatility is a statistical measurement of the magnitude of movements in a stock’s price over time.
- The Index constituents are a subset of the largest 1000 U.S. stocks based on market cap listed on a U.S. exchange as of the Index rebalance date.
- Index utilizes a rules based process that seeks to increase exposure to stocks that exhibit low volatility.
- The index weights securities such that securities with the lower volatility receive the highest weights, subject to liquidity constraint.
Source: ssga.com Index Factsheet
LGLV holdings review
seekingalpha.com LGLV sectors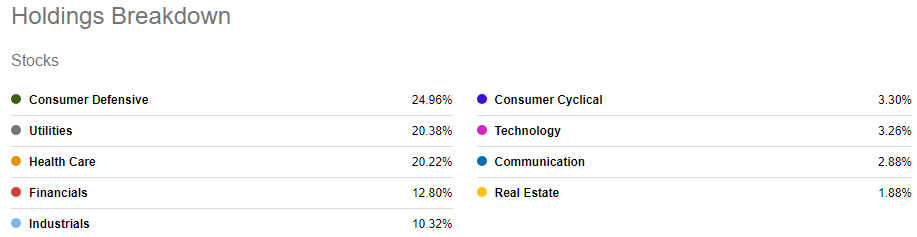
I will match up sector allocations later. Here, the Top 20 come to 22% of the weight. LGLV holds just over 150 stocks, where the smallest one is only .14% in weight. The smallest 50 holdings have the same weight as the biggest 20.
ssga.com; compiled by Author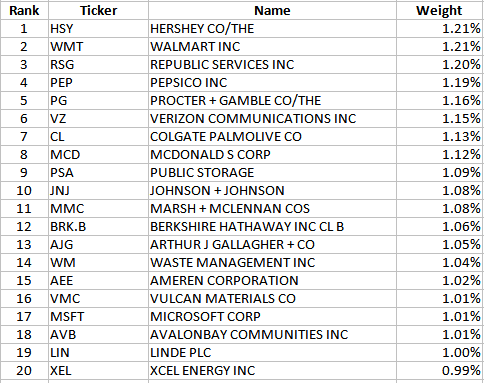
LGLV distribution review
seekingalpha.com LGLV DVDs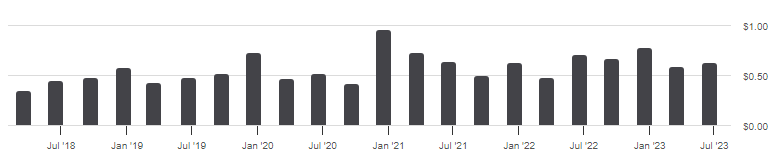
Unlike SPLV, this ETF is more standard and has quarterly payouts. Their better history earns them an "A" rating from Seeking Alpha.
seekingalpha.com LGLV scorecard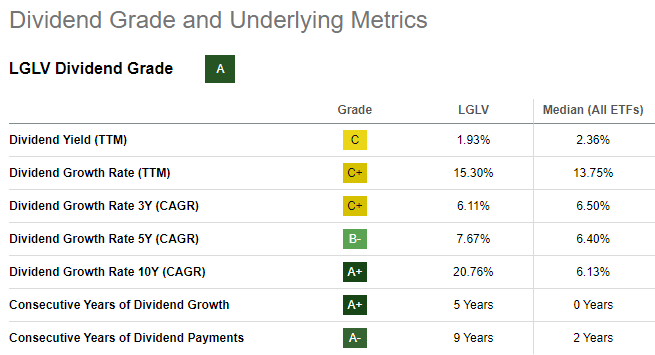
Comparing ETFs
While picking the best low-volatility ETF is the goal, knowing how that compares against an unrestricted ETF like the SPDR S&P 500 Trust ETF (SPY) is useful to know too. First comparison is size and style allocations.
advisors.vanguard.com Compare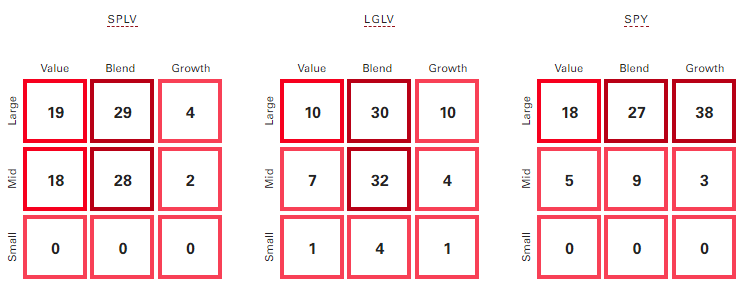
SPLV has the highest allocation to Value stocks of the three and also the largest weight below Large-Cap stocks. Both have less Growth exposure than SPY does. That Value/Growth data is reflected in the ratio/growth statistics.
morningstar.com; compiled by Author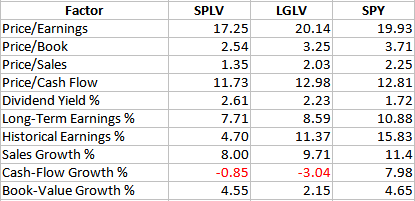
When you compare sectors between the two low-volatility ETFs and with SPY, there are wide differences.
morningstar.com; compiled by Author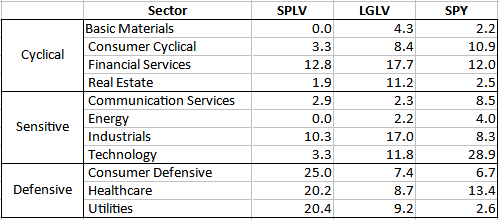
Despite what the past has provided in terms of return, how an investor feels about the current sector, market-cap and Growth/Value allocations would drive their decision on the best one for the near future. That said, here is what investors saw starting from May 2013.
PortfolioVisualizer.com seekingalpha.com homepages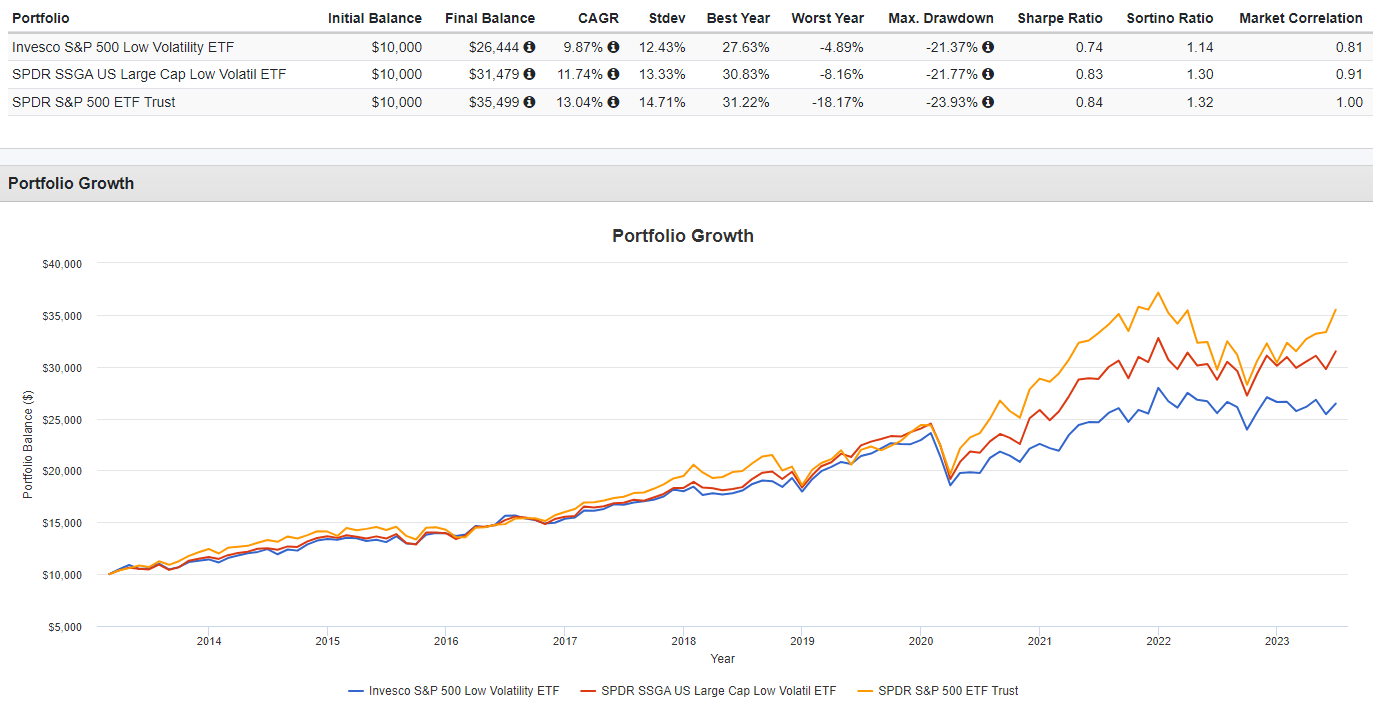
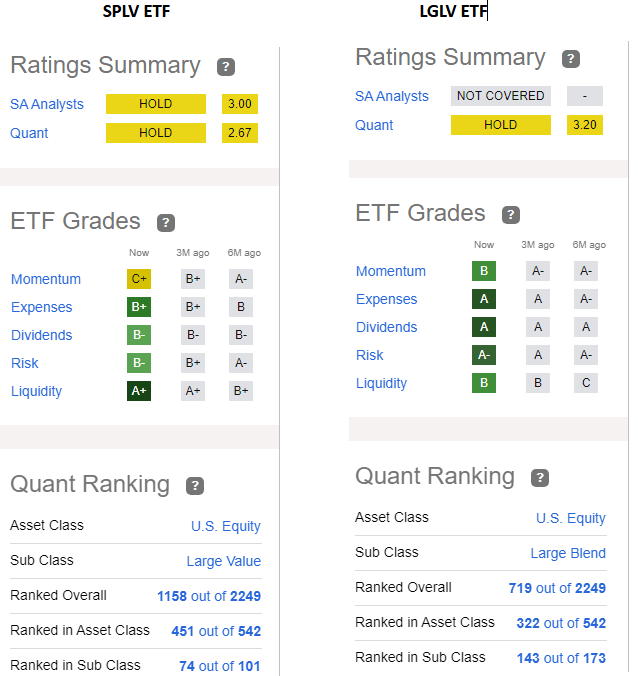
Seeking Alpha classifies these ETF into different sub-classes which mirror my analysis showing SPLV is more Value-oriented than LGLV. Within the larger US Equity class, LGLV has a much higher rank but not near the top.
Portfolio strategy
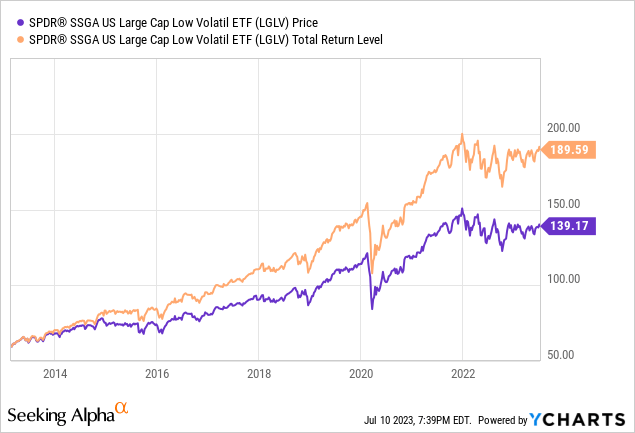
Over longer periods, many low-volatility ETFs have achieved that goal but as one might expect, with lower returns compare to ETFs that look at the same universe of stocks but do not incorporate the volatility factor in their selection and/or portfolio weighting process. After all, Investing 101 teaches us return is related to risk, usually expressed as Beta. As the above 3 ETF chart shows, that is the case here too. That said, both the Sharpe and Sortino ratios say investors did okay from the trade-off the low-volatility LGLV ETF.
Before such funds came available, adding bonds into the mix was the standard answer for risk reduction. Such ideas as the 60/40 allocation or setting your bond weight at 100 minus your age were the mantra for years. To see if these funds can replace bonds for risk reduction, I compared the LGLV ETF against two portfolios that combined the SPY ETF and the iShares Core U.S. Aggregate Bond ETF (AGG) in the standard 60/40 mix and a 90/10 mix that gave CAGR results that LGLV produces by itself. All four options generated about the same value for the Sharpe and Sortino ratios.
PortfolioVisualizer.com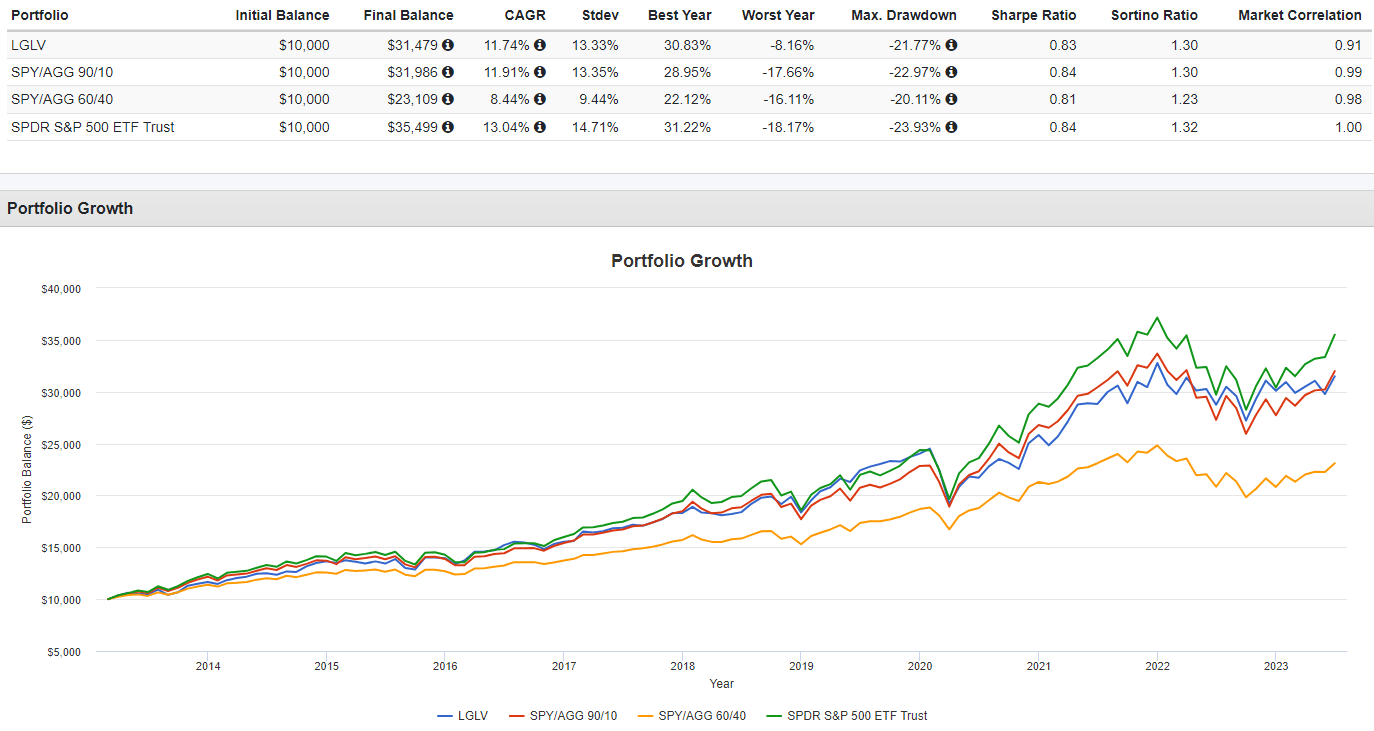
Final thoughts
As with most ETF comparisons I have covered, the final answer comes down, as always, to what the investor wants and how these ETFs fit into what they already own. Taking into account the above data is for just over ten years, here is what I see:
- SPY has the highest CAGR and the same for the two risk ratios, indicating investors were paid for the extra risk of owning SPY.
- The past return data favors LGLV over SPLV as do the risk ratios even with its slightly higher StdDev and Beta (.8 vs. .66).
- Despite experts claiming the 60/40 portfolio is dead, as measured by the risk ratios, over the past decade it held its own.
The LGLV ETF gets a Buy rating for those willing to trade some return for less risk.

I ‘m proud to have asked to be one of the original Seeking Alpha Contributors to the 11/21 launch of the Hoya Capital Income Builder Market Place.
This is how HCIB sees its place in the investment universe:
Whether your focus is high yield or dividend growth, we’ve got you covered with high-quality, actionable investment research and an all-encompassing suite of tools and models to help build portfolios that fit your unique investment objectives. Subscribers receive complete access to our investment research - including reports that are never published elsewhere - across our areas of expertise including Equity REITs, Mortgage REITs, Homebuilders, ETFs, Closed-End-Funds, and Preferreds.
This article was written by

I have both a BS and MBA in Finance. I have been individual investor since the early 1980s and have a seven-figure portfolio. I was a data analyst for a pension manager for thirty years until I retired July of 2019. My initial articles related to my experience in prepping for and being in retirement. Now I will comment on our holdings in our various accounts. Most holdings are in CEFs, ETFs, some BDCs and a few REITs. I write Put options for income generation. Contributing author for Hoya Capital Income Builder.
Analyst’s Disclosure: I/we have no stock, option or similar derivative position in any of the companies mentioned, and no plans to initiate any such positions within the next 72 hours. I wrote this article myself, and it expresses my own opinions. I am not receiving compensation for it (other than from Seeking Alpha). I have no business relationship with any company whose stock is mentioned in this article.
Seeking Alpha's Disclosure: Past performance is no guarantee of future results. No recommendation or advice is being given as to whether any investment is suitable for a particular investor. Any views or opinions expressed above may not reflect those of Seeking Alpha as a whole. Seeking Alpha is not a licensed securities dealer, broker or US investment adviser or investment bank. Our analysts are third party authors that include both professional investors and individual investors who may not be licensed or certified by any institute or regulatory body.