Toronto-Dominion And Royal Bank: Canada's Yield Curve Inverts

Summary
- The Toronto-Dominion Bank and Royal Bank of Canada are set to release earnings in mid-to-late August, following strong Q2 results from U.S. banks.
- Canada's inverted yield curve could squeeze margins and impact profitability at these banks.
- Toronto-Dominion Bank has better capital, liquidity, and stable funding ratios than Royal Bank does.
- Royal Bank has a more successful investment banking segment than Toronto-Dominion does.
- In this article, I look at the two banks side by side to determine which is best able to survive Canada's inverted yield curve.
dbarcroft
The big U.S. banks are releasing earnings, and Canadian banks aren't too far behind.
This morning, JPMorgan Chase (JPM), Citigroup (C), and Wells Fargo (WFC) all published their Q2 earnings releases, mostly beating expectations (Citigroup was the one exception). The post-earnings trading in U.S. bank stocks was intense, as investors digested the implications of rising earnings and dividends. At one point, JPM stock was up 3% pre-market.
It's against this backdrop that we find The Toronto-Dominion Bank (NYSE:TD, TSX:TD:CA) and Royal Bank of Canada (NYSE:RY, TSX:RY:CA) today. Much like their U.S. counterparts, they are releasing earnings shortly (mid-to-late August), and there's a lot on the line.
TD and Royal Bank are two of Canada's biggest banks. RY is the biggest by market cap, and TD is the biggest by total assets. Many dividend investors like these stocks, as they have higher yields than their U.S. counterparts, even after accounting for Canada's 15% withholding tax.
Canada has a very robust financial regulatory system. The country's regulators currently mandate a minimum 11% CET1 ratio, as well as several minimums on liquidity and stable funding ratios. These regulations help Canadian banks avoid "collapse" scenarios like those that plagued U.S. regional banks this past Spring.
So, Canadian bank stocks are very appealing from the perspective of income and capital preservation. There's just one problem:
Canada's yield curve is deeply inverted. As you can see in the chart below, Canada's yield curve has a perfectly downward slope, with every maturity having a lower yield than the maturity shorter than it.
Canada yield curve (Bank of Canada)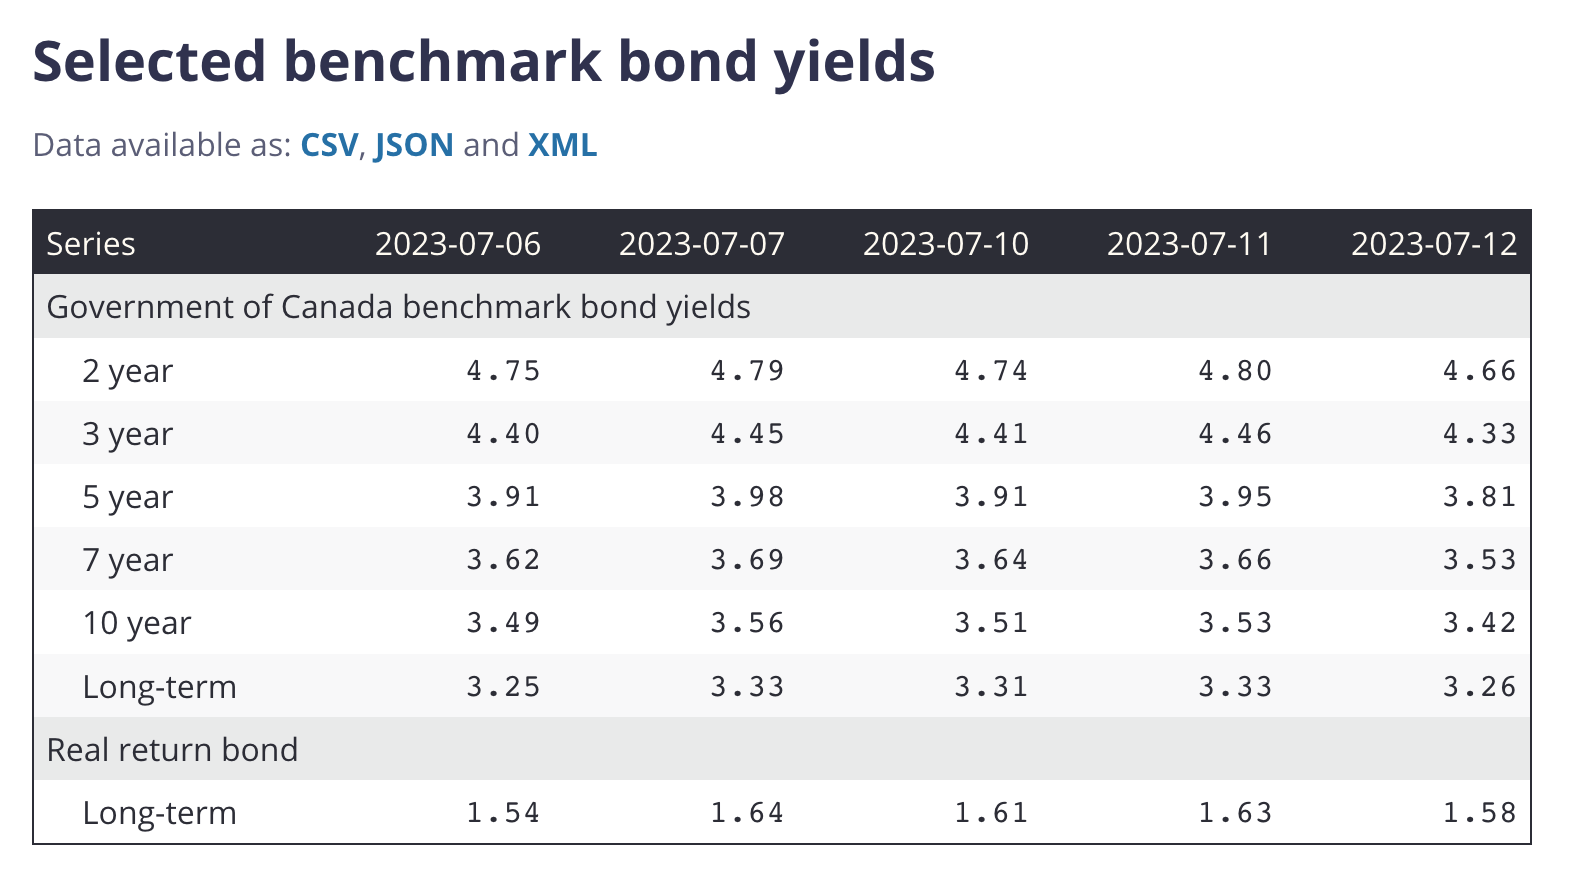
Why is this a problem for TD and Royal Bank?
Primarily because of how banks finance their operations. Banks finance their loans via deposits, most of which are short-term. Bank deposits range from long maturity term deposits (3-5 years) to short-term ones (1-3 months) to checking accounts, which give depositors the right to withdraw at any time. When short-term treasuries get progressively higher yields, owning low-yield bank deposits becomes less and less appealing. Over time, this creates pressure for banks to match treasury yields. This tends to squeeze margins. If short-term treasuries actually yield more than long-term treasuries-which happens when the yield curve inverts-banks can become unprofitable. This actually happened in the U.S. savings and loans crisis in the 1990s, when a rush to withdraw money from S&Ls led to many such "mini banks" collapsing outright.
To date, Canada has never suffered a banking crisis akin to the 1990s savings and loan crisis. Canada's strict financial regulations and concentrated market help prevent that from happening. However, survival and profitability are two very different things. Even in a financial services market dominated by a few large, powerful players, an inverted yield curve should eventually squeeze margins, unless some other factor intervenes.
Currently, Canada's 2-10 year yield spread is -126 basis points. This is much more severe than the 2-10 year spread in the U.S., which is -83 basis points. This degree of inversion could impact TD and Royal Bank in many ways. First, term deposits (in Canada, these are called "GICs") will face pressure to match the yields on short-term treasuries. Second, if TD and Royal Bank don't match the treasury yields, they may see depositors pull out money. Third and finally, if depositors do pull out money, then TD and Royal Bank will have to sell treasuries in order to pay for the withdrawals. All of this will eventually result in funding costs catching up with loan income, reducing NII.
How can investors know which bank is safest in an environment like this?
There are two approaches:
Risk management. Banks that practice sound risk management will generally fare better when deposits are under pressure, than those that do not.
Other lines of business. There are some banking sub-sectors, like investment banking, that aren't as affected by yield curve inversion as badly as retail is. Banks that have more invested in these segments could fare better when the yield curve is inverted than those with less invested in them. However, as we'll see shortly, that's not how it has worked out so far this year.
Under normal circumstances, TD and Royal Bank are both great banks. Indeed, many investors hold both stocks, and they're not wrong to do so. But if you're trying to achieve a portfolio consisting of truly "best-in-class" names, it helps to know which one is best. So, in the ensuing paragraphs, I will compare TD and Royal Bank side by side, to see which is best equipped to handle today's tight monetary environment.
Risk Metrics
The most obvious metrics to use to compare TD and Royal Bank today are risk metrics. Such metrics - including capital, liquidity, and stable funding ratios - are standard for analyzing banks' risk exposures. Capital, liquidity and stable funding are different concepts, but the ratios used in each category involve similar things like cash, treasuries, deposits, and assets. Below, I've compiled key risk metrics for TD and Royal Bank, starting with the raw balance sheet data and concluding with the computed ratios.
Regulatory requirement | |||
CET1 capital | $84.3B | $81.1B | |
Tier 1 capital | $95.1B | $88.4B | |
Tier 2 capital | $12.85B | $11.14B | |
Total capital | $107.9B | $99.54B | |
Risk-weighted assets | $549.4B | $593.5B | |
Highly liquid assets | $374B | $390.5B | |
Expected net outflows | $251B | $288.4B | |
Available stable funding | $1.125T | $921.1B | |
Required stable funding | $921.6B | $820.9B | |
CET1 ratio | 15.3% | 13.7% | |
Tier 1 capital ratio | 17.3% | 14.9% | 12.5% |
Total capital ratio | 19.7% | 16.8% | 14.5% |
Liquidity coverage ratio | 141% | 135% | 100% |
Net stable funding ratio | 122% | 112% |
As you can see, TD Bank beats Royal Bank on all the important capital, liquidity, and stable funding ratios. So, going by standard risk metrics, TD is better able to survive a banking crisis than Royal Bank is. However, there are other considerations apart from these standard metrics, which I'll be exploring in the next section.
Non-Lending Business Activities
Another way in which a bank can thrive despite an inverted yield curve is by having non-lending business activities. Businesses like investment banking, wealth management and insurance don't revolve around lending, so they can thrive and offset shrinking margins in retail banking when the yield curve inverts. This is primarily a matter of profitability: having an investment banking segment doing $50 billion a year in revenue won't save you if you experience $1 trillion in withdrawal requests on $500 billion in liquidity. But provided a bank is basically liquid and well capitalized, these other lines of business can help with profitability.
How do TD and Royal Bank stack up in this regard?
Last quarter, TD delivered:
$3.7 billion in adjusted net income, up 1%.
$563 million in wealth management/insurance net income, down 16%.
$150 million in investment banking net income, down 58%.
So we've got 19.2% of TD's business coming from non-lending activities, and those activities are a drag on performance. The lending parts of the business-personal banking, commercial banking, brokerage-actually grew, while the others shrank. Unfortunately, it looks like investment banking, wealth management and insurance are not serving as profitability buffers against squeezed net interest margins at TD. Instead, they are a drag on performance.
Now, let's look at Royal Bank. Last quarter, it delivered:
$3.75 billion in net income, down 13%.
$742 million in wealth management earnings, down 8%.
$139 million in insurance earnings, down 39%.
$939 million in capital markets (i.e., investment banking earnings), up 10%.
So, we have 48% of Royal Bank's earnings coming from non-lending segments. And, unlike with TD, investment banking is actually contributing to positive growth at Royal Bank. The growth in capital markets was mostly due to tax changes, granted, but it was still a positive. On the whole, I would say that Royal Bank scores better than TD on operational diversification.
Valuation
As we've seen, TD Bank beats Royal Bank on risk management, while Royal Bank beats TD on the success of its non-lending operations. In other words, our comparison between TD and Royal Bank is so far basically a tie. TD takes the cake on capital, liquidity and funding, while Royal Bank has a more successful investment banking segment than TD does. We'll need to look at how these stocks are being valued to make a final call.
According to Seeking Alpha Quant, TD, and Royal Bank trade at the following multiples:
TD Bank | Royal Bank | |
GAAP P/E | 10 | 13 |
Adjusted P/E | 10 | 11.82 |
Price/sales | 3.2 | 3.55 |
Price/book | 1.43 | 1.76 |
As you can see, all of TD Bank's multiples are lower than RY's. Additionally, if you discount TD's TTM EPS at the current 10-year treasury yield (4%) plus a 4% risk premium, with 0% growth assumed, you get a $73 fair value estimate, or 16% upside. If you do the same exercise for Royal Bank, you get a $93.5 fair value estimate, which is below the current stock price. Going by either multiples or discounted earnings under a 0% growth assumption, TD Bank is cheaper than Royal Bank. Yet, TD also beats RY on every single commonly used risk management metric, and had more growth last quarter.
The fact that Royal Bank is seeing some positive growth in investment banking isn't enough to overcome the fact that TD is both cheaper and less risky than RY. If I had to pick one of these banks, I'd pick The Toronto-Dominion Bank in a heartbeat.
This article was written by

Analyst’s Disclosure: I/we have a beneficial long position in the shares of TD, TD:CA either through stock ownership, options, or other derivatives. I wrote this article myself, and it expresses my own opinions. I am not receiving compensation for it (other than from Seeking Alpha). I have no business relationship with any company whose stock is mentioned in this article.
Seeking Alpha's Disclosure: Past performance is no guarantee of future results. No recommendation or advice is being given as to whether any investment is suitable for a particular investor. Any views or opinions expressed above may not reflect those of Seeking Alpha as a whole. Seeking Alpha is not a licensed securities dealer, broker or US investment adviser or investment bank. Our analysts are third party authors that include both professional investors and individual investors who may not be licensed or certified by any institute or regulatory body.