FMIL: Active ETF Worth Keeping An Eye On

Summary
- The Fidelity New Millennium ETF is an actively managed non-transparent ETF that has shown strong recent performance, despite a tough macroeconomic environment.
- The FMIL ETF invests in global stocks using Fidelity's proprietary research, with a focus on identifying long-term changes in the marketplace and investing in companies that may benefit from these changes.
- Despite strong historical performance, there is some hesitancy to invest due to a recent change in management.

DenisTangneyJr
The Fidelity New Millennium ETF (BATS:FMIL) is an ETF version of Fidelity's long running Fidelity New Millennium Fund.
While I am impressed by the FMIL ETF's recent performance, essentially flat in 2022 during one of the toughest years in the past decade, I am a little hesitant to invest in FMIL due to the recent manager change. However, I am placing the FMIL ETF onto my watchlist to see how the new manager navigates the current macro-economic environment and whether he can continue the fund's long-term performance track record.
Fund Overview
The Fidelity New Millennium ETF is an actively managed non-transparent exchange traded fund ("ETF"). The FMIL ETF invests in global stocks using Fidelity's proprietary bottom-up fundamental research.
The strategy's goal is to identify early signs of long-term changes in the marketplace and focusing on companies that may benefit from these changes, whether they are due to technological advances, changing demographics, or economic plans. The FMIL ETF's strategy may involve investments in small and medium-sized companies and either 'growth' or 'value' stocks.
What Are Non-Transparent ETFs?
Active Non-Transparent ETFs are actively managed ETFs that disclose their holdings on a delayed basis. This helps firms like Fidelity protect their proprietary 'secret sauce' from competitors and allow the fund managers to implement their strategies without the risk of being copied or front-run. Issuers like Fidelity have lobbied the regulators for years to launch non-transparent ETFs and they finally won approval in 2019. The FMIL ETF was launched in June 2020.
By being non-transparent, the FMIL ETF may create additional risks for investors. For example, without daily transparency of the portfolio's holdings, the FMIL ETF may trade at wider bid/ask spreads compared to other ETFs. In the past year, the FMIL ETF has traded at premium/discounts to NAV of as wide as 0.5% (Figure 1).
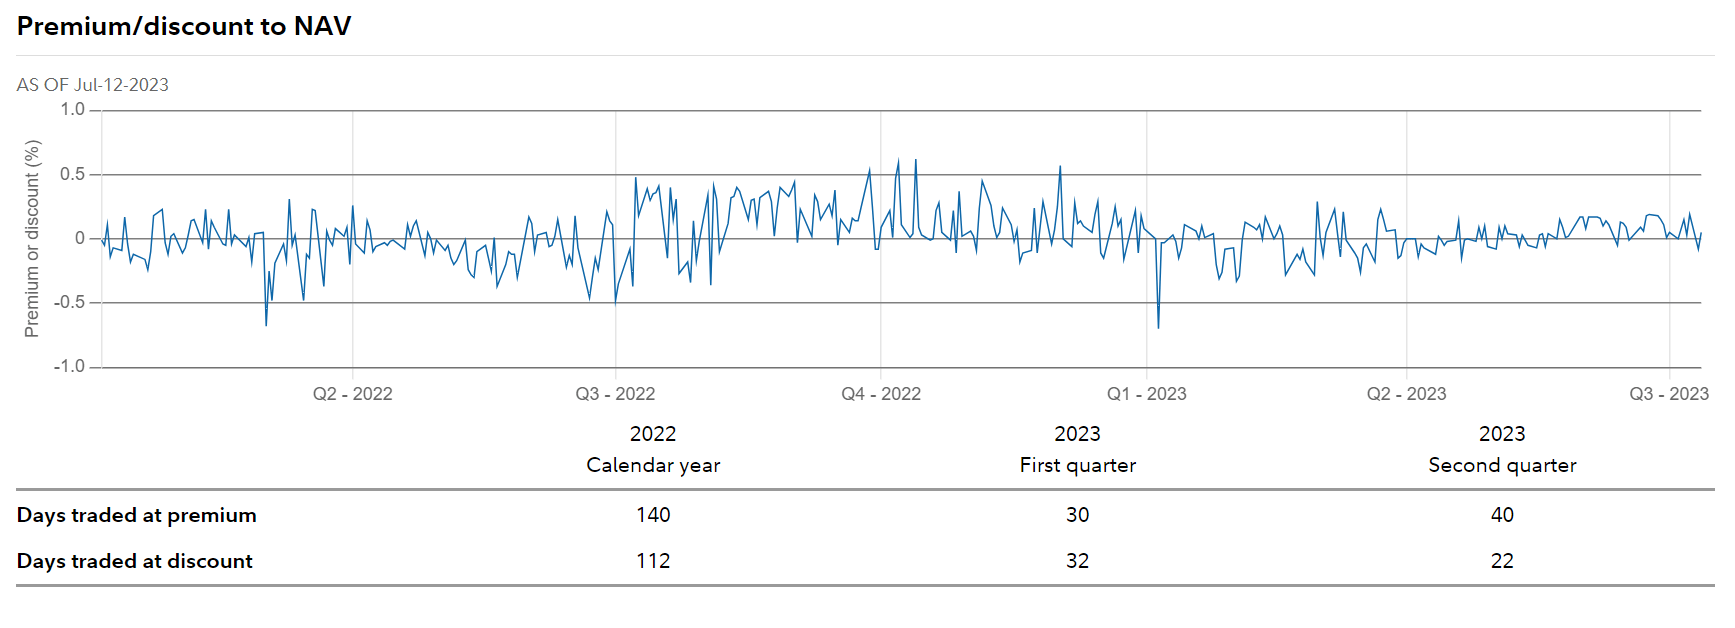
Figure 1 - FMIL has wide premium/discounts to NAV (fidelity.com)
This is in stark contrast to large transparent ETFs like the SPDR S&P 500 ETF Trust (SPY), where premium/discounts to NAV are measured in basis points (Figure 2).
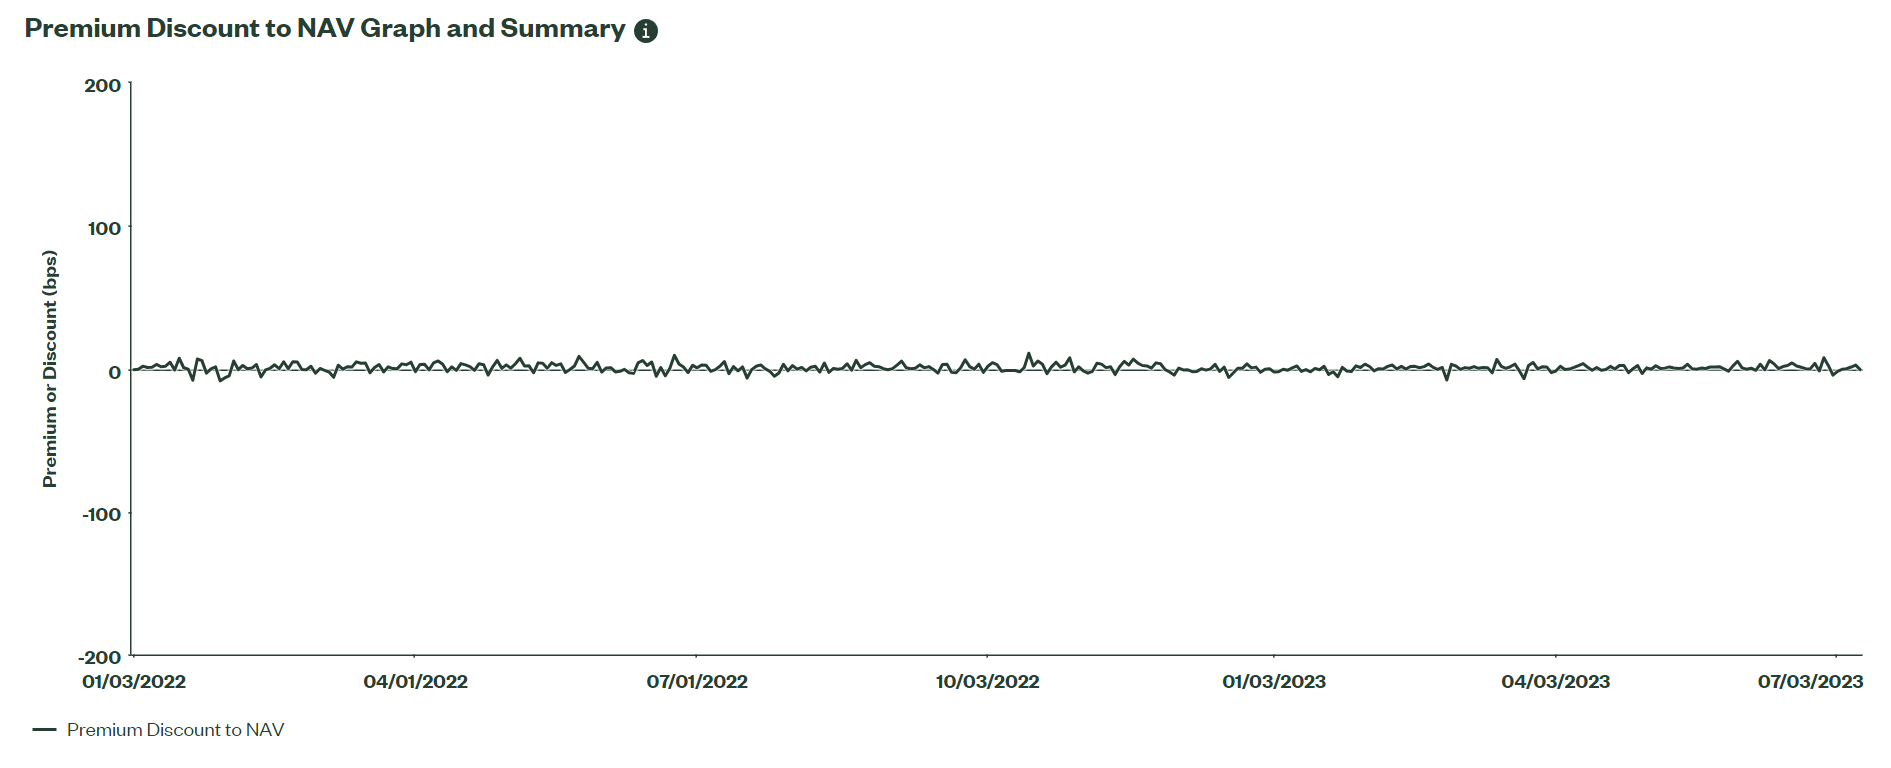
Figure 2 - SPY has premium/discounts measured in basis points (ssga.com)
The FMIL ETF has $97 million in assets and charges a 0.59% expense ratio.
Portfolio Holdings
As a non-transparent ETF, the FMIL ETF only disclose its holdings on a 30-day delay. Figure 3 shows the FMIL ETF's asset class allocation as of May 31, 2023. The FMIL ETF is predominantly invested in U.S. equities, with 92.8% of the portfolio. It also holds 5.5% in non-U.S. equities.
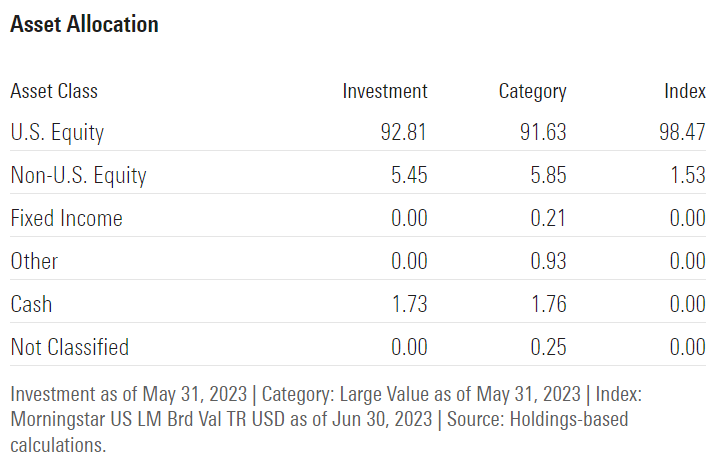
Figure 3 - FMIL asset allocation (morningstar.com)
According to Morningstar's analysis, FMIL's portfolio is growth and momentum-oriented, as of April 30, 2023 (Figure 4).
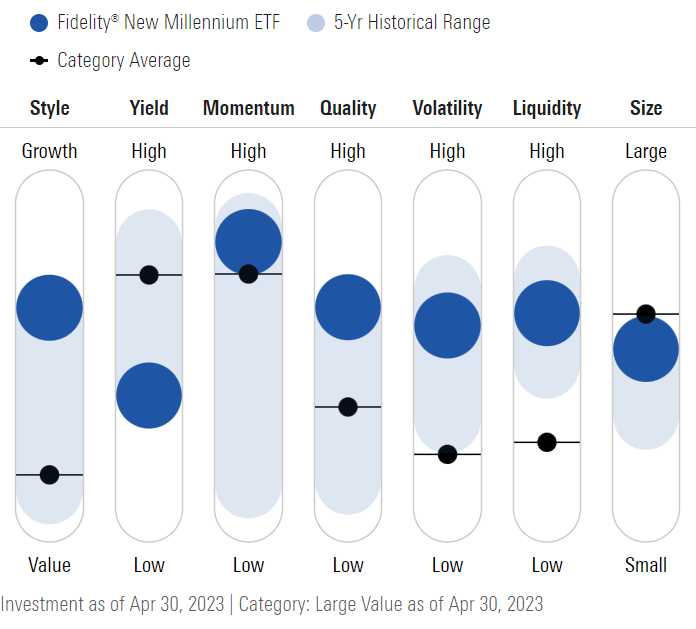
Figure 4 - FMIL is growth and momentum focused (morningstar.com)
The FMIL ETF's sector exposure as of May 31, 2023 is shown in Figure 5. The ETF is heavily weighted towards Technology (30.7%), Health Care (12.9%), Industrials (12.2%), Consumer Cyclicals (10.0%), and Financials (8.9%).
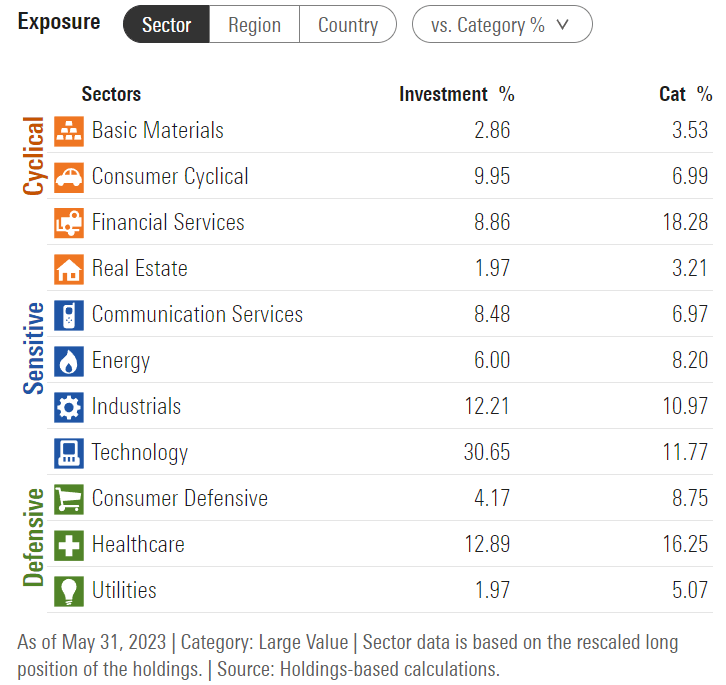
Figure 5 - FMIL sector allocation (morningstar.com)
However, as an active fund, FMIL's portfolio allocations are subject to change. For example, as of January 31, 2023, the FMIL ETF's allocation to Technology was materially lower at 22.3% while the allocation to Financials was significantly higher at 11.8% (Figure 6).
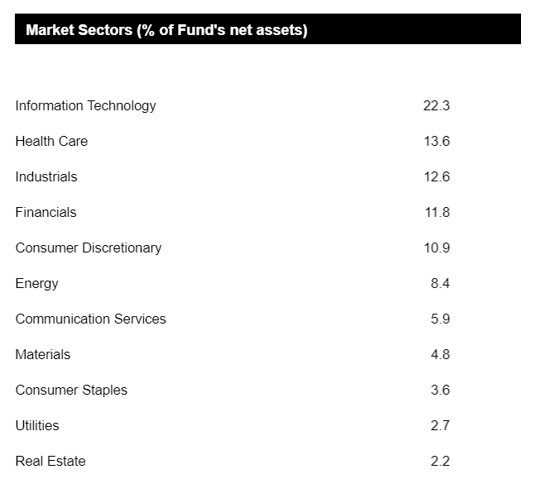
Figure 6 - FMIL sector allocation as of January 2023 (FMIL semi-annual report)
Distribution & Yield
Investors considering the FMIL ETF should not be looking forward to the fund paying a high distribution yield. The FMIL ETF only pays a nominal quarterly distribution, with a trailing 12 month distribution of $0.40 / share or 1.2% yield (Figure 7).
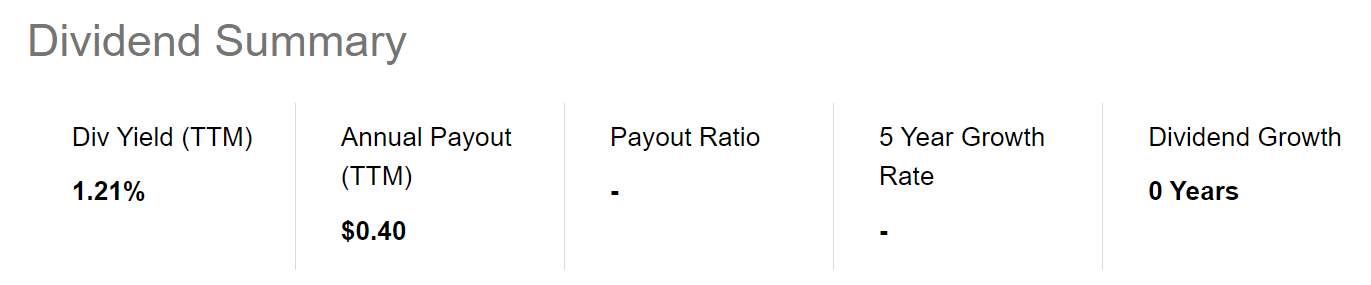
Figure 7 - FMIL is not known for its distribution (Seeking Alpha)
Returns
Ultimately, an investment in an active fund is a bet on the fund manager's ability to outperform. In this area, the FMIL appears to be delivering on its promise. The FMIL ETF has delivered 21.2% average annual returns on a 3Yr basis to June 30, 2023 (Figure 8).
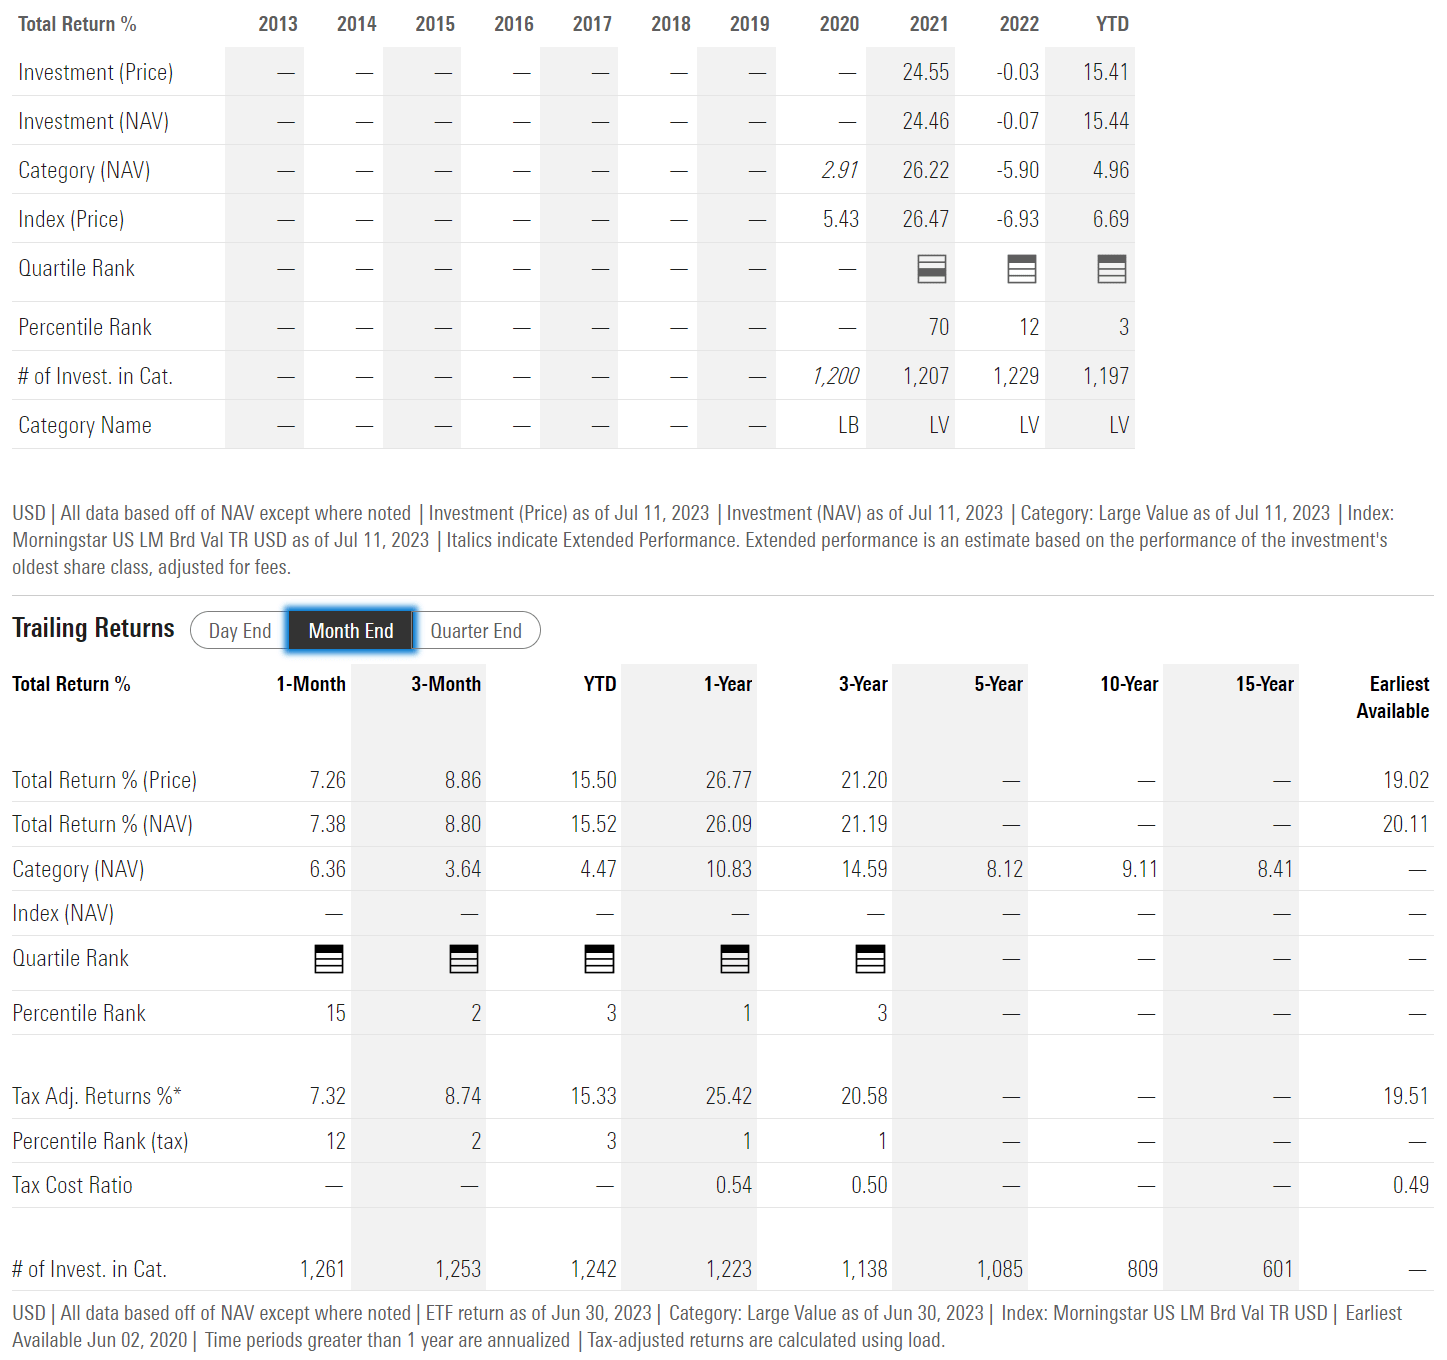
Figure 8 - FMIL historical returns (morningstar.com)
Importantly, the FMIL ETF was relatively unscathed in 2022 despite the steep equity bear market, returning -0.1% for the full year compared to -18.1% for the SPY ETF (Figure 9).
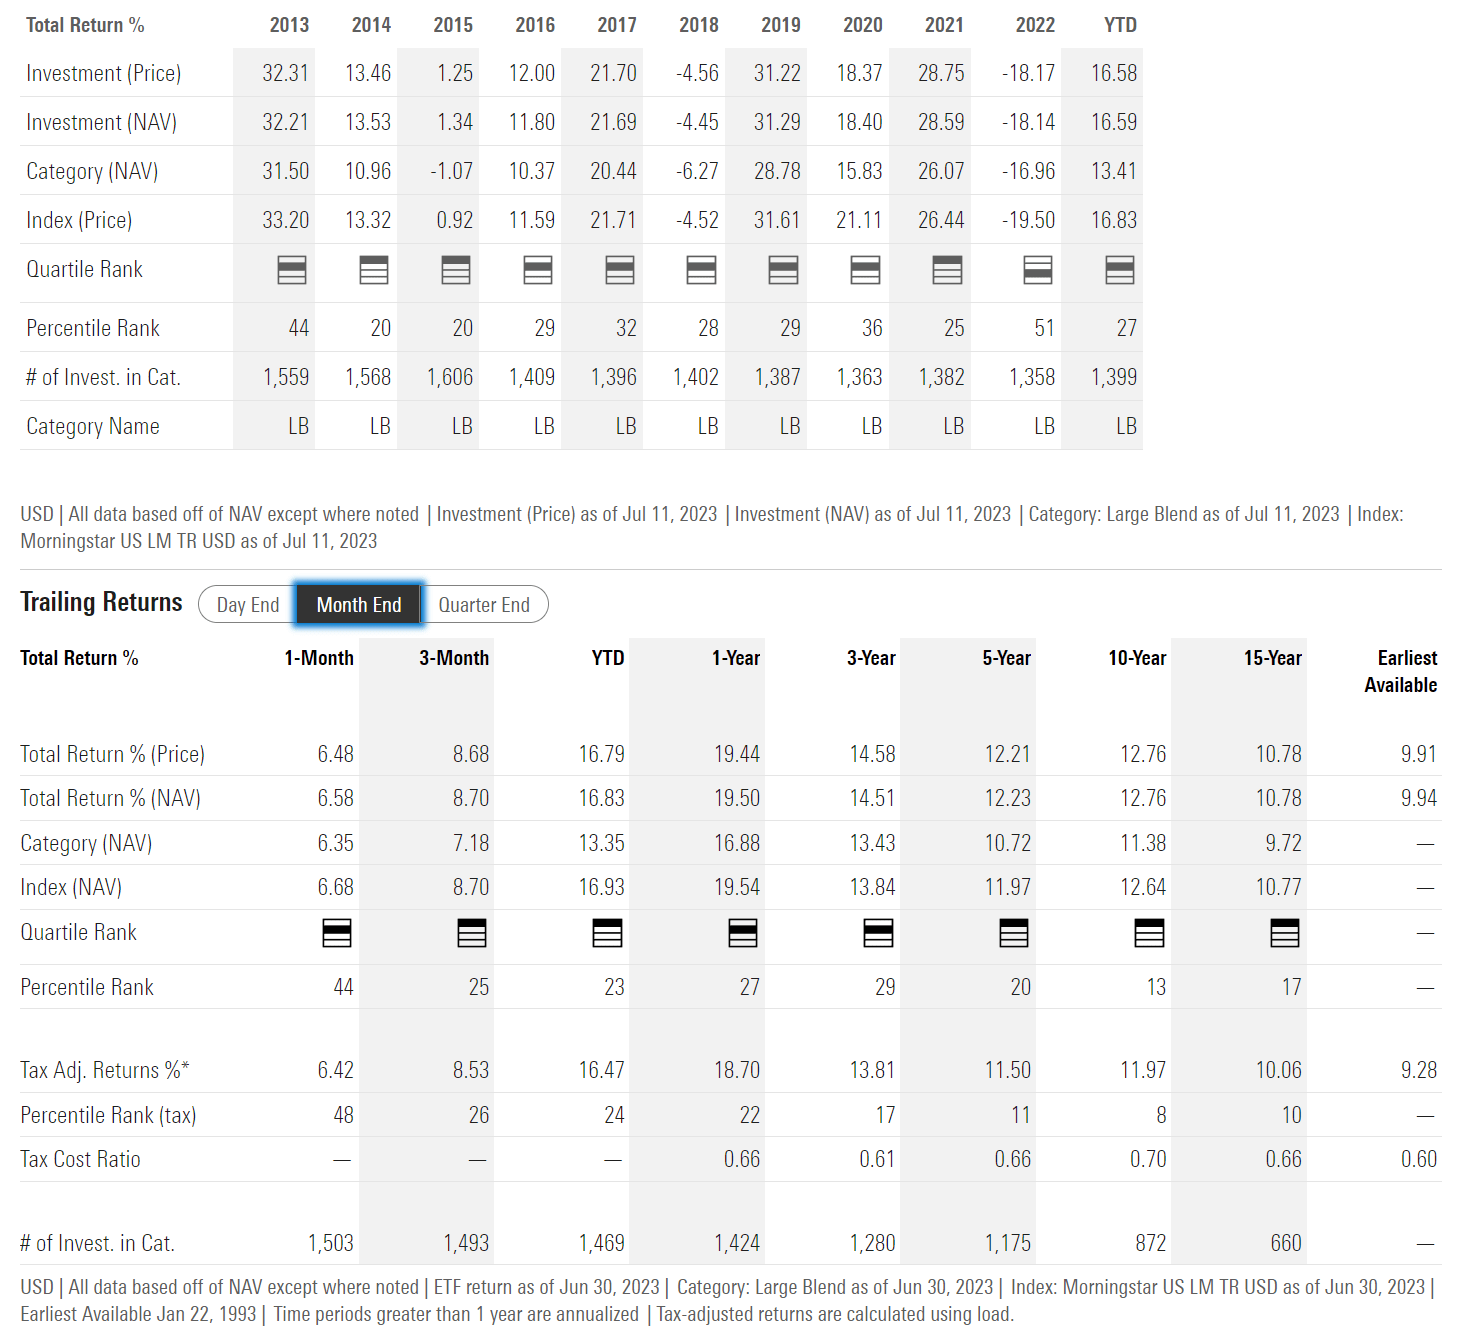
Figure 9 - SPY historical returns (morningstar.com)
Although the FMIL ETF underperformed the SPY ETF in 2021 (24.5% vs. 28.6% for SPY) and YTD 2023 (15.5% vs. 16.8% for SPY), its ability to sidestep the 2022 bear market has allowed FMIL to deliver much stronger 3Yr average annual returns of 21.2% compared to 14.5% for SPY.
In a head-to-head comparison between FMIL and SPY, we can see that the FMIL ETF has compounded at a 21.1% CAGR from July 2020 to June 2023 compared to SPY's 14.6%. The two funds have similar volatilities (18.5% vs. 18.2%) but the FMIL ETF has a much smaller maximum drawdown 13.9% vs. 23.9% and superior Sharpe ratio 1.05 vs. 0.76 (Figure 10).
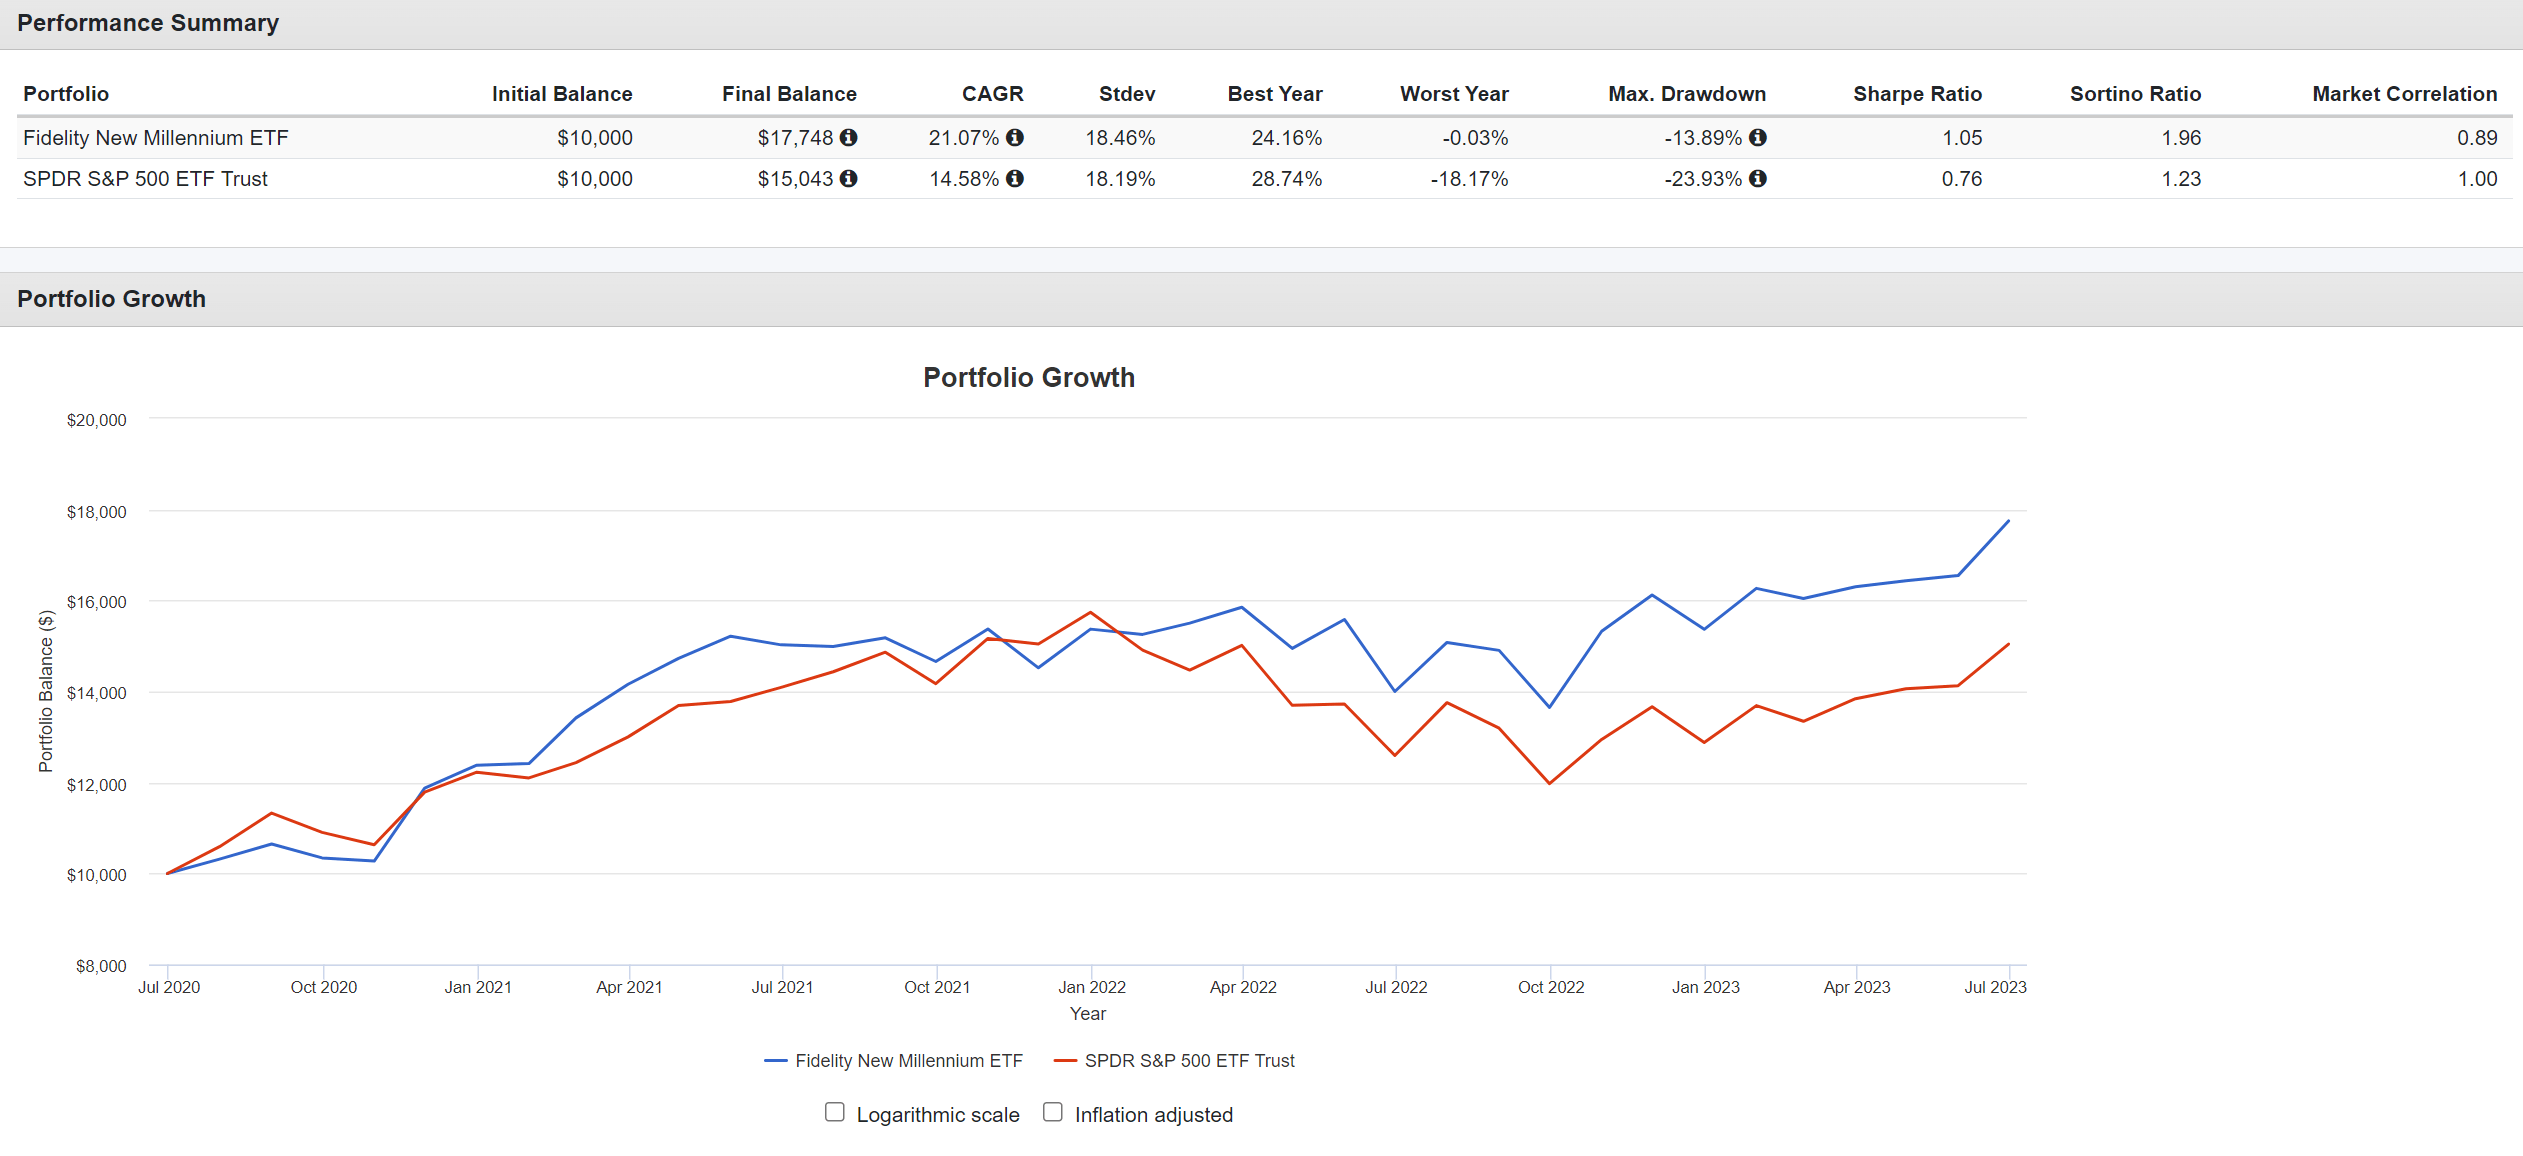
Figure 10 - FMIL vs. SPY (Author created with Portfolio Visualizer)
New Millennium Has Long History
Although the FMIL ETF does not have a long operating history, the underlying strategy has been around for almost 3 decades. The New Millennium ETF is actually the Fidelity New Millennium Fund (FMILX) that has been in operation since 1993, but placed into an ETF wrapper.
Comparing FMILX against the SPY ETF, we can see that since inception, the Fidelity New Millennium Fund has compounded at a 12.8% CAGR compared to 9.9% for the SPY ETF. However, the FMILX fund is much more volatile, with 21.5% volatility compared to SPY's 14.9%. This leads to similar Sharpe ratios for the two funds (Figure 11).
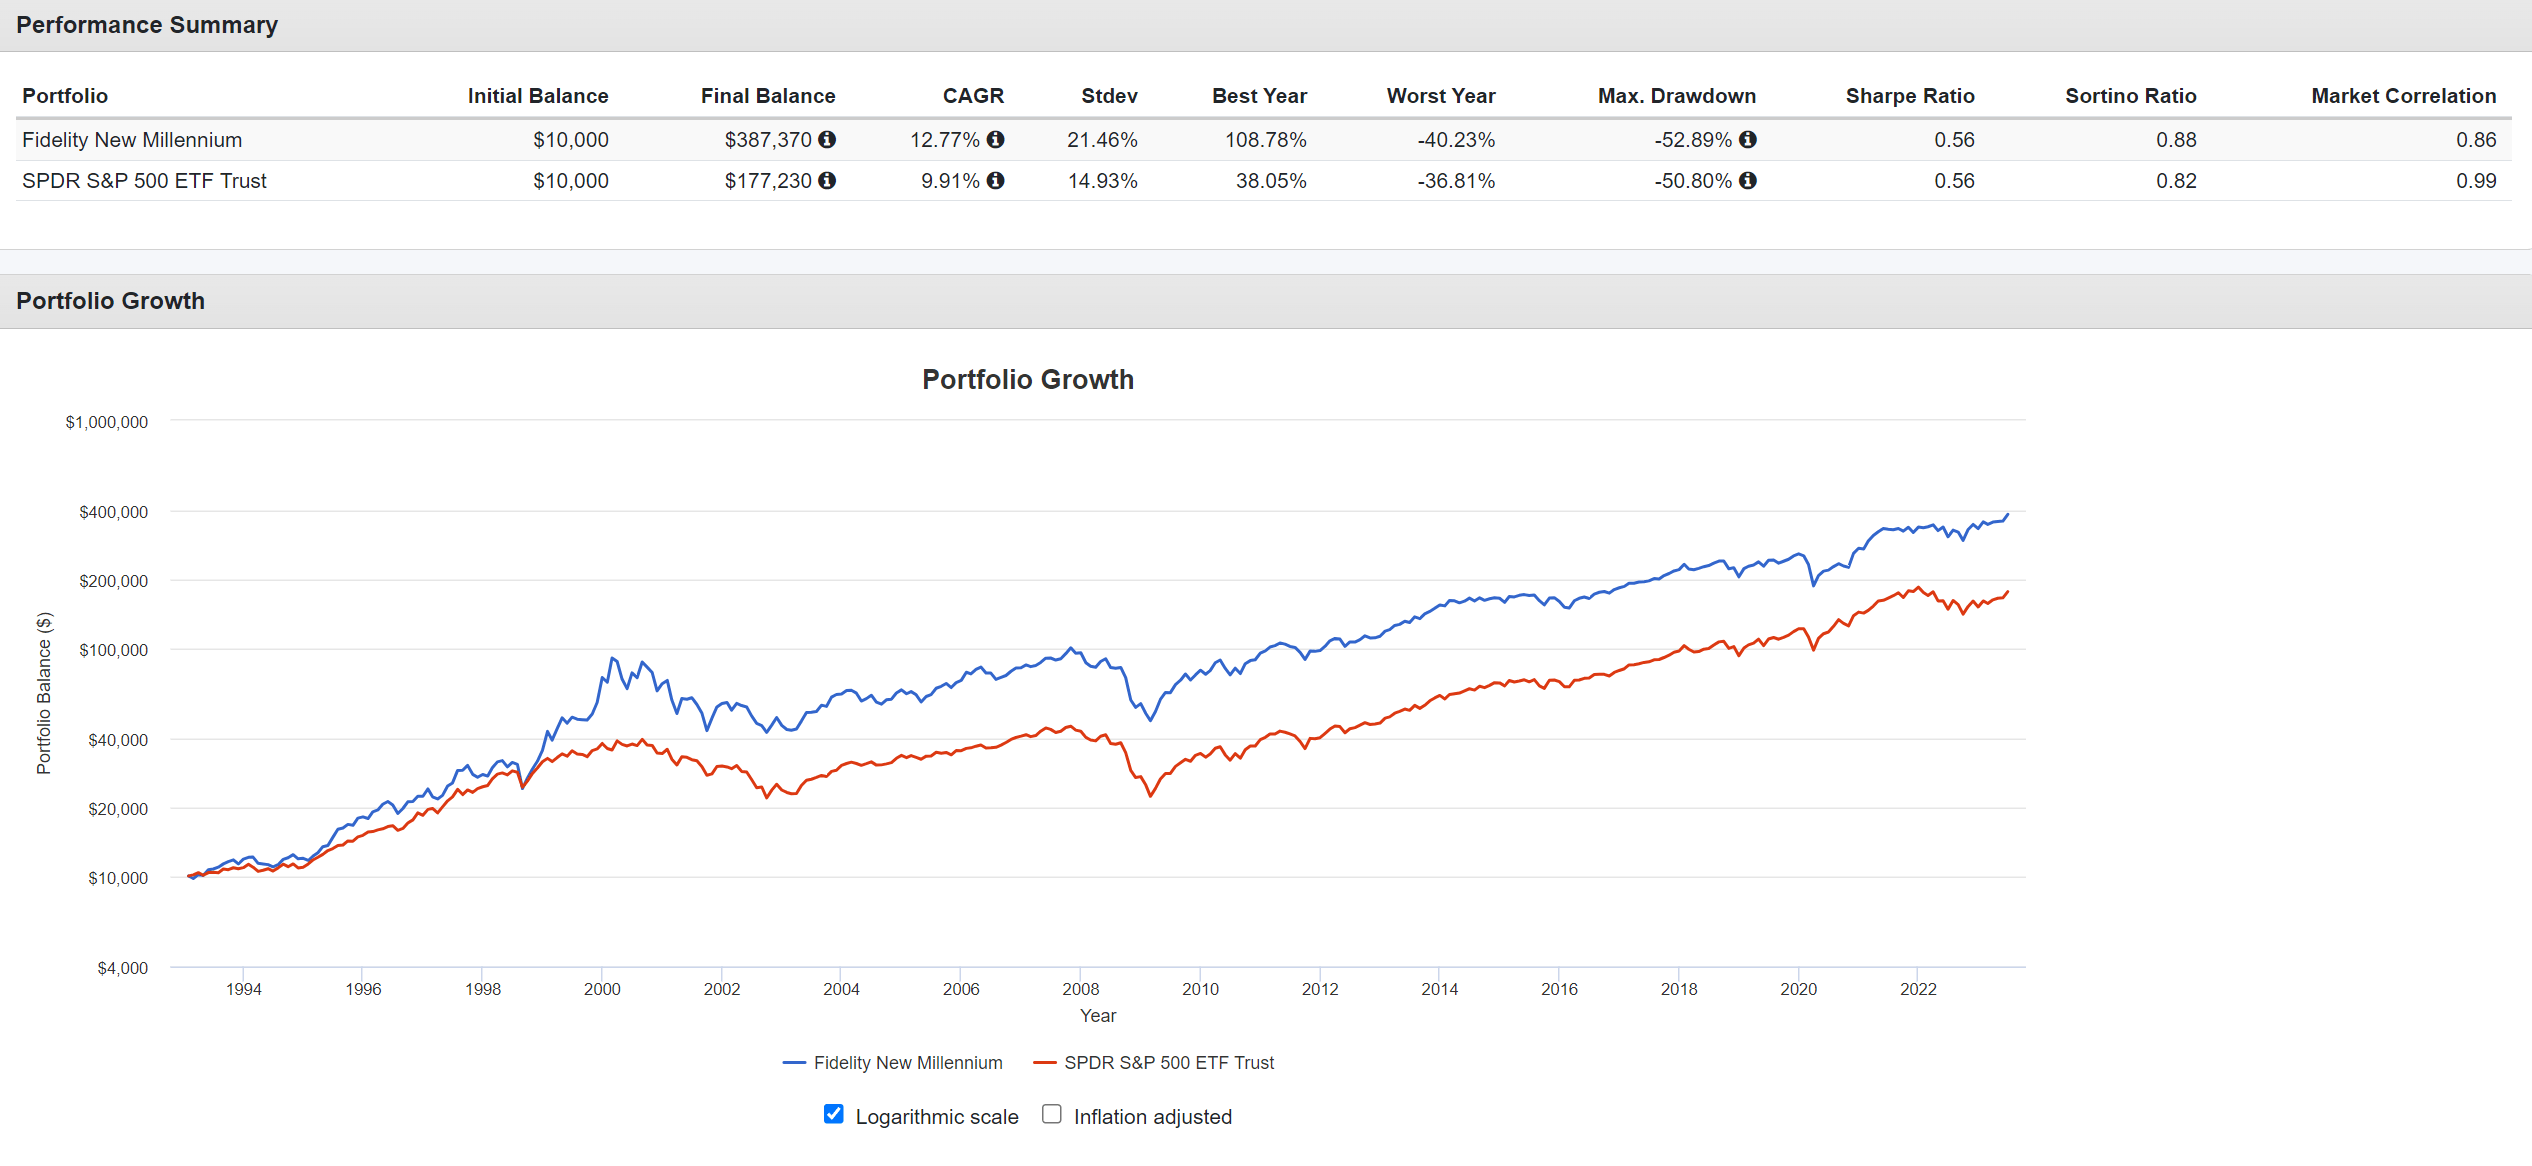
Figure 11 - FMILX vs. SPY (Author created with Portfolio Visualizer)
Although recent results are strong, the FMILX fund has underperformed the SPY ETF on trailing 5Yr and 10Yr average annual returns (Figure 12). These figures are inclusive of the 2022 outperformance.
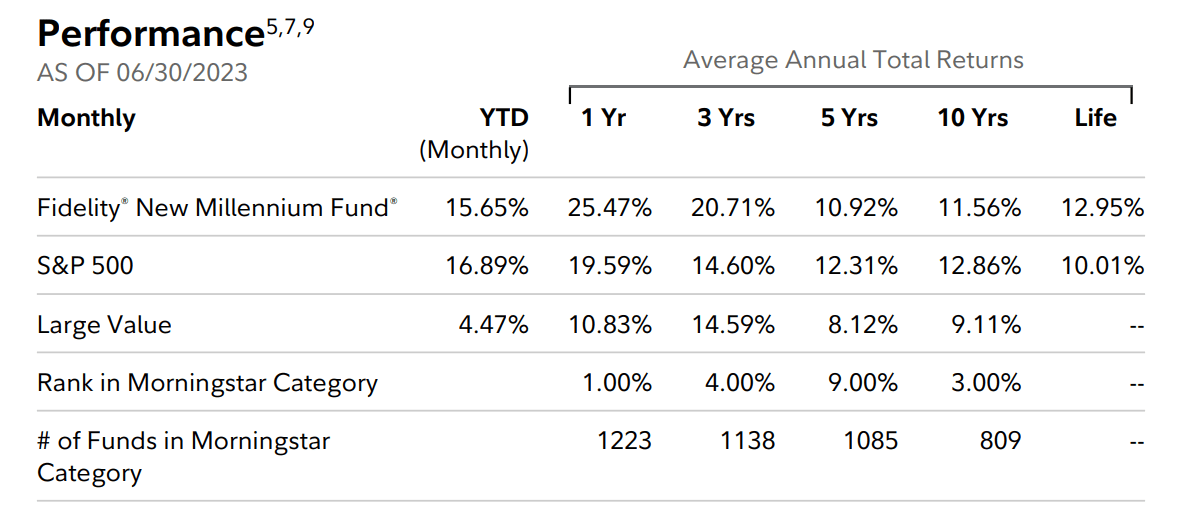
Figure 12 - FMILX historical returns (FMILX factsheet)
Furthermore, the fund manager that had been at the helm of the New Millennium Fund since 2006, John Roth, recently retired from Fidelity to become COO for the Buffalo Sabres. So the fund's historical returns may not be indicative of incoming fund manager, Daniel Sherwood's, track record. The New Millennium Fund will be Mr. Sherwood's first stint as the primary manager of a marquee fund.
Conclusion
The Fidelity New Millennium ETF is an actively managed ETF that is based on the long-running Fidelity New Millennium Fund. Recent returns for the FMIL ETF has been strong, as the fund manager was able to mostly sidestep 2022's bear market.
Historically, the FMILX fund has outperformed the markets, as represented by the SPY ETF. However, results in the past decade has been less strong (inclusive of 2022's outperformance), and there has been a recent manager retirement.
While I like Fidelity's reputation and the FMIL/FMILX's strong track record, I am a little hesitant to commit capital to the fund just yet. I am placing the FMIL ETF onto my watchlist to see how the manager navigates the current tricky macroeconomic environment.
This article was written by

Analyst’s Disclosure: I/we have no stock, option or similar derivative position in any of the companies mentioned, and no plans to initiate any such positions within the next 72 hours. I wrote this article myself, and it expresses my own opinions. I am not receiving compensation for it (other than from Seeking Alpha). I have no business relationship with any company whose stock is mentioned in this article.
Seeking Alpha's Disclosure: Past performance is no guarantee of future results. No recommendation or advice is being given as to whether any investment is suitable for a particular investor. Any views or opinions expressed above may not reflect those of Seeking Alpha as a whole. Seeking Alpha is not a licensed securities dealer, broker or US investment adviser or investment bank. Our analysts are third party authors that include both professional investors and individual investors who may not be licensed or certified by any institute or regulatory body.