An Update On A Bullish Indicator With A Perfect Track Record

Summary
- I alerted readers that the S&P 500 had triggered a Breakaway Momentum buy signal in January of this year.
- That infused confidence in my fundamental outlook for a soft landing and new bull market this year.
- This is an update on how the buy signal has performed to date and what it says about the next six months.
- This idea was discussed in more depth with members of my private investing community, The Portfolio Architect. Learn More »

phive2015
I predominantly focus on fundamentals and the rates of change in the economic data to formulate my outlooks for the market and economy. Fundamentals were the basis for my expectation at the beginning of this year that we would realize a soft landing and new bull market during 2023. That said, it is nice to see technical developments in the marketplace support one’s fundamental outlook. I have discussed many in my Daily Briefs as this year has progressed, and nearly all have been bullish, but the most bullish of all was triggered on January 12. I considered it to stand out more than any other indicator because of its astounding track record. This report is an update on its progress after six months.
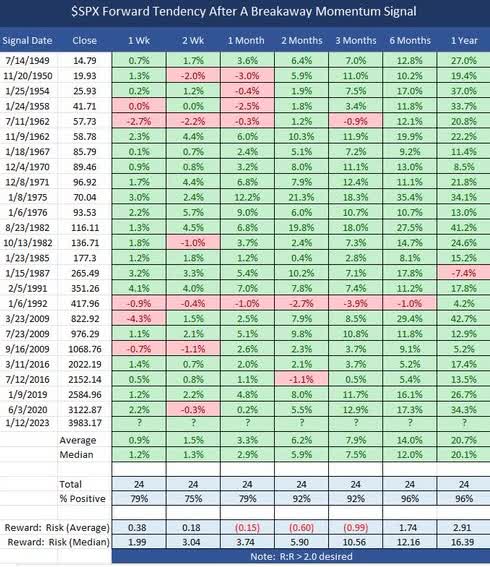
Market breadth is the focus of this technical indicator. Breadth is a measurement of how many stocks within an index are participating to the upside when the index is rising. On January 12, a Breakaway Momentum buy signal was triggered, which is an indicator crafted by esteemed technician Walter Deemer. It is rare, because it requires the ratio of advancing to declining stocks on the NYSE to exceed 1.97 over a ten-day period. It has only happened 24 times since 1945, and it was triggered for a 25th time in January when the S&P 500 closed at 3,898.
TheStreet
The shorter time frames, as seen in the chart above, have lower probabilities of positive returns after the trigger, but they are still impressive. This time was no different, as three of the five time periods noted above were positive.
One-week return was -2.13%
Two-week return was +1.93%
One-month return was +2.46%
Two-month return was -1.63%
Three-month return was +3.06%
The returns have been positive 96% of the time for the six- and 12-month time periods from the time of the trigger. Therefore, it came as no surprise that we logged a positive return for the S&P 500 yesterday. With the index closing at 4,472 it is up 14.7% from the day Breakaway Momentum was triggered. That is right in line with the six-month average of 14% for the previous 24 times we had a buy signal from this indicator. If we look out another six months, the 12-month average return has been just over 20%. That would take us to approximately 4,677 and approaching a new all-time high.
Another aspect of historical performance that falls in line with this indicator is that it seems all but assured that July’s rate hike by the Fed will be its last. According to Barclays research, the S&P 500 has averaged a gain of 10% in the 12-month period following the final rate hike of a rate-hike cycle. The problems for the market arise when the Fed starts to cut rates, because those cuts are obviously intended to address economic weakness that today does not appear to be an issue in the near future. A 10% rally from current levels would put us near the 4,900 level and at a new all-time high, which is consistent with my recent proclamation on June 26 that we would see a new all-time high for the index in the coming 12-months.
The rates of change in economic data, led by inflation, started to turn favorable last summer and fall. The market gave us confirmation of that fact at the beginning of this year through indicators like Walter Deemer’s Breakaway Momentum. Now we have confirmation that the bull market for the S&P 500 did begin last October, and the rally has started to broaden. The average stock has significantly outperformed over the past six weeks, and that should continue as we begin the earnings season for the second quarter. Enjoy the ride!
Lots of services offer investment ideas, but few offer a comprehensive top-down investment strategy that helps you tactically shift your asset allocation between offense and defense. That is how The Portfolio Architect compliments other services that focus on the bottom-ups security analysis of REITs, CEFs, ETFs, dividend-paying stocks and other securities.
This article was written by

Lawrence is the publisher of The Portfolio Architect. He has been managing portfolios for individual investors for 30 years, starting his career as a Financial Consultant in 1993 with Merrill Lynch and working in the same capacity for several other Wall Street firms before realizing his long-term goal of complete independence when he founded Fuller Asset Management. In addition to writing for Seeking Alpha, he is also a Leader on the new fintech platform at Follow.co.
Analyst’s Disclosure: I/we have no stock, option or similar derivative position in any of the companies mentioned, and no plans to initiate any such positions within the next 72 hours. I wrote this article myself, and it expresses my own opinions. I am not receiving compensation for it (other than from Seeking Alpha). I have no business relationship with any company whose stock is mentioned in this article.
Lawrence Fuller is the Principal of Fuller Asset Management (FAM), a state registered investment adviser. Information presented is for educational purposes only intended for a broad audience. The information does not intend to make an offer or solicitation for the sale of purchase of any specific securities, investments, or investment strategies. Investments involve risk and are not guaranteed. FAM has reasonable belief that this marketing does not include any false or material misleading statements or omissions of facts regarding services, investment, or client experience. FAM has reasonable belief that the content as a whole will not cause an untrue or misleading implication regarding the adviser’s services, investments, or client experiences. Past performance of specific investment advice should not be relied upon without knowledge of certain circumstances or market events, nature and timing of investments and relevant constraints of the investment. FAM has presented information in a fair and balanced manner. FAM is not giving tax, legal, or accounting advice. Mr. Fuller may discuss and display charts, graphs, formulas, and stock picks which are not intended to be used by themselves to determine which securities to buy or sell, or when to buy or sell them. Such charts and graphs offer limited information and should not be used on their own to make investment decisions. Consultation with a licensed financial professional is strongly suggested. The opinions expressed herein are those of the firm and are subject to change without notice. The opinions referenced are as of the date of publication and are subject to change due to changes in market or economic conditions and may not necessarily come to pass.
Seeking Alpha's Disclosure: Past performance is no guarantee of future results. No recommendation or advice is being given as to whether any investment is suitable for a particular investor. Any views or opinions expressed above may not reflect those of Seeking Alpha as a whole. Seeking Alpha is not a licensed securities dealer, broker or US investment adviser or investment bank. Our analysts are third party authors that include both professional investors and individual investors who may not be licensed or certified by any institute or regulatory body.
Recommended For You
Comments (3)

Another compelling data point is the fact that forward 5 year ( and beyond ) market returns have been decent after the occurrence of an "all time high" ( SP500). Looking at the returns matrix for such events, we see that, since 1931, 94% of 5 year periods ( 51 occurrences ) produced a positive return starting the subsequent year after the all time high occurred https://tinyurl.com/3pwnahtt
