Gilead: Assessing How Shares Will Trade Over Upcoming Months (Technical Analysis)

Summary
- Gilead Sciences' 12-month dividend growth rate of 2.8% is behind the inflation rate, suggesting a negative real return over the next year.
- The company's shares have failed to surpass their 2015 highs and have moved below their 10-month moving average, indicating a potential 12%+ drop from the current share price.
- Despite Gilead's above-average dividend, muted growth rates have negatively impacted the share price, and technical indicators suggest lower prices over the near term.
ismagilov
Intro
We wrote about Gilead Sciences, Inc. (NASDAQ:GILD) back in March of this year when we stated that the company needed to do more with respect to its dividend growth curve. Since that commentary roughly 20 weeks ago, Gilead's total return comes in negative (-2.2%) when we include the two $0.75 quarterly dividend payments in March and June of this year.
Gilead's 12-month dividend growth rate for example of 2.8% comes in well behind the prevailing inflation rate which means that the expected forward-looking 'real return' (when we solely focus on the dividend) is actually expected to be negative over the next 12 months. This premise may take investors by surprise especially considering Gilead's above average now almost 4% dividend yield on offer. However, in times of high inflation, it is all about tracking real gains and not nominal gains as the US dollar continues to lose its purchasing power at an accelerated rate.
Suffice it to say, given that dividends have contributed close to half of the S&P's total return over the past century or so, long-term investors are acutely aware that a strong sustainable dividend is crucial in portfolios with long-term horizons. If this is absent, the investor must solely rely on share-price appreciation to maintain purchasing power. Therefore, let's go through how we view Gilead's technical charts at present to see if we can gain insights into where we believe shares of the drug manufacturer will trade over the next 12 months or so.
Long-Term Monthly Chart
From a long-term perspective, the two worrying developments in recent months have been the failure of shares to take out their 2015 highs in December of last year and the recent bearish down-move of shares below their 10-month moving average ($80.06). Although this is only a shot across the bow at this stage (Gilead remains in a bull market), it is imperative shares regain this support level as quickly as possible. The reason as we see below is that the majority of Gilead's underside support lies between approximately the $50 and $67 levels. In fact, in a best-case scenario assuming shares cannot recover their 10-month moving average promptly, even if shares were to successfully test support at approximately the $67 level, this would be a 12%+ drop from Gilead's current prevailing share price ($76.38).
Gilead Long-Term Chart (Stockcharts.com)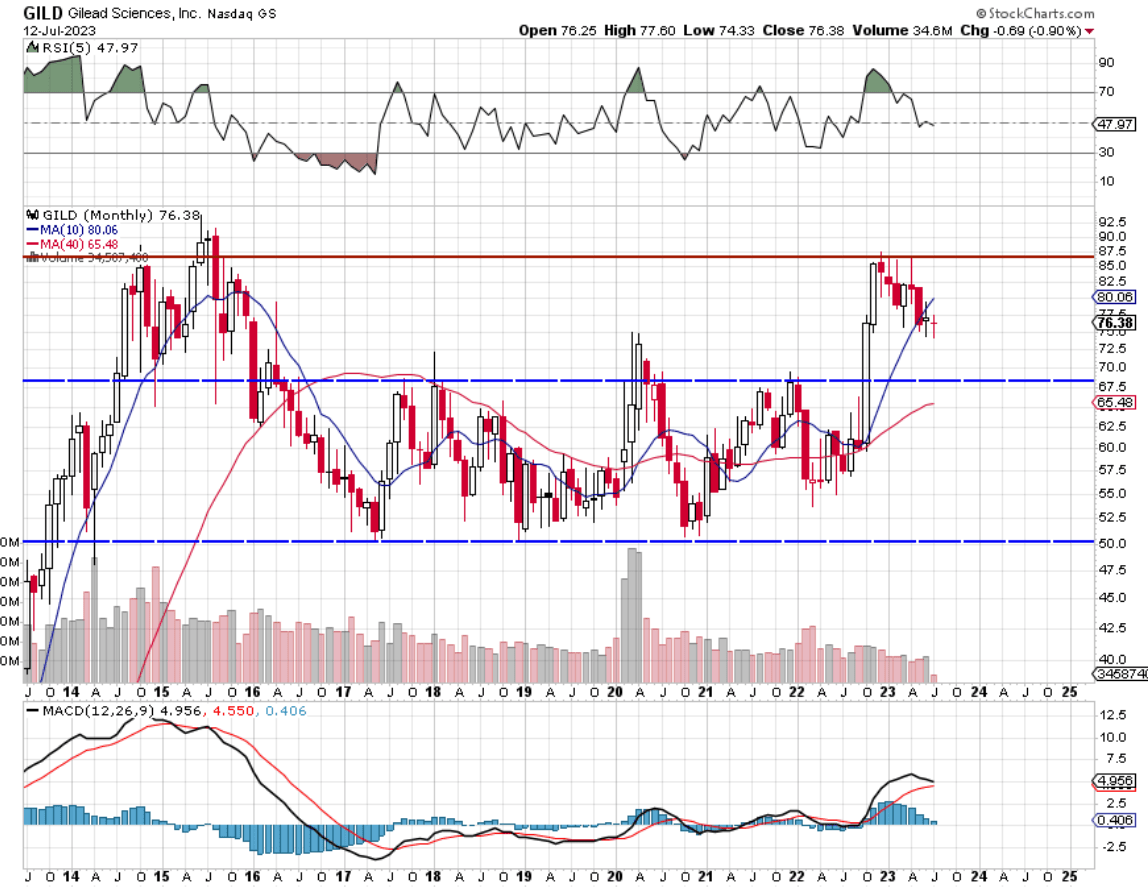
Intermediate 5-Year Chart
The concerns alluded to above are also evident on the intermediate 5-year weekly chart where we see a bearish crossover of Gilead's 10-week moving average below the stock's corresponding 40-week average. Therefore, investors need to be careful here given the fact that these intermediate crossovers have led to lower lows in past cycles as we see below. Furthermore, given how overbought the MACD indicator arrived at in December of last year, the pending intermediate downtrend could still have a ways to go here. Remember, the study of technical analysis revolves a lot around the whole area of human psychology. This means that if investors have liquidated their shares of Gilead on a bearish intermediate crossover (when shares were less oversold) in past cycles, there is a strong likelihood that the same will happen once more.
Gilead Intermediate Technicals (Stockcharts.com)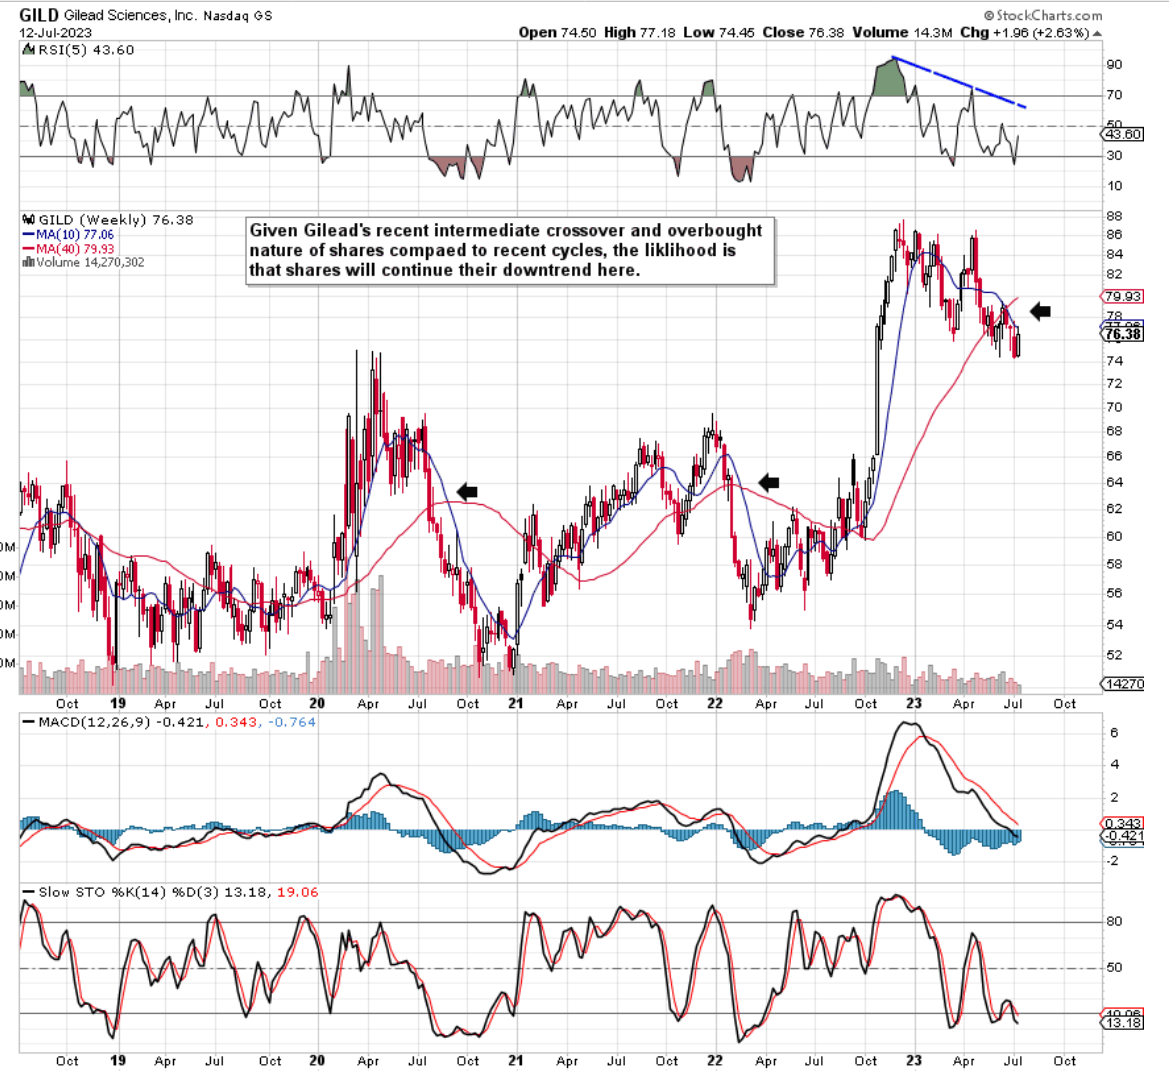
12-Month Daily Chart
As we see from Gilead's short-term chart below, the breaking of the depicted bullish trend-line was essentially caused by the company's recent Q1 earnings and probably more importantly, the dialing back of guidance for the full fiscal year. The breaking of the trend line took place on heavy selling and this selling volume has only increased in recent weeks which again points to lower prices over the near term. In fact, given the steeper slope of the OBV line (On-balance-Line) compared to Gilead's share-price action in recent weeks, and taking into account that volume trends precede share-price action, Gilead's short-term chart ties in with what we have seen in the stock's longer-term charts above.
Gilead Daily Chart (Stockcharts.com)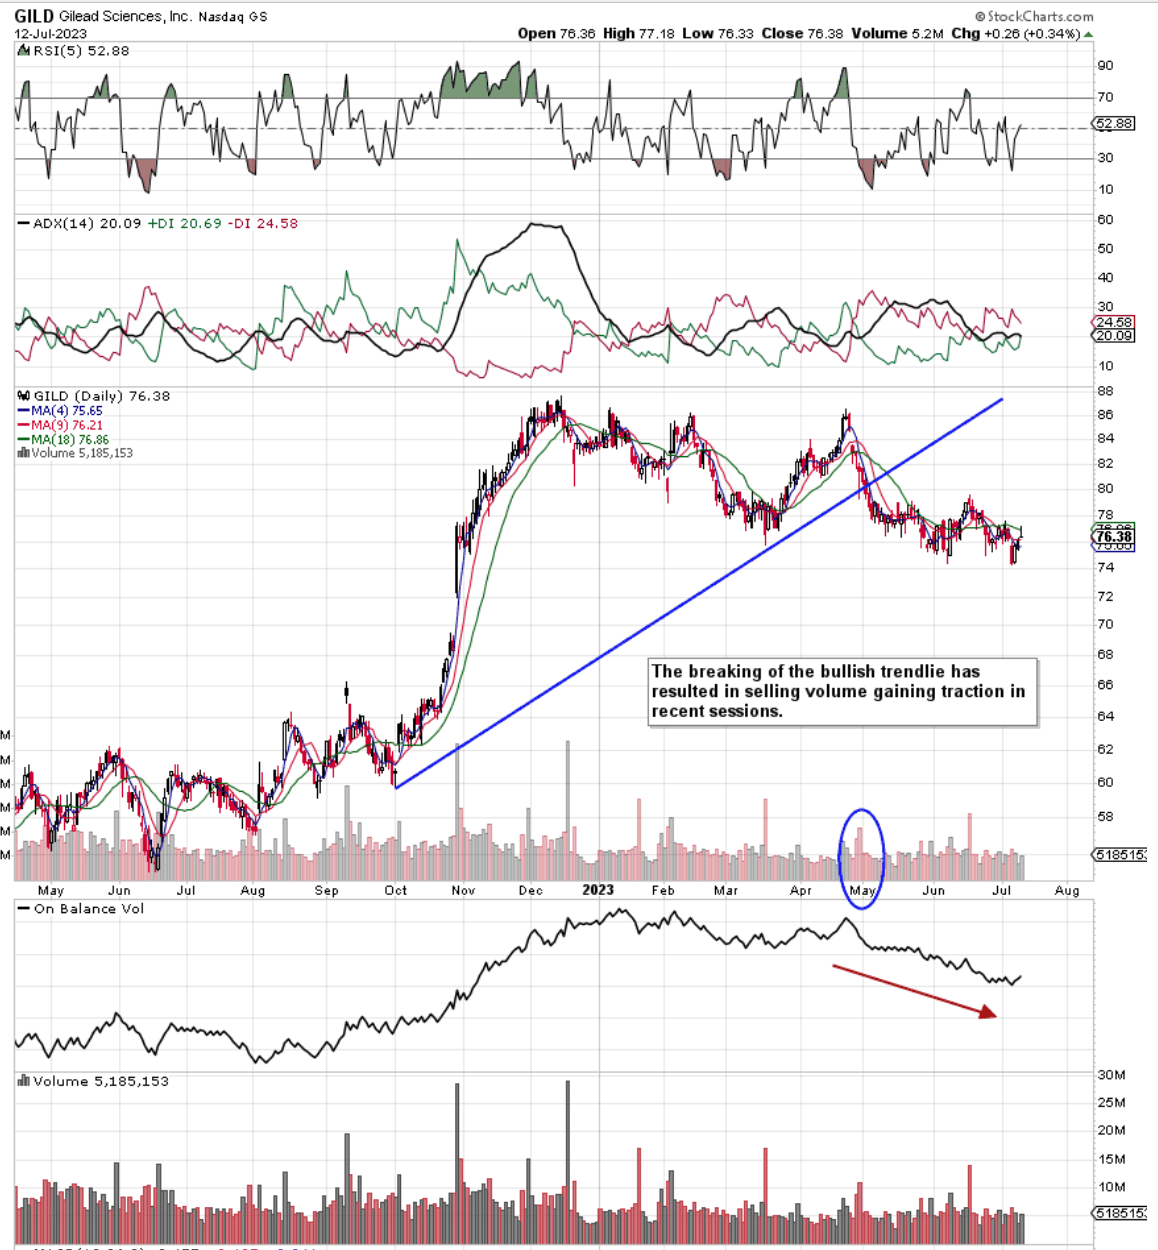
Conclusion
To sum up, although Gilead pays out an above-average dividend, growth rates remain muted and this has been impacting the share price in a negative way. As the technicals above demonstrate, we fear that Gilead may have to visit lower prices over the near term before shares finally print a hard bottom. We look forward to continued coverage.

Analyst’s Disclosure: I/we have no stock, option or similar derivative position in any of the companies mentioned, and no plans to initiate any such positions within the next 72 hours. I wrote this article myself, and it expresses my own opinions. I am not receiving compensation for it (other than from Seeking Alpha). I have no business relationship with any company whose stock is mentioned in this article.
Seeking Alpha's Disclosure: Past performance is no guarantee of future results. No recommendation or advice is being given as to whether any investment is suitable for a particular investor. Any views or opinions expressed above may not reflect those of Seeking Alpha as a whole. Seeking Alpha is not a licensed securities dealer, broker or US investment adviser or investment bank. Our analysts are third party authors that include both professional investors and individual investors who may not be licensed or certified by any institute or regulatory body.