TSLY: Is It The Ultimate Money Printer?

Summary
- The YieldMax TSLA Option Income Strategy ETF uses a synthetic covered call strategy.
- The TSLY ETF is expected to leave holders with considerable alpha due to the difference between its yield and expected NAV erosion.
- Distributions vary, but its most recent monthly payout of 6.32% translates to an annual rate of 75.32%.
- Its long-term NAV erosion can be mitigated through a variety of ways, and its volatility can be hedged.
- I currently rate TSLY a Buy.
matthiashaas
Thesis
I began paying attention to the YieldMax TSLA Option Income Strategy ETF (NYSEARCA:TSLY) back in February after they posted their second distribution. At the time, it was clear to me that this relatively new covered call ETF was going to pay an extremely attractive, yet variable dividend. However, because of the mechanics of how it generates income, I also knew that it was likely going to suffer from a long-term erosion of its Net Asset Value.
The fund is still relatively new, so Seeking Alpha's listed yield of 35.33% tells an incomplete story. The last several months of distributions extrapolates out to an annual yield of 59.44%, while this most recent monthly distribution translates to an annual yield of 75.32%.
After watching its behavior for several months now, it has become more clear that the difference between its yield and its NAV erosion is likely still going to leave holders quite pleased. For this reason, I still consider TSLY a Buy.
TSLY Overview (www.elevateshares.com/tsly)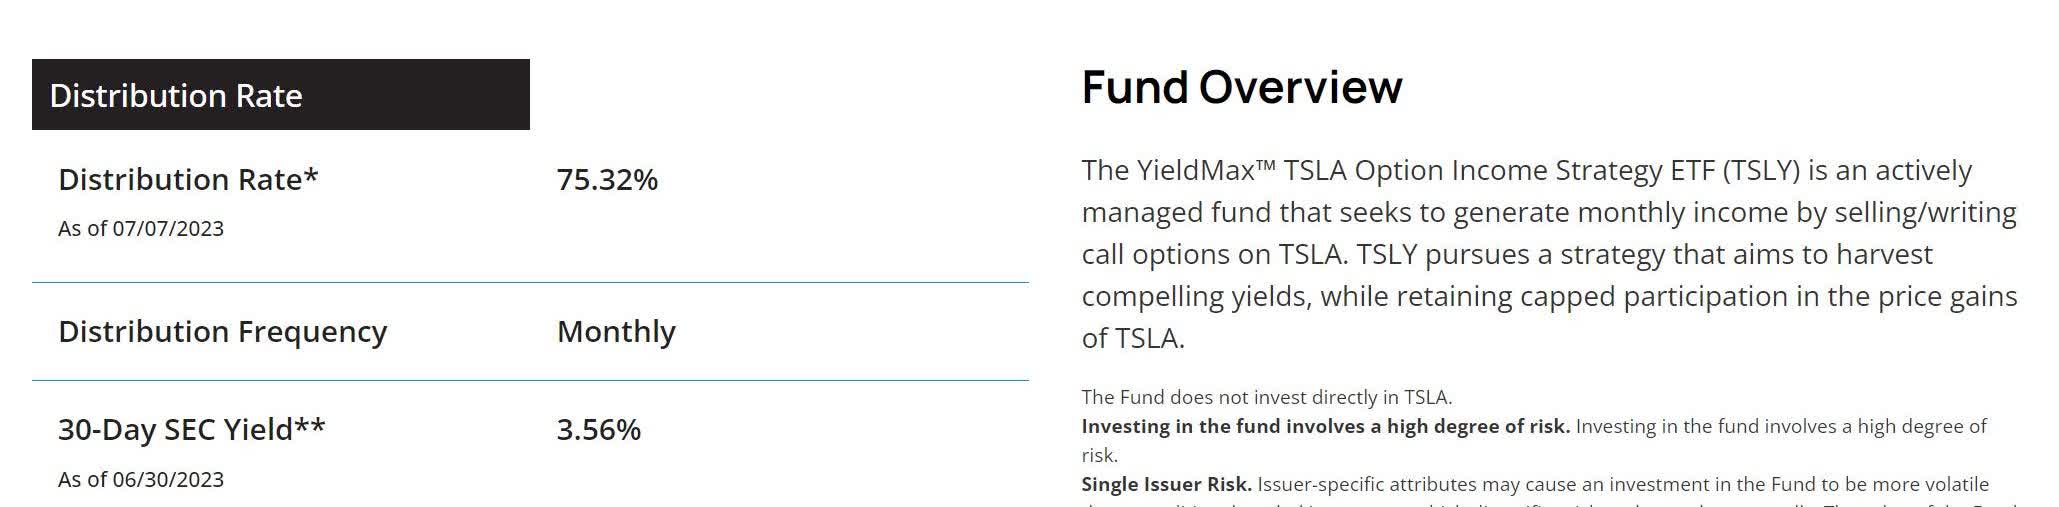
Fund Background
TSLY is part of the Yieldmax family of funds. Their exchange-traded funds, or ETFs, all charge a 0.99% gross expense ratio and use a synthetic covered call strategy on a single ticker. By selling a put and buying a call at the same strike price, they can take on a position whose value moves the same as if they owned 100 shares. This is frequently referred to as a synthetic long position.
They then sell monthly calls that are 5-15% out of the money, which are covered by the calls that they are already long. This means this type of fund is taking on significant risk from exposure to the volatility of the underlying asset. However, at the same time it is also harvesting income from that same volatility.
While I cannot predict with very much certainty if its underlying, Tesla, Inc. (TSLA) is going up or down at any given time, I have conviction that people will continue to argue about it for years to come. This elevated level of attention that Tesla receives directly translates to increased volatility and higher options premiums. This means that when someone sets up a fund like this on a high volatility ticker like TSLA, the expected average yields one can achieve can be eye-popping.
Holdings
The strategy the fund employs requires it to hold a significant amount of cash on hand as a cushion for margin calls. Instead of holding cash, the fund stores most of its wealth in treasuries. I should also note that the fund typically carries only a minuscule cash position, so the 8.81% shown here is probably in the middle of being re-tasked. As far as I can tell, this list of holdings is updated daily.
TSLY Holdings (www.elevateshares.com/tsly)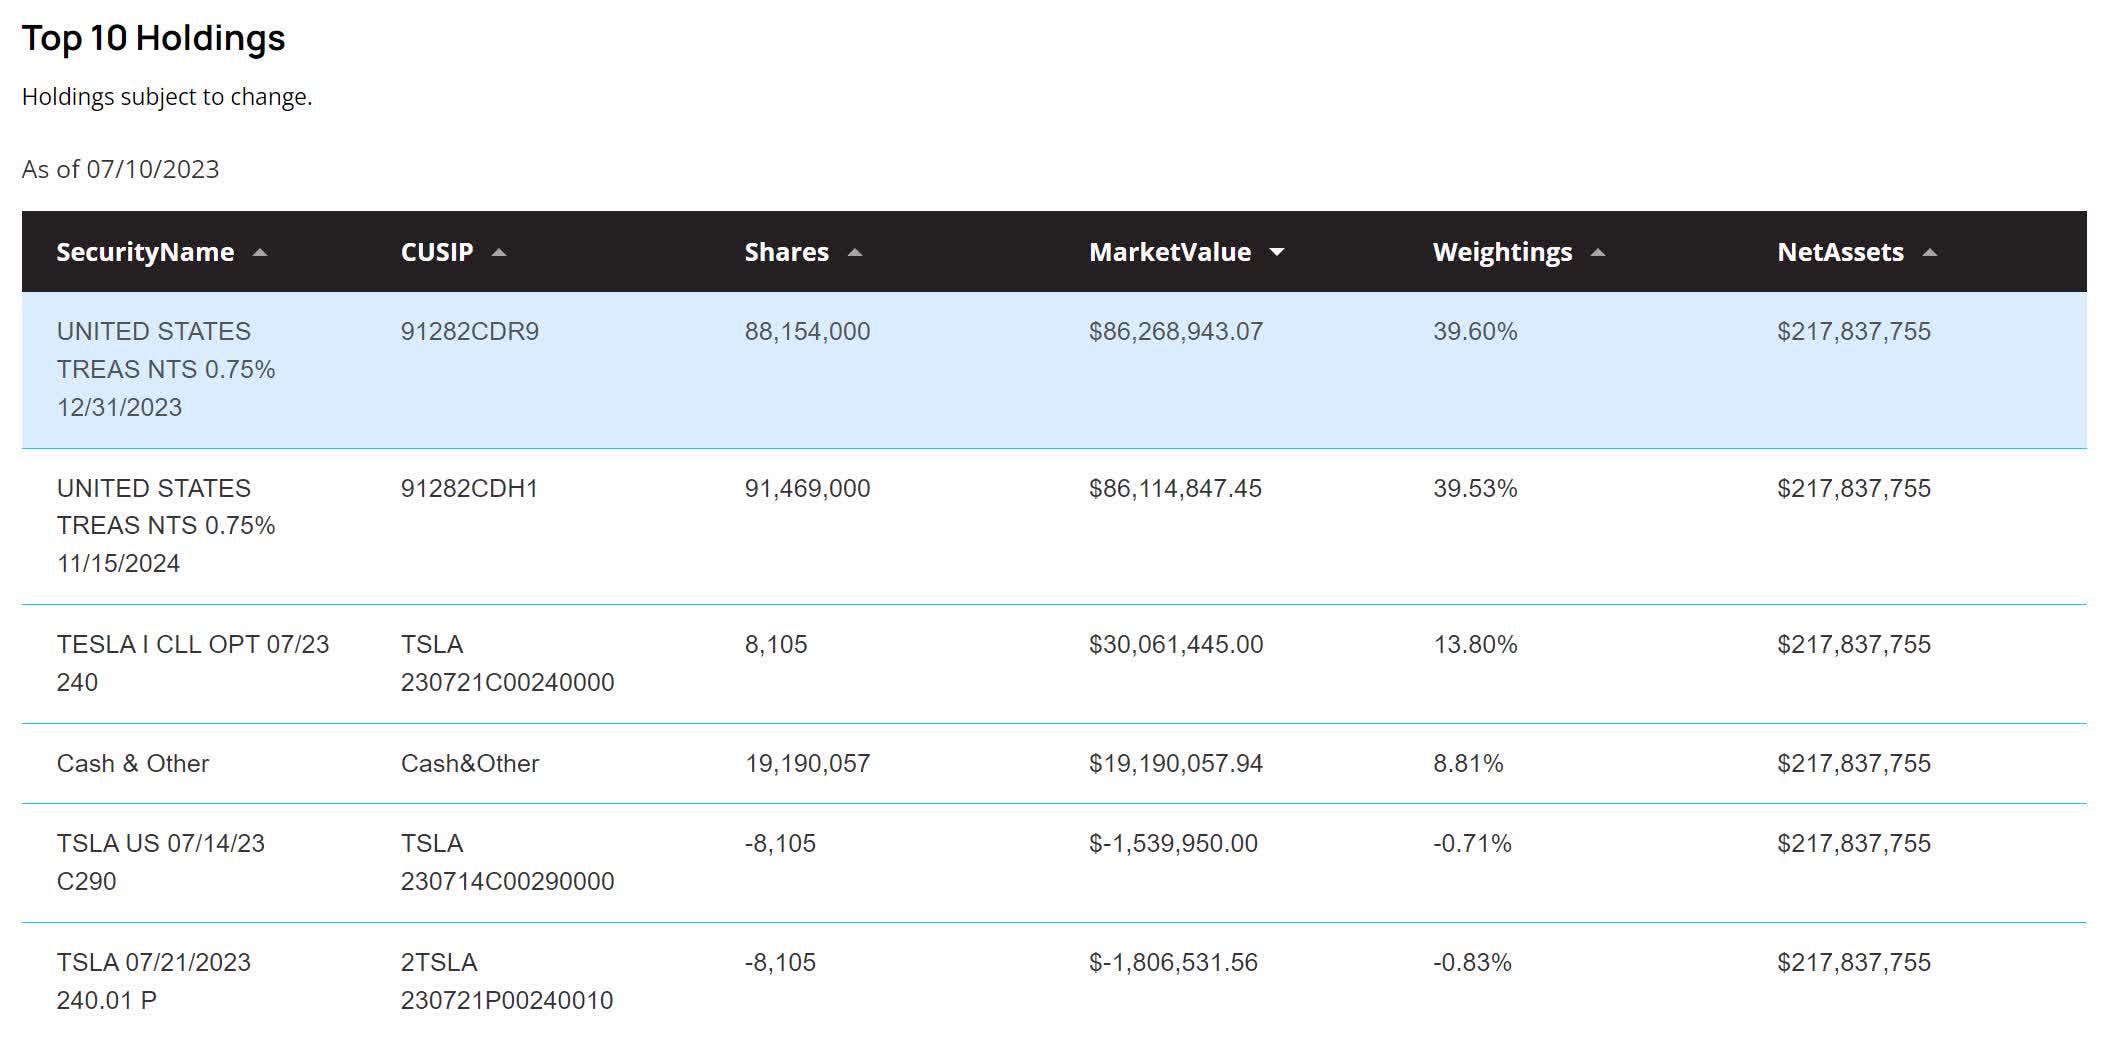
Distributions
These distribution payouts are almost too good to be believed. While this most recent monthly payout currently translates to a 75.32% annual rate, this rate varies significantly. My initial estimates in February were that the fund would regularly pay somewhere in the 40-60% range. The sum of their 7 distributions comes to $5.8463 per share. This produces an average of $0.8352 per distribution; at today's share price of $16.86, this comes to an average annual yield of 59.44%.
TSLY Distributions (www.elevateshares.com/tsly)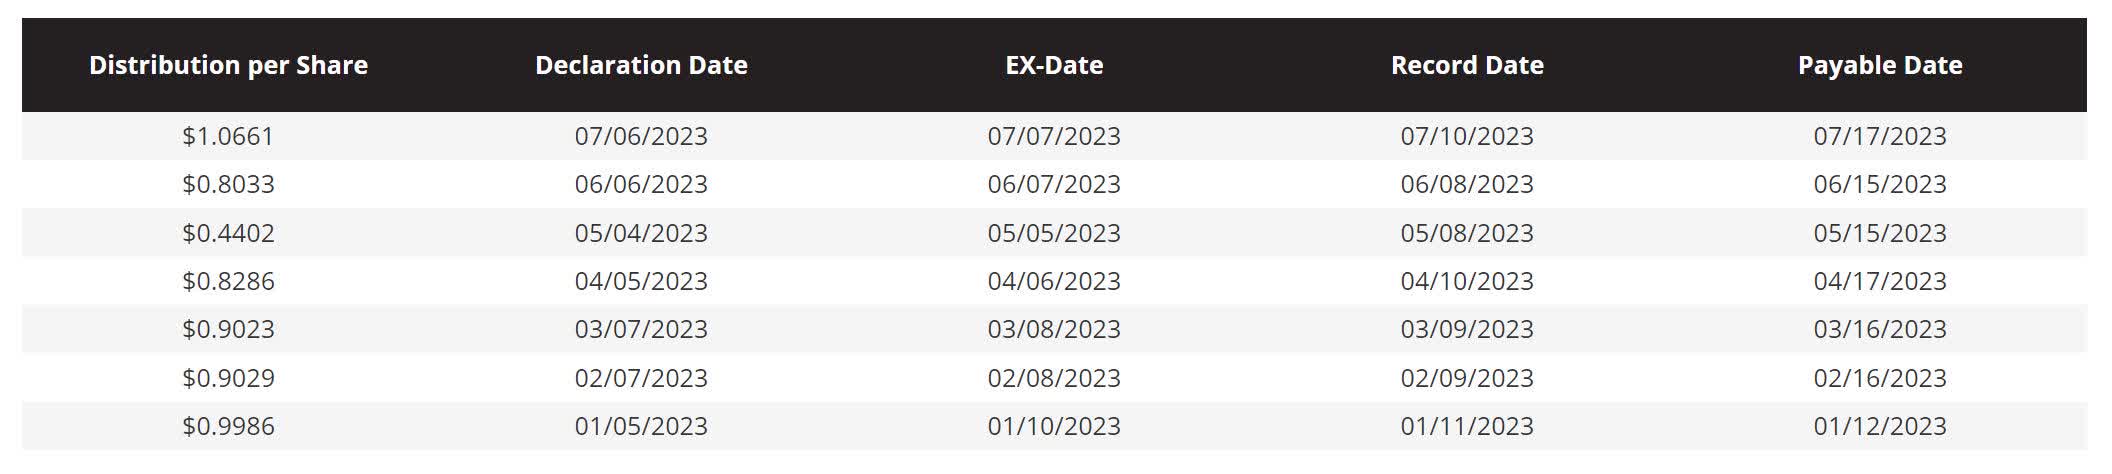
NAV Erosion
The reason most people avoid high yield is because often the payments are unsustainable over long time frames. This becomes especially true for companies in the later portions of their business life cycle. Newer investors are often drawn into yield traps without looking at the long term health of the dividend. However, this is not typically the problem with covered call ETFs.
So far, TSLY has done well when compared to most other ETFs. Here we can see TSLY outpacing the S&P 500 (SP500) by 4.29%. However, this does not tell a complete story. The long-term value of TSLY is dependent on the price action of TSLA. The only reason TSLY has been doing well is because TSLA has been doing well.
TSLY NAV Erosion (www.elevateshares.com/tsly)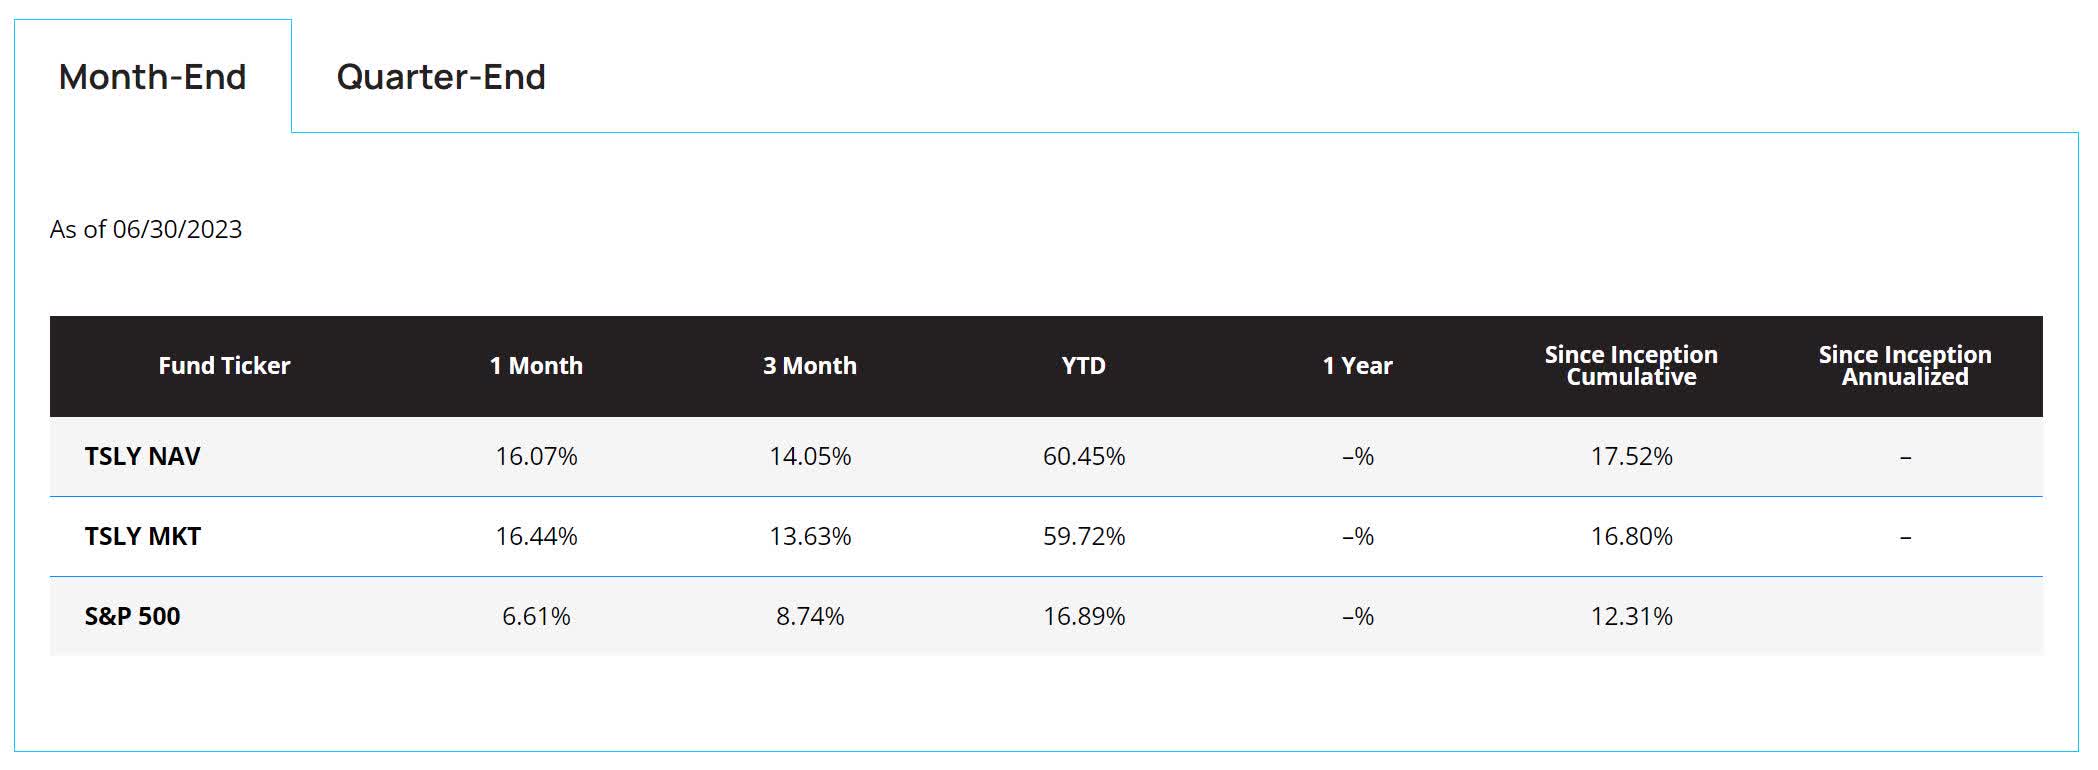
Because they sell calls against their long position, covered call ETFs limit their upside potential during large rallies. So while they will maintain fairly strong correlation during rangebound markets, and markets that are only going up slowly, they fall out of correlation during violent rallies. At the same time, they still experience full exposure to the risk of their underlying going down. This means that they share losses with their underlying, and yet also occasionally miss out on gains.
Since mid-April, TSLA has gone up by 55.18% while TSLY has only gone up 12.2%. By this measure, TSLY's share price has underperformed TSLA by 42.98%. This does not include the $3.54 per share of distributions TSLY has paid over this time period. If those are included, TSLY's share price of $16.86 would be roughly $20.40, or 20.99% higher. This means when looking at it on a total returns basis, it's only lagging TSLA by roughly 22%.
TSLY vs TSLA Long Term Correlation (www.elevateshares.com/tsly)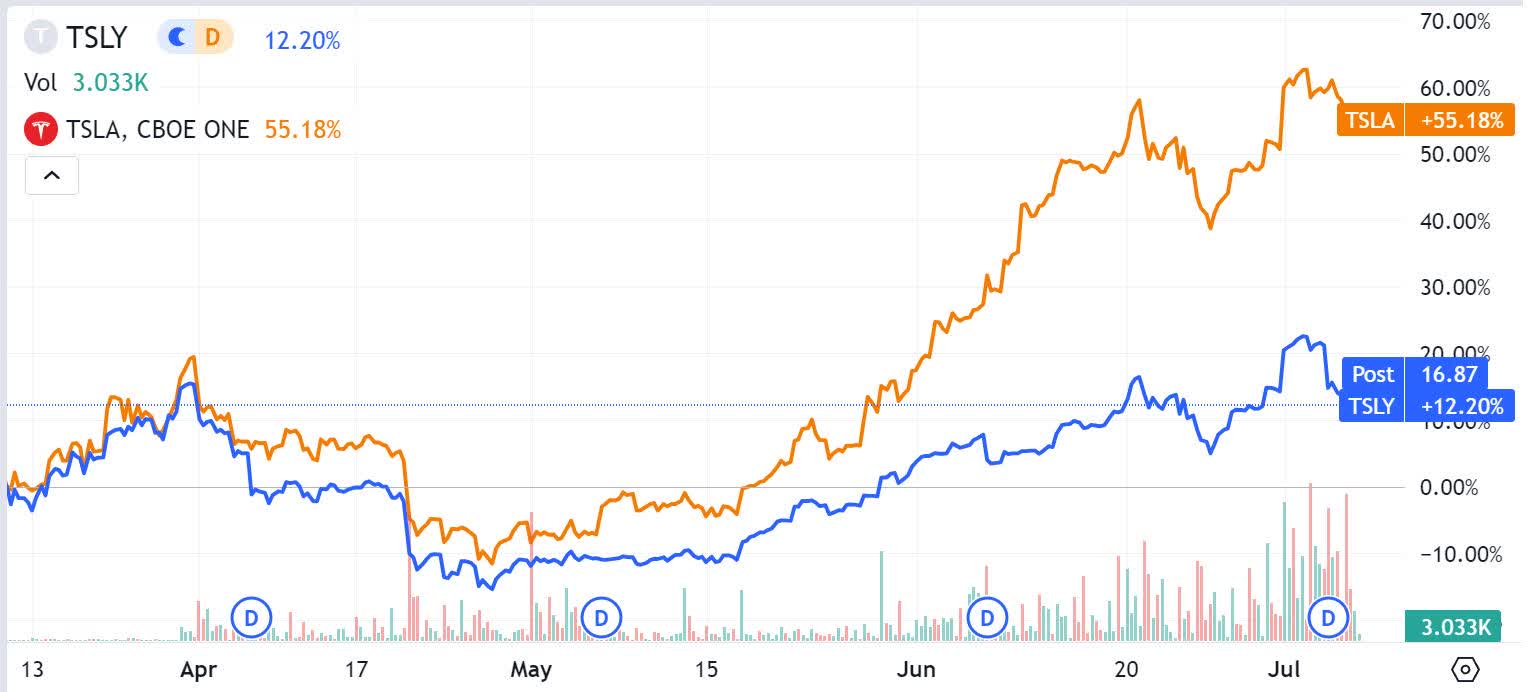
Here we can see the two assets are highly correlated over shorter time frames. In addition to missing out on portions of violent rallies, the other source of TSLY's long term price degradation results from their payouts. I should note that during the decline below, TSLA dropped by 9.17%, while TSLA dropped by 14.67%. When the two shown dividend payments are added back in, $1.27 is added to their May 16th share price of $13.43. This comes to $14.70 per share, so instead of a 14.67% drop, TSLY shareholders experienced a loss from their March 20th closing price ($15.67) of only 6.19%.
TSLY vs TSLA Short Term Correlation (Tradingview via Seeking Alpha)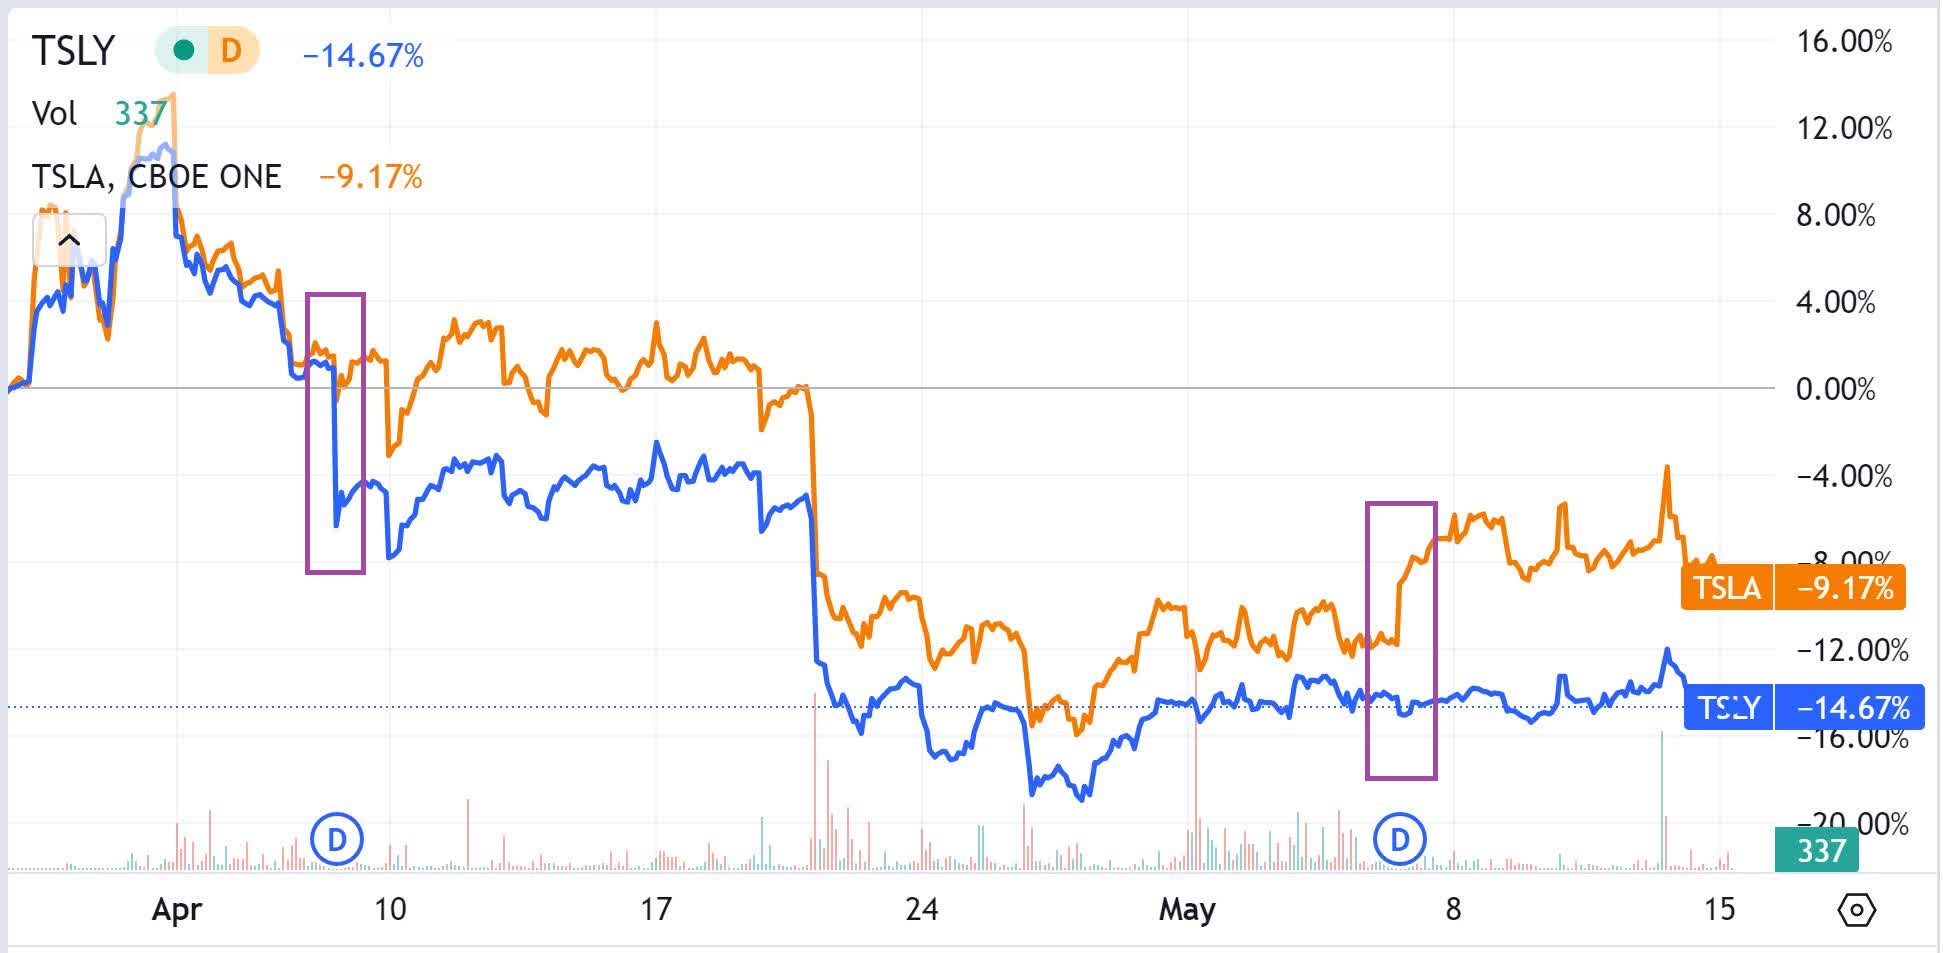
TSLY missed out on a portion of the significant gains TSLA achieved over the last several months. However, the last several months have not been typical. Because of the nature of their covered call strategy, TSLY should outperform TSLA any time it's ranging sideways, dropping, or merely rising slowly. This means most of TSLY's long term NAV erosion will be the result of missing out on TSLA gains during violent rallies. Understanding when and why it degrades in value allows us to better mitigate the erosion.
If you scroll up you will see that the fund is currently selling TSLA calls with strikes at $290 that expire on July 14th. This means that on or before the 14th, they will be looking to sell a new batch of calls that expire between a week and a month further out. Every time they sell a new batch of calls, they set a new ceiling for TSLY's potential gains over the short-term. This known ceiling can be taken advantage of in several ways.
Mitigating The Erosion
Before I start talking about options strategies that we can employ, I need to remind readers that options carry their own unique risk profiles. The value of an options contract changes according to several different variables. The rate of change of these variables is non-linear.
It is incredibly important that you understand all of the mechanics behind their changes in value before entering an options trade. I frequently compare options trading to trying to negotiate a left hand turn during heavy traffic and bad weather, those with experience are going to understand that traction is lower, brakes don't work as well, other drivers can't see as well, etc. Inexperienced drivers who do not account for the altered driving conditions are likely to end up in a collision. I cannot count the number of people I have talked to who didn't fully understand what they were doing, and then lost most of their account value within their first 6 months of options trading.
You can sell covered calls on your TSLY position. By measuring the proportional difference between the current share price of TSLA to the strike price of the calls they sold, the maximum gain TSLY can experience over that time frame can be estimated. This means calls can be sold above that estimate without very much risk of being exercised.
In addition to selling calls, you can buy TSLY puts with a strike above the current share price. This removes your delta exposure and was the method I was recommending in the first article I wrote on TSLY. I was paying for a portion of the put by selling a call, forming an options collar.
You can buy TSLA call options at the same strike price and expiration they sold at. Since this is where the yield comes from, doing this should essentially cancel out the distributions. If you instead chose strikes that are above their chosen strikes, you should still be able to harvest some of the gains that TSLY misses out on while still keeping most of each distribution.
Instead of trying to match the time frames that Yieldmax operates on, you can take a small portion of your distributions every months and buy far out of the money TSLA calls with much longer time frames. While taking a small portion of your monthly distribution and buying calls is fairly straightforward, this comes with the problem of having to time selling at tops.
For each TSLA call you buy, you can also sell a call at a higher strike. Entering a spread like this caps your maximum gains. Since the call you are buying is a mitigation method, keeping it cheap is advisable.
You can allocate a portion of each distribution to buying more TSLY. While I cannot produce a fixed estimate for its future annual NAV erosion, I expect the 59.44% average annual yield I calculated to be well above it. We can ask ourselves: Instead of owning an asset that pays almost 60% yield and goes down, would you be happier with one that pays 40% and trades sideways? How about one that pays 30% and grows? Or pays 10% and grows significantly. We can chose to treat the especially fat yield as a maximum and use it to take partial control over the growth rate of the asset.
Ways To Hedge TSLY
Before we cover ways to hedge TSLY, I must include a warning. Leveraged ETFs are notorious for experiencing value degradation over longer time periods. This is because they are designed to perform in specific ways compared to the daily performance of their underlying, enough investors have misunderstood or misjudged this long-term degradation that FINRA and the SEC have both issued warnings. Because of their value erosion, it is incredibly unwise to be long a leveraged ETF over longer timeframes. Fortunately for us, one of the most efficient things we can do is to short a bullish leveraged ETF. This means instead of working against us, its long term value erosion will work in our favor.
Similar to my speech about options, the act of hedging only lowers risk if you actually understand what's going on. Assuming you set up your hedge correctly, the risk of infinite loss that comes with shorting should be canceled out by gains made on its paired inverse asset. If you fail to weight the two assets correctly, chose assets that are not strongly inversely correlated, or fail to also hedge the entire portfolio for the possibility of a black swan event, you may find yourself in an unexpected margin call. Anyone who is inexperienced with this, and wants to explore it further, should research Portfolio Theory. MIT OpenCourseWare has posted several excellent videos on this topic to YouTube.
TSLA has several other tickers that use it as their underlying, so TSLY's volatility can be hedged. The goal here is to take on a position that has an inverse correlation with TSLA's price action. There are several leveraged ETFs I can talk about here, but I am going to focus on just two.
TSLY vs. TSLS vs. TSLL (Tradingview via Seeking Alpha)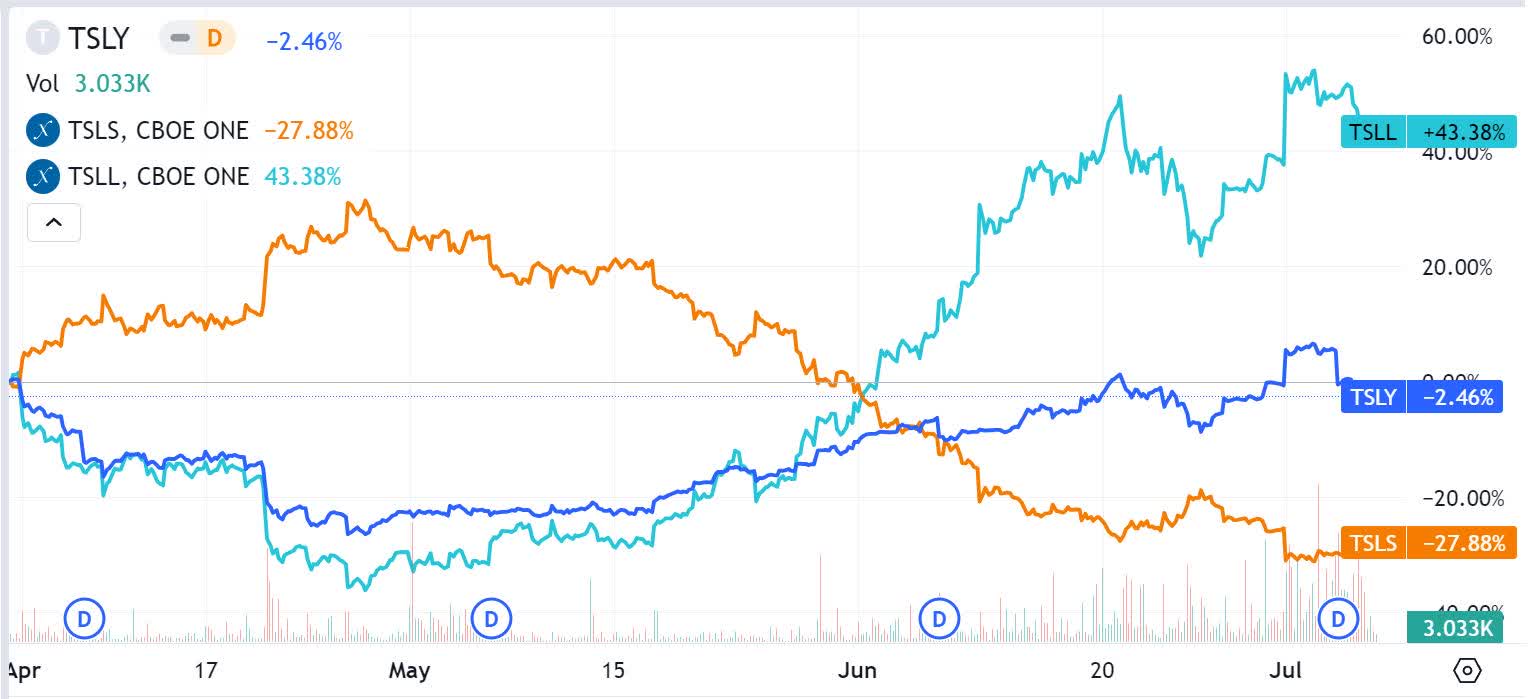
A position in TSLY can be hedged by purchasing Direxion Daily TSLA Bear 1X Shares (TSLS). With it being a bearish leveraged ETF that also uses TSLA as its underlying, its price action is also strongly correlated with TSLY. Any time TSLA goes down in value the gain one receives from TSLS has the potential to cancel out the losses TSLY experiences. This choice is not ideal because leveraged ETFs also suffer from long-term NAV erosion.
Far more appealing than going long in TSLS, a position in TSLY can be hedged by shorting Direxion Daily TSLA Bull 1.5X Shares (TSLL). This means its long-term NAV erosion works in your favor instead of against you. The NAV erosion will help mitigate the losses from the fees attached to holding borrowed shares. More important than benefiting from TSLL's NAV erosion, the act of entering a short position places cash back into your account. This grows your cash available to withdraw and adds to your cushion against margin calls.
Both of the positions described above would need to be rebalanced periodically. While hedging this way does not do much to help with long-term NAV erosion, it does reduce variance dramatically. Because its distributions are so large, TSLY is appealing for anyone wanting to run a high-yield, low-variance portfolio on margin. This will become more appealing after the Fed lowers interest rates back down.
Conclusions
The long-term fate of TSLY is tied to the long-term fate of TSLA. Personally, I think Tesla stock is currently overvalued, but I also think the company itself has a bright future. The one thing I can tell you with any confidence is that people will continue to argue over the future price action of TSLA for years to come. It's this disagreement that TSLY owners are investing in, not TSLA. This means that while each upcoming TSLA earnings report is very likely going to move the price of both TSLA and TSLY, each individual report is unlikely to significantly affect long-term volatility. In fact, each TSLA earnings report causes a period of elevated implied volatility, and so those months are more likely to produce higher distributions.
TSLY investors looking to build a position should consider watching the valuation of TSLA closely. Dollar cost averaging, while also adding to TSLY more heavily during periods when TSLA is in relative undervaluation, should lead to attractive results over the long-term. Tesla's next earnings report comes out next week. Each earnings report has the potential to produce a dip in share price, each dip is a potential buying opportunity.
Overall, I feel this ticker has characteristics that make it appealing to a variety of different types of investors. If TSLA ever falls into a place where I believe it is undervalued, it will be very difficult to justify not entering as large of a TSLY position as I can afford. I do not currently own a position in YieldMax TSLA Option Income Strategy ETF, but have sniped its distribution several times since it began trading, and will continue keeping a close eye on it.
This article was written by

Analyst’s Disclosure: I/we have no stock, option or similar derivative position in any of the companies mentioned, and no plans to initiate any such positions within the next 72 hours. I wrote this article myself, and it expresses my own opinions. I am not receiving compensation for it (other than from Seeking Alpha). I have no business relationship with any company whose stock is mentioned in this article.
Seeking Alpha's Disclosure: Past performance is no guarantee of future results. No recommendation or advice is being given as to whether any investment is suitable for a particular investor. Any views or opinions expressed above may not reflect those of Seeking Alpha as a whole. Seeking Alpha is not a licensed securities dealer, broker or US investment adviser or investment bank. Our analysts are third party authors that include both professional investors and individual investors who may not be licensed or certified by any institute or regulatory body.