FDL: Underperforming In 2023

Summary
- First Trust Morningstar Dividend Leaders Index Fund ETF invests in 100 U.S. companies with sustainable dividends.
- The FDL ETF is diversified across sectors, but quite concentrated in the top holdings.
- Valuation looks attractive, but quality is inferior to the benchmark.
- The fund has lagged some of its competitors in 2023.
- Quantitative Risk & Value members get exclusive access to our real-world portfolio. See all our investments here »
sasirin pamai
This article series aims at evaluating ETFs (exchange-traded funds) regarding past performance and portfolio metrics. Reviews with updated data are posted when necessary.
FDL strategy and portfolio
First Trust Morningstar Dividend Leaders Index Fund ETF (NYSEARCA:FDL) started investing operations on 3/9/2006 and tracks the Morningstar® Dividend Leaders IndexSM. It has 100 holdings, a 12-month distribution yield of 4.58%, and an expense ratio of 0.45%. Distributions are paid quarterly.
As described by First Trust, eligible stocks must be listed in the U.S. Companies are excluded if they have: non-qualifying income dividends (in particular real estate investment trusts, or REITs), a negative 5-year dividend growth, or a projected payout ratio above 100%. Eligible stocks are ranked by dividend yield, and the top 100 are selected in the index. Constituents are weighted based on the dollar value of indicated dividends, with a limit of 10% by constituent, and 50% in aggregate for constituents above 5%. The index is rebalanced quarterly and reconstituted annually.
The fund is mostly invested in large companies (about 70% of asset value). The heaviest sector is financials (22.6%), followed by energy (17.8%), healthcare (14.8%) and consumer staples (12.9%). Other sectors are below 10% individually and 32% in aggregate. Compared to the S&P 500 (SP500), FDL massively overweights financials, energy, consumer staples and utilities. It underweights mostly technology, consumer discretionary and industrials. It ignores real estate because REITs are not eligible.
Sector breakdown (chart: author; data: First Trust, SSGA)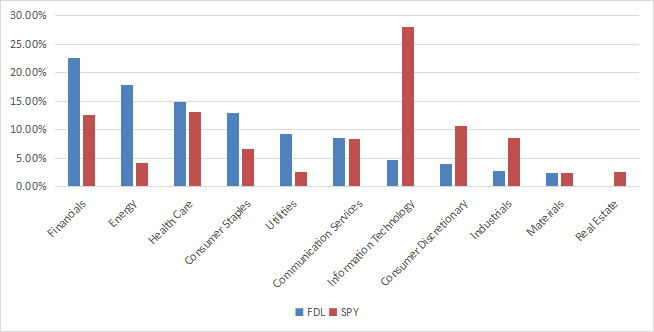
The top 10 holdings, listed in the next table with weights and fundamental ratios, have an aggregate weight of 56%, and each of the top 3 is above 8%. The portfolio is very concentrated, and exposure to risks related to the heaviest constituents is significant.
Ticker | Name | Weight | EPSgrowth %ttm | P/E ttm | P/E fwd | Yield% |
Verizon Communications, Inc. | 8.48% | -0.20 | 6.79 | 7.47 | 7.49 | |
Chevron Corp. | 8.29% | 73.94 | 8.63 | 11.82 | 3.78 | |
AbbVie, Inc. | 8.11% | -39.11 | 31.78 | 12.28 | 4.39 | |
Pfizer Inc. | 6.65% | 16.43 | 7.09 | 10.80 | 4.56 | |
Philip Morris International, Inc. | 6.56% | -3.12 | 17.69 | 15.89 | 5.13 | |
Altria Group, Inc. | 5.30% | 89.63 | 14.67 | 9.18 | 8.23 | |
International Business Machines Corp. | 4.68% | -67.77 | 67.67 | 14.09 | 5.00 | |
Citigroup, Inc. | 2.99% | -15.52 | 6.61 | 7.94 | 4.31 | |
3M Co. | 2.60% | 0.48 | 10.53 | 11.80 | 5.91 | |
Pioneer Natural Resources Co. | 2.55% | 72.11 | 7.65 | 10.68 | 10.95 |
Ratios from Portfolio123.
FDL is much cheaper than the S&P 500 regarding valuation ratios, as reported in the next table. A note of caution, though: valuation is biased by the heavy weight of financials, where these metrics are lower, and unfortunately much less reliable than in other sectors.
FDL | SPY | |
Price/Earnings TTM | 9.91 | 22.83 |
Price/Book | 1.53 | 4.02 |
Price/Sales | 1.22 | 2.55 |
Price/Cash Flow | 7.03 | 16.12 |
Source: Fidelity.
Performance
FDL has underperformed SPY by 2.2 percentage points in annualized return since 4/1/2006. Moreover, risk measured in drawdown and standard deviation of monthly returns (volatility) is significantly higher. As reported in the next table, it is also behind a dividend benchmark, the SPDR S&P Dividend ETF (SDY).
Total Return | Annual.Return | Drawdown | Sharpe ratio | Volatility | |
FDL | 236.46% | 7.28% | -65.93% | 0.43 | 16.62% |
SPY | 380.47% | 9.51% | -55.19% | 0.58 | 15.65% |
SDY | 272.24% | 7.91% | -55.40% | 0.49 | 15.46% |
Data calculated with Portfolio123.
The next chart compares year-to-date total returns of FDL, SPY, SDY and three other U.S. large cap dividend funds:
- Schwab U.S. Dividend Equity ETF (SCHD)
- iShares Select Dividend ETF (DVY)
- First Trust Value Line Dividend Index Fund (FVD).
FDL is the worst performer of this group in 2023. This year, the S&P 500 is ahead of dividend funds by a wide margin.
FDL vs SPY and competitors, 2023 to date (Seeking Alpha)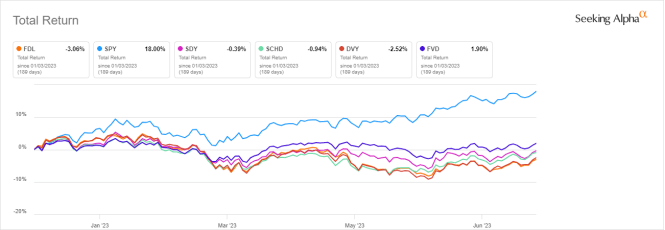
The annual sum of distributions has increased from $0.71 per share in 2012 to $1.31 in 2022. It represents an 84.5% growth in 10 years, beating by far the cumulative inflation: about 29%, based on CPI. It also beats the distribution growth rate of the dividend benchmark SDY in the same time frame (67.5%), but it is behind the broad benchmark SPY (103.9%).
In previous articles, I have shown how three factors may help cut the risk in a dividend portfolio: Return on Assets, Piotroski F-score, and Altman Z-score.
The next table compares FDL since 4/1/2006 with a subset of the S&P 500: stocks with an above-average dividend yield, an above-average ROA, a good Altman Z-score, a good Piotroski F-score and a sustainable payout ratio. The subset is rebalanced annually to make it comparable to a passive index.
Total Return | Annual.Return | Drawdown | Sharpe ratio | Volatility | |
FDL | 236.46% | 7.28% | -65.93% | 0.43 | 16.62% |
Dividend quality subset | 494.87% | 10.87% | -42.94% | 0.66 | 15.44% |
Past performance is not a guarantee of future returns. Data Source: Portfolio123.
FDL lags the dividend quality subset by 3.6 percentage points in annualized return, and shows a much deeper maximum drawdown. A note of caution: ETF performance is real and this subset is simulated. My core portfolio holds 14 stocks selected in this subset (more info at the end of this post).
Portfolio quality
FDL holds 100 stocks, of which 17 are risky regarding my metrics. These are stocks with at least two red flags among : bad Piotroski score, negative ROA, unsustainable payout ratio, bad or dubious Altman Z-score, excluding financials for which these metrics are unreliable. Risky stocks weigh 15.8% of asset value, which is not a good point.
According to my calculations, the aggregate quality metrics reported in the next table are lower than for the S&P500.
It points to a portfolio quality slightly inferior to the benchmark and to a significant deterioration since my review of February.
FDL | SPY | |
Atman Z-score | 2.11 | 3.53 |
Piotroski F-score | 5.5 | 5.71 |
ROA % TTM | 6.86 | 7.42 |
Takeaway
First Trust Morningstar Dividend Leaders Index Fund invests in U.S. companies with a positive 5-year dividend growth and a sustainable projected payout ratio. The portfolio is diversified across sectors, but it is quite concentrated in its top holdings. Valuation ratios look cheap, but aggregate quality metrics are inferior to S&P 500 averages. The fund has underperformed the S&P 500 since inception and shows a higher risk in drawdown and volatility. It has also lagged several of its competitors in 2023.
Quantitative Risk & Value (QRV) features data-driven strategies in stocks and closed-end funds outperforming their benchmarks since inception. Get started with a two-week free trial now.

This article was written by

Step up your investing experience: try Quantitative Risk & Value for free now (limited offer).
I am an individual investor and an IT professional, not a finance professional. My writings are data analysis and opinions, not investment advice. They may contain inaccurate information, despite all the effort I put in them. Readers are responsible for all consequences of using information included in my work, and are encouraged to do their own research from various sources.
Analyst’s Disclosure: I/we have a beneficial long position in the shares of PFE, PXD either through stock ownership, options, or other derivatives. I wrote this article myself, and it expresses my own opinions. I am not receiving compensation for it (other than from Seeking Alpha). I have no business relationship with any company whose stock is mentioned in this article.
Seeking Alpha's Disclosure: Past performance is no guarantee of future results. No recommendation or advice is being given as to whether any investment is suitable for a particular investor. Any views or opinions expressed above may not reflect those of Seeking Alpha as a whole. Seeking Alpha is not a licensed securities dealer, broker or US investment adviser or investment bank. Our analysts are third party authors that include both professional investors and individual investors who may not be licensed or certified by any institute or regulatory body.