QQQ: Party Like It's 1999

Summary
- The Nasdaq-100 index is experiencing its best year since 1999, but investors are warned to be cautious, as the recent tech rally may be built on shaky foundations.
- The index is currently trading at 26.67x expected earnings, significantly higher than the 10-year historical average of 20.5x, despite a record reversal in the yield curve and tightening credit conditions.
- We suggest that the current rally may be based on hope rather than solid fundamentals and recommends a "Sell" rating for the QQQ until macroeconomic conditions or underlying fundamentals improve.
peterschreiber.media
The Nasdaq-100 index (NASDAQ:QQQ) is enjoying its best first half of the year since 1999, leading us to wonder if there could still be some upside room left for the index. In short, while some market participants are celebrating like it's 1999 all over again, we believe that investors should certainly exercise some caution at current levels, as we believe this recent tech rally has been built on shaky foundations rather than supportive underlying fundamentals.
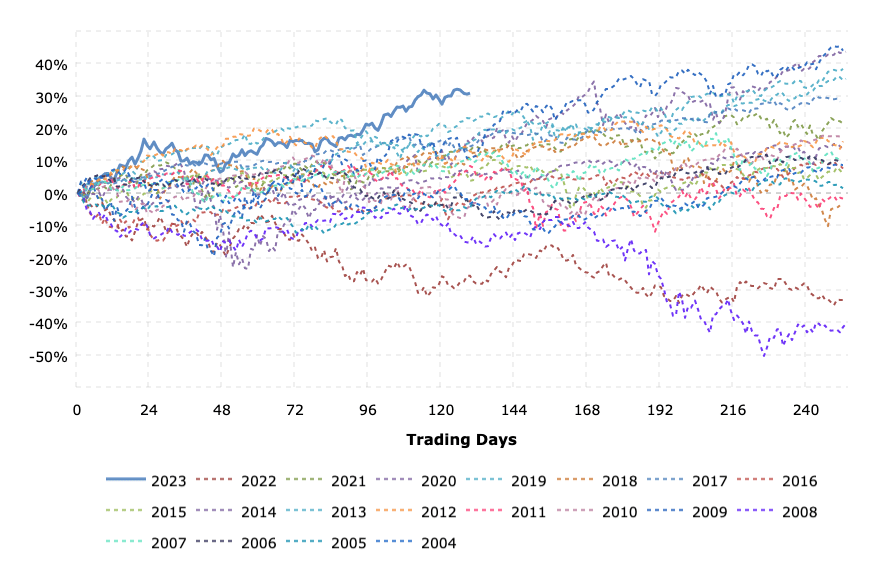
Macrotrends
The Macro Picture
Looking at the recent rally from a macroeconomic perspective, certain elements are scarily similar to previous recessions, especially if we look at the period just before the '00 recession in 1999.
In the Treasury bond market, both the 10-year 2-year and 10-year 3-month spreads have inverted deeply, the most since the 1980s. The last time the yield curve was so inverted, around February 2007, it took until about March 2009 for the Nasdaq-100 to bottom. The same is true for the dot-com recession: after a deep inversion in December 2000, it took until October 2002 for the Nasdaq-100 to bottom.
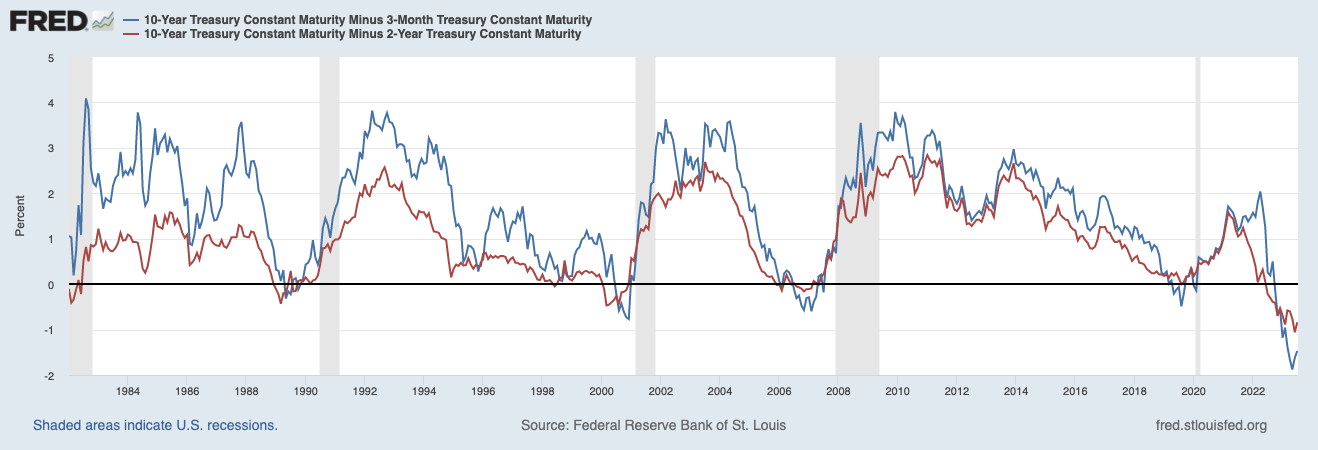
Federal Reserve (FRED)
Considering these factors and assuming that the deepest inversion has already occurred in May 2023, it could take until early 2025 for the Nasdaq-100 to bottom this time, if we look at previous periods. In terms of the severity of the drawdown, the QQQ index fell from about $120 at its peak in March 2000 to about $20 at its low in October 2002, or a drawdown of 83%.
Before 2008, the index was very robust in 2007, reached all-time highs of about $55, and then fell again to about $25 in 2009, a collapse in value of nearly 55%. The interesting thing about this is that the index also remained very robust, even well into 2008, and only fell to $48 in August 2008, which is only a 12.73% drop from the previous all-time highs, which reminds us of the current situation where we are seemingly well on our way to a recession, with the Nasdaq remaining robust and only down 14.57% from the all-time highs. This is despite the record reversal in the yield curve, deteriorating credit under multi-decade high interest rate levels, similar to 2000 and 2008.
The biggest deterioration we have seen at this time is a nearly 38% drop from peak to trough between January 2022 and October 2022. Looking at previous recessions, however, we tend to believe that we have not yet seen the trough and that we are likely to move to new lows over the next 2 years. Moreover, as in 2000 and 2008, we believe that this current rally may be one of many in the multi-year process required for indices to bottom out after both a mania and an economic crisis.
A House Built on Sand
Usually, we do not see a rally as problematic or unsustainable if it is supported by the right underlying fundamentals. To us, however, this rally seems rather built on irrationality and hope.
If we look at the historical average P/E ratio for the Nasdaq-100, we can see that we are currently returning to the euphoric levels of 2020 and 2021, which were sharply off trend. The 10-year historical average for the index is closer to 20.5x forward earnings, while according to the most recent data, the index is currently trading at 26.67x forward earnings. The current P/E ratio, however, is even higher and is currently at 30.73x earnings.

Bloomberg
Again, all this despite a record reversal in the yield curve, extremely tight Fed monetary policy and a tightening of credit combined with arguably what seems to be a case of deposit flight. At the 10-year average P/E ratio, the QQQ index would quote closer to $285, which we believe would be more reasonable given recent macroeconomic conditions.
Speaking of which, we have just received a new CPI print, which confirms our suspicions that inflation is much more the result of a fiscal stimulus where spending relative to GDP was the largest since World War II combined with an economy that has been closed down for far too long and monetary policy that had been too loose. Annualized CPI (YoY) currently stands at 3.1%, while CPI excluding shelter is only 0.7%.
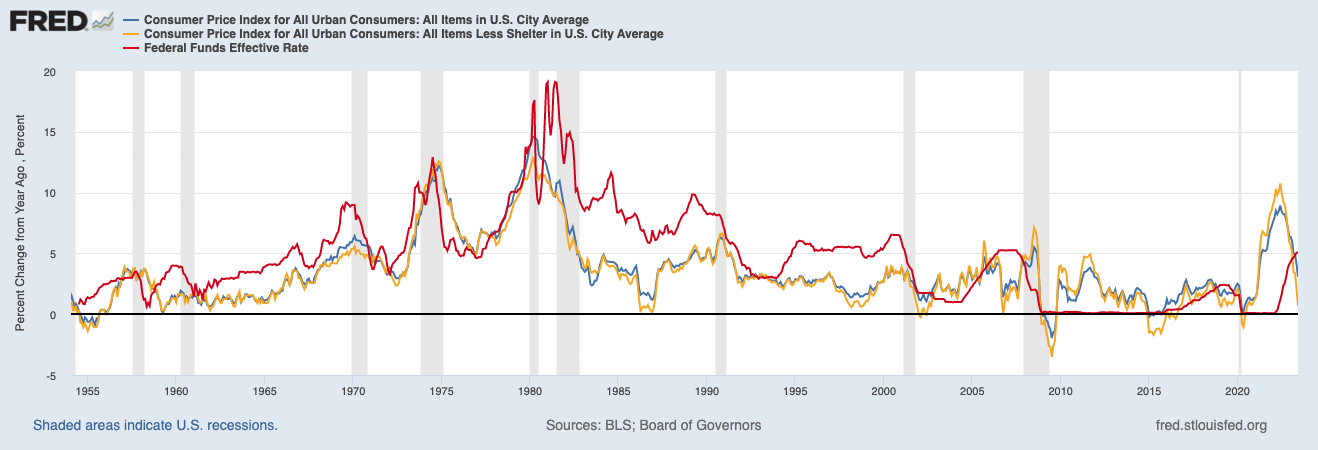
Federal Reserve (FRED)
And even despite this CPI reading, according to Fed Funds Futures, the market is pricing in that it is very likely that the Fed will raise interest rates by another 25bp, bringing this key benchmark to 5.50% at the end of this month. We think that the Fed's decisions have been made too much based on past data.
As for credit volume and credit conditions, the Senior Loan Officer Survey shows that banks are still tightening their credit conditions at a record pace. 46.7% of banks are tightening small business standards, the most since Q4 2008 and Q3 2020. These standards are currently even tighter than during the 2000-2002 recession. If we look at total loans and leases in bank loans for all commercial banks, we see that this credit base has not grown all that well in recent months. Obviously, a growing economy needs a growing credit base. Looking at all bank credit, the year-over-year change is heading for the worst period since 2008.

Federal Reserve (FRED)
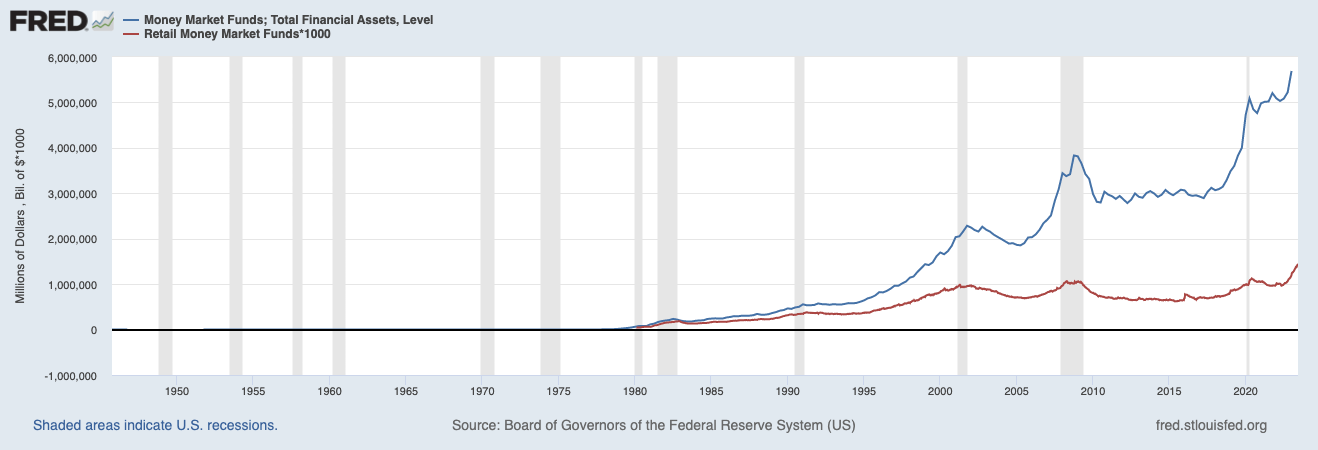
If we also look at other measures, such as M2 money supply and all commercial bank deposits, this base has also declined/stagnated. On top of that, money is flowing into money market funds at a record pace, raising fears of deposit flight. The KRE index, which tracks regional banks, is also still at multi-year lows, with no recovery in sight.
Federal Reserve (FRED)
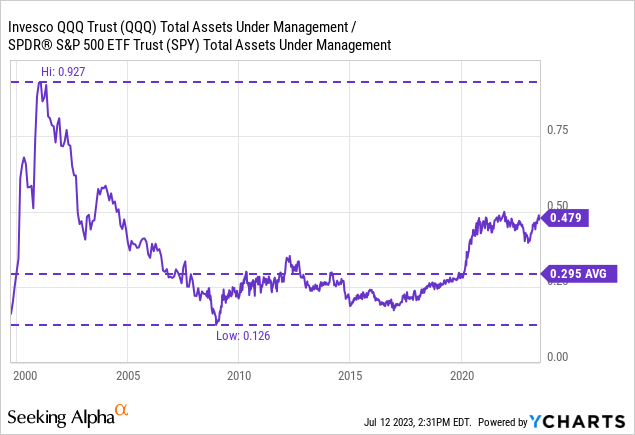
Another red flag we found is the amount of assets under management of both the largest Nasdaq-100 tracker, QQQ, and the largest tracker of the S&P 500, (SPY). After 2000, there is clearly a deviation from trend, with the ratio in AUM between QQQ and SPY going from about 0.25 to closer to 0.5. Although a strong deviation from trend, it is nothing like the levels during the dot-com bubble.
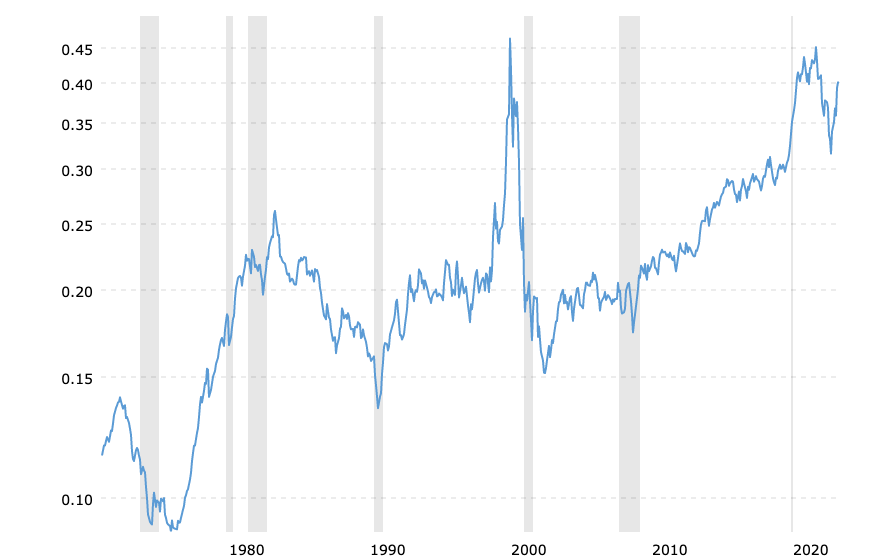
Looking at it from a different perspective, we see that the NASDAQ/Dow Jones ratio is trading near its all-time highs and close to the same ratio reached in the early 2000s.
Macrotrends
Concentration Risks
Lately, the Nasdaq-100 is starting to look more and more like the Nasdaq-10. Microsoft (MSFT), Apple (AAPL), and NVIDIA (NVDA) together currently account for about 31.83% of the QQQ. Add Amazon (AMZN), Meta (META), Tesla (TSLA) and Alphabet (GOOG) (GOOGL) and the total jumps up to a whopping 54.58%.
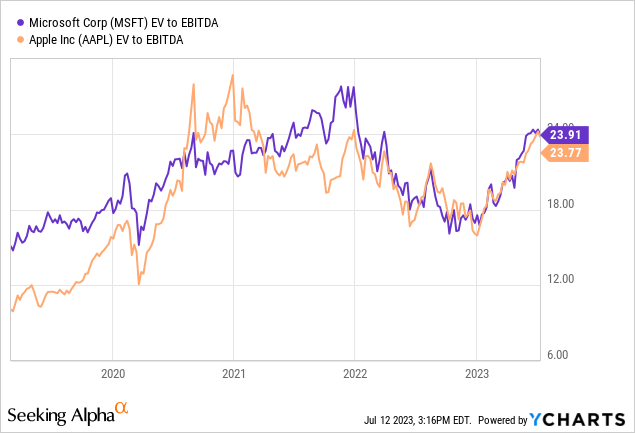
Looking at the biggest 2 stocks, Apple and Microsoft, which together make up almost 25% of the index, it seems that their fundamentals on an EV/EBITDA basis have also gone into the wrong direction. This gives us more reason to believe that this rally is based on hope rather than underlying fundamentals, unless future growth prospects turn out to be fantastic.
Nasdaq announced earlier this week that they are planning a "special rebalancing" to address this issue. More details have yet to be released, but we already know that the weight of the largest 5 companies will be reduced from 45.8% to 38.5% on July 24th. The only other times in history that the index has had a special rebalance dates back to 2011 and 1998.
The Bottom Line
We see many parallels that can be drawn between now and the tech rally in 2000, along with other indicators that have manifested themselves before a recession. Moreover, we think the current rally is based primarily on hope, rather than on an improvement in the underlying fundamentals in the index.
Also, from a technical point of view, we think it is more likely that the QQQ will return to its previous lows in October 2022 and that it will be a lot lower over the next 2 years, looking at previous recessions. At the current P/E ratio of 30.73, or an earnings yield of 3.25%, we see very little upside room for the ETF as short-term Treasuries are currently yielding 5.25% and are likely to be on their way to 5.50% by the end of this month.
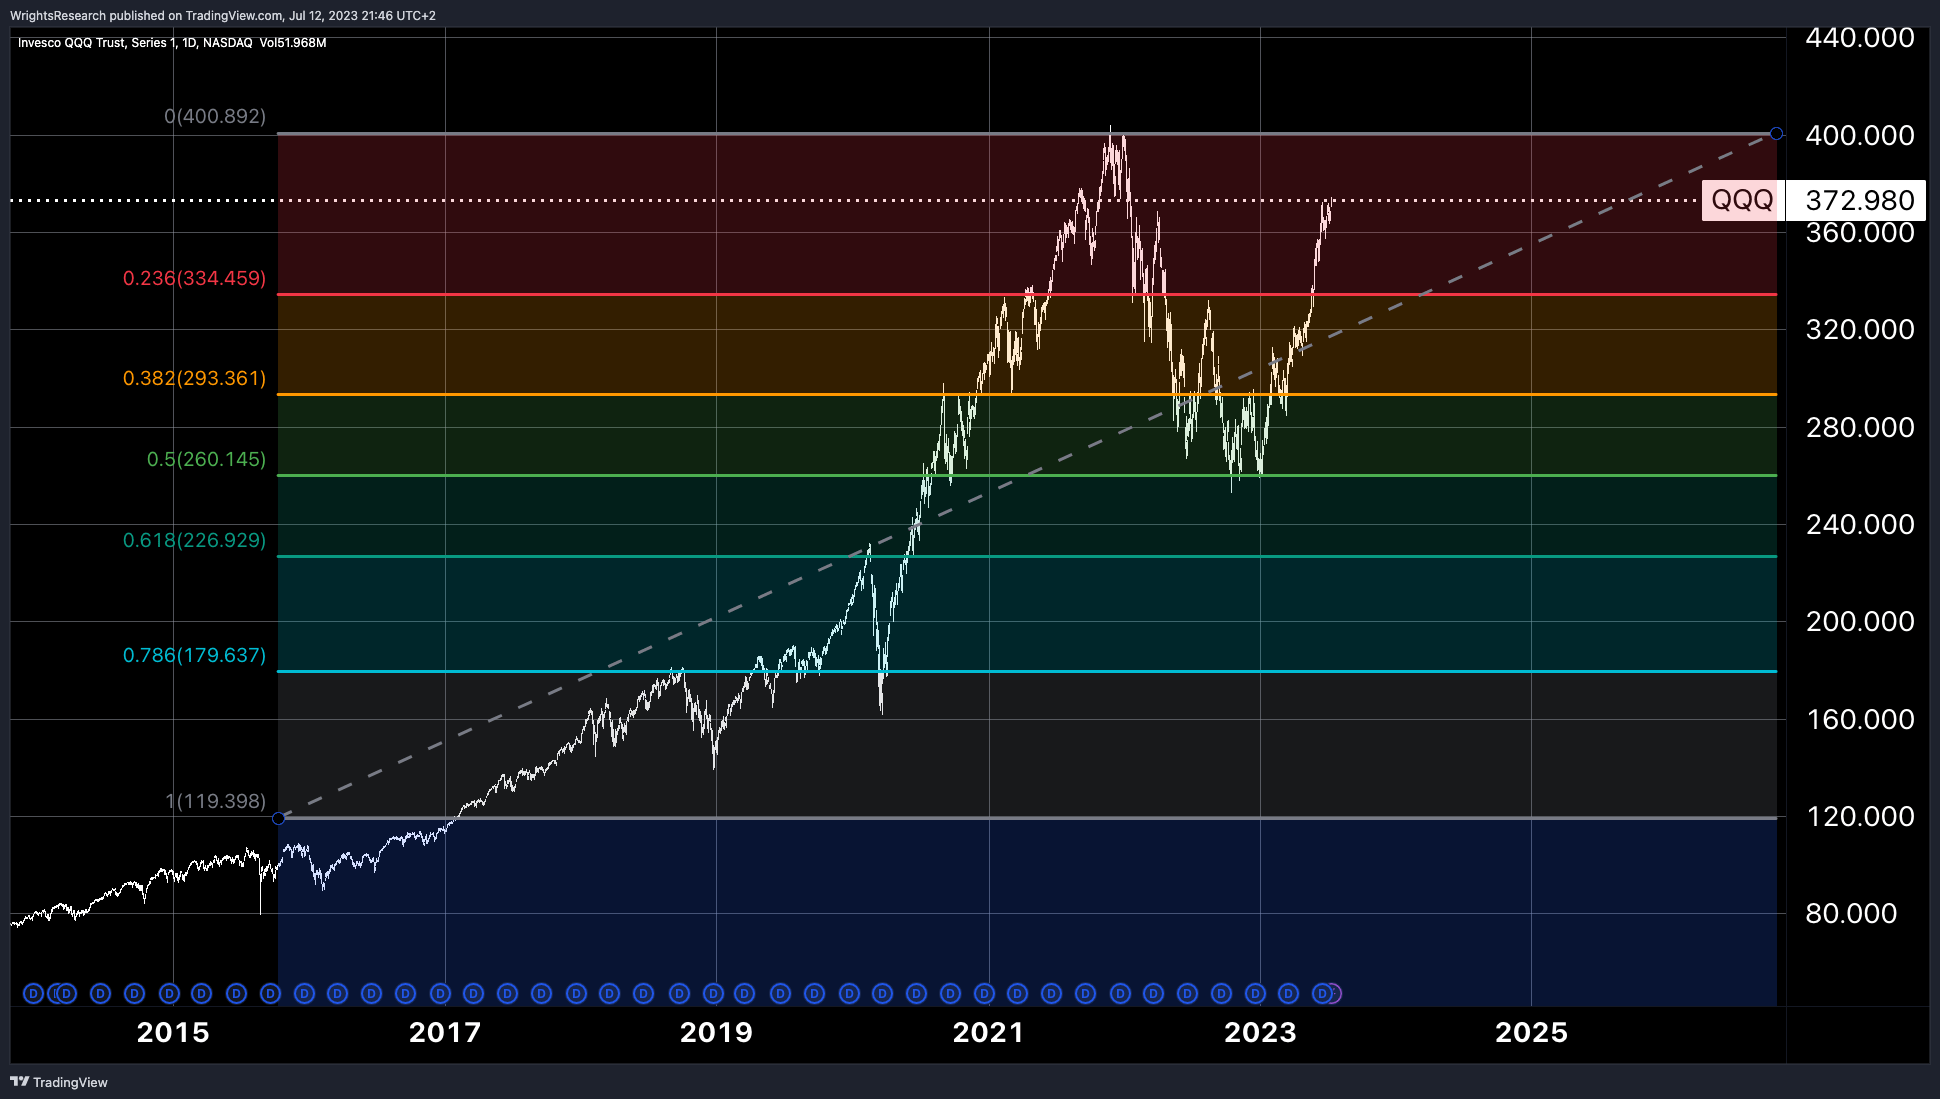
TradingView, Wright's Research
In other words, we think investors are taking a lot of risk for a 3.25% earnings yield compared to buying Treasuries at 5.25%, taking a 2% risk premium for future growth for granted despite the fact that a recession seems imminent, and the yield curve is deeply inverted. The premium currently paid for these equities relative to interest rates is currently one of the most unattractive in the past 20 years, in our view.
While the market and speculators can party like it's 1999 and the QQQ has shown the best 1H since 1999, we are cautious. As in 1999, we think the wisest thing to do at this time is to opt for safety and take the risk-free yield on treasuries. At this time, we give the QQQ a "Sell" rating until further improvements in the macroeconomic conditions or underlying fundamentals of the ETF become apparent.
This article was written by

Analyst’s Disclosure: I/we have no stock, option or similar derivative position in any of the companies mentioned, and no plans to initiate any such positions within the next 72 hours. I wrote this article myself, and it expresses my own opinions. I am not receiving compensation for it (other than from Seeking Alpha). I have no business relationship with any company whose stock is mentioned in this article.
Seeking Alpha's Disclosure: Past performance is no guarantee of future results. No recommendation or advice is being given as to whether any investment is suitable for a particular investor. Any views or opinions expressed above may not reflect those of Seeking Alpha as a whole. Seeking Alpha is not a licensed securities dealer, broker or US investment adviser or investment bank. Our analysts are third party authors that include both professional investors and individual investors who may not be licensed or certified by any institute or regulatory body.
Recommended For You
Comments (2)
