Why We Sold 1 Big Dividend Stock

Summary
- Earnings season is about to start.
- Compared to the recent consensus estimates for Q2 2023, we expect to see a few “surprises."
- Valuation became less compelling as interest rates and share prices both ripped higher in June.
- The REIT Forum members get exclusive access to our real-world portfolio. See all our investments here »

Tired of Getty images not producing relevant images? I feel your pain.
Neilson Barnard/Getty Images Entertainment
Get ready for charts, images, and tables because they're better than words. The ratings and outlooks we highlight here come after Scott Kennedy’s weekly updates in the REIT Forum. Your continued feedback is greatly appreciated, so please leave a comment with suggestions.
Q2 2023 earnings are coming up fast.
The REIT Forum's expert on mortgage REITs and BDCs, Scott Kennedy, provides estimates for earnings and changes in book value per share for mortgage REITs and BDCs. In the latest weekly update, we provided our estimates for all the mortgage REITs and BDCs we cover.
Predictions for Q2 2023 are pretty spicy for mortgage REITs. There are a few where we expect to see some significant misses when earnings are released. There should be a few beats as well. Since analysts can change their estimates up until just before earnings, it’s possible that the estimates will shift materially in the next few days or weeks. If analysts drop their estimates just before earnings, it can turn a “miss” into a “beat” because the bar was lowered. To keep it simple, we locked in the consensus estimates as of 6/30/2023. If the consensus falls and the company reports in line with the consensus, is that so different than a miss?
Mortgage REITs rallied hard in June, which created a very material change in valuations.
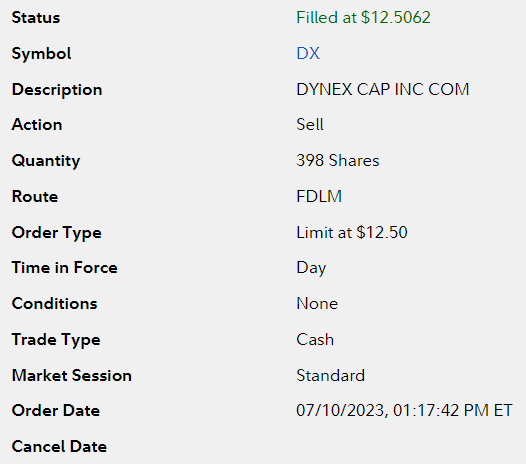
Yesterday I closed out my position in Dynex Capital (DX).

Charles Schwab
Fidelity
I still like the small mortgage REIT and consider the management top notch. However, we’ve seen many mortgage REITs trading at absurdly large discounts to book value within the last year and even within the last two months. We see shares trading much closer to our projected book value today (estimates as of Friday).
My positions were pretty small, so it didn’t have a big impact. Overall, I took a small loss on the position.
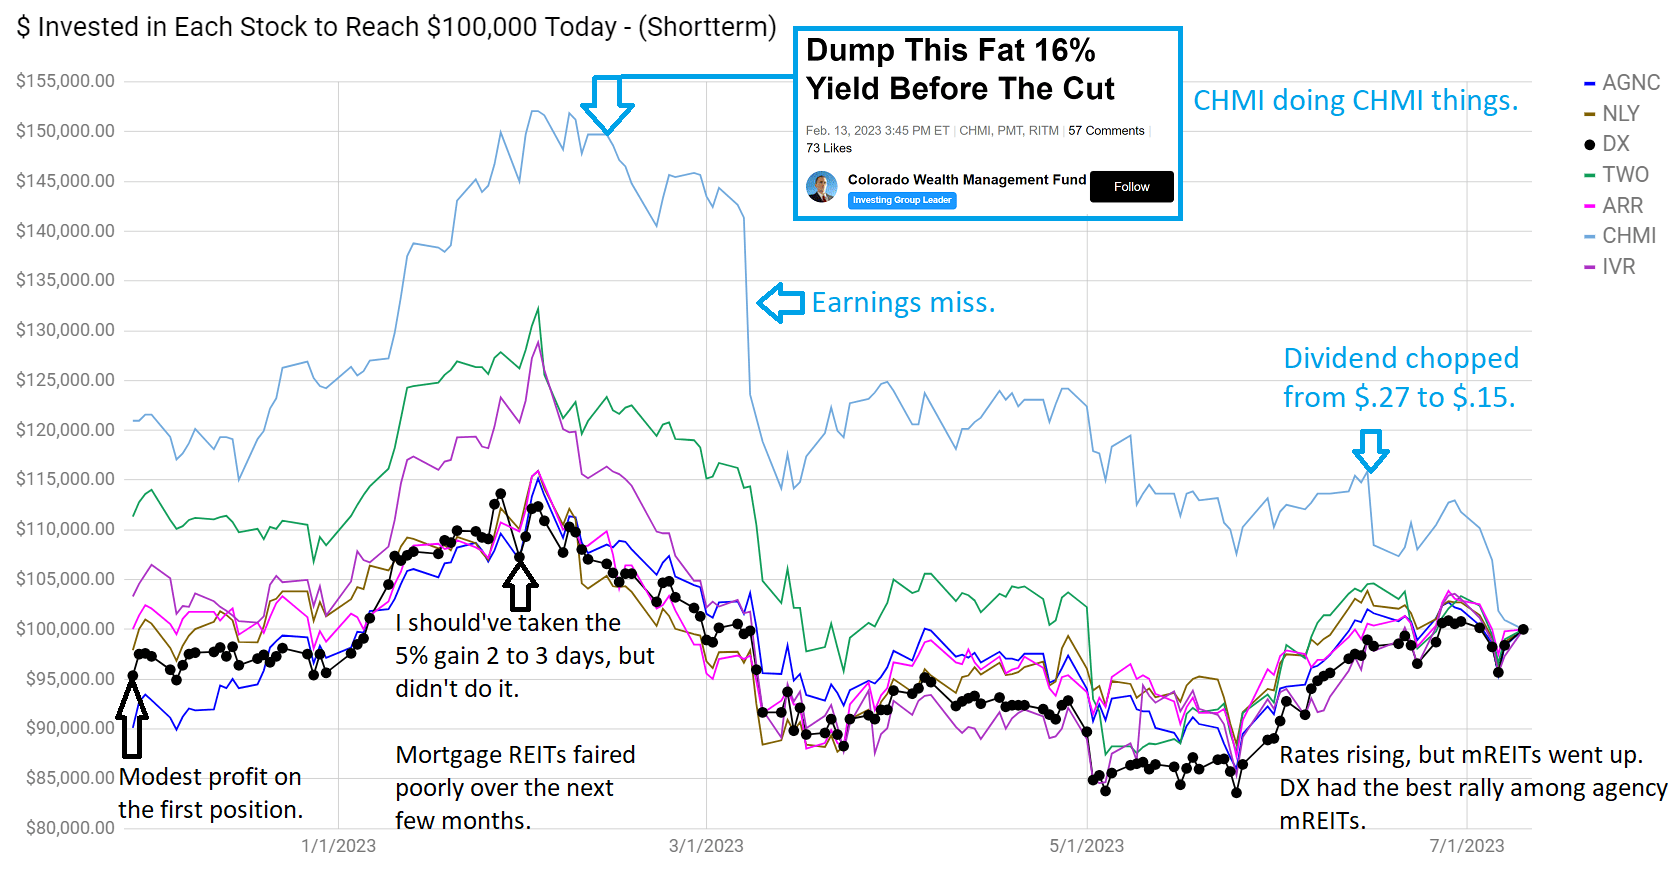
I purchased shares on two different days. Depending on which day we use, DX has either been the best-performing or second-best-performing agency mortgage REIT between my purchase and the time of our sale. I’ll demonstrate that on the chart, but I also want to highlight Cherry Hill Mortgage (CHMI) in the image:
The REIT Forum
The top line (the one that plunged) is CHMI.
The bottom line, the one that did much better, is DX.
I bought the dip in DX after a rough earnings release. Shares bounced back along with many peers. It would’ve been a fine time to take a quick profit on the bounce, but I stuck around a bit too long. The price dipped to the point where it was clearly too low to close out the position, so we waited for the bounce. That bounce came through in June.
The June bounce was a bit strange because interest rates were ripping higher. June was not an outstanding month for fundamentals, but it was an outstanding month for share prices. On average the sector rallied about 12%, including dividends.
I’d be interested in opening this position again, but I want to see some more favorable signs in the bond market or a bigger discount. As it stands, the discount to projected book value is smaller and we suspect earnings will come in below the consensus estimate of $.033 per share. It's worth noting here that the way DX hedges their portfolio results in hedging gains flowing outside their primary earnings metric. Consequently, the low “earnings” value paints a bleak picture that isn’t real. The strategy DX is using is quite intelligent, but it's often misunderstood by investors (despite management explaining it clearly on the calls). Combine that with the recent trend higher interest rates and I’m inclined to take a bit of risk off the table for now.
Our current rating on DX is neutral, but at $12.50 DX was in the upper end of our neutral range. For comparison, we currently have zero bullish ratings on agency mortgage REITs. Everything is either neutral or bearish. There are still opportunities in the sector from other kinds of mortgage REITs or using preferred shares or baby bonds.
Some investors will wonder if this impacts our investment in DX-C (DX.PC). It does not. We evaluated the fundamentals and technicals and were fine with both. If DX-C was significantly outperforming peers we would swap it, but that hasn’t been the case. DX-C has been roughly in line with peers over the last few months. If we look further back, it actually underperformed a bit.
Another High Dividend Yield Trap
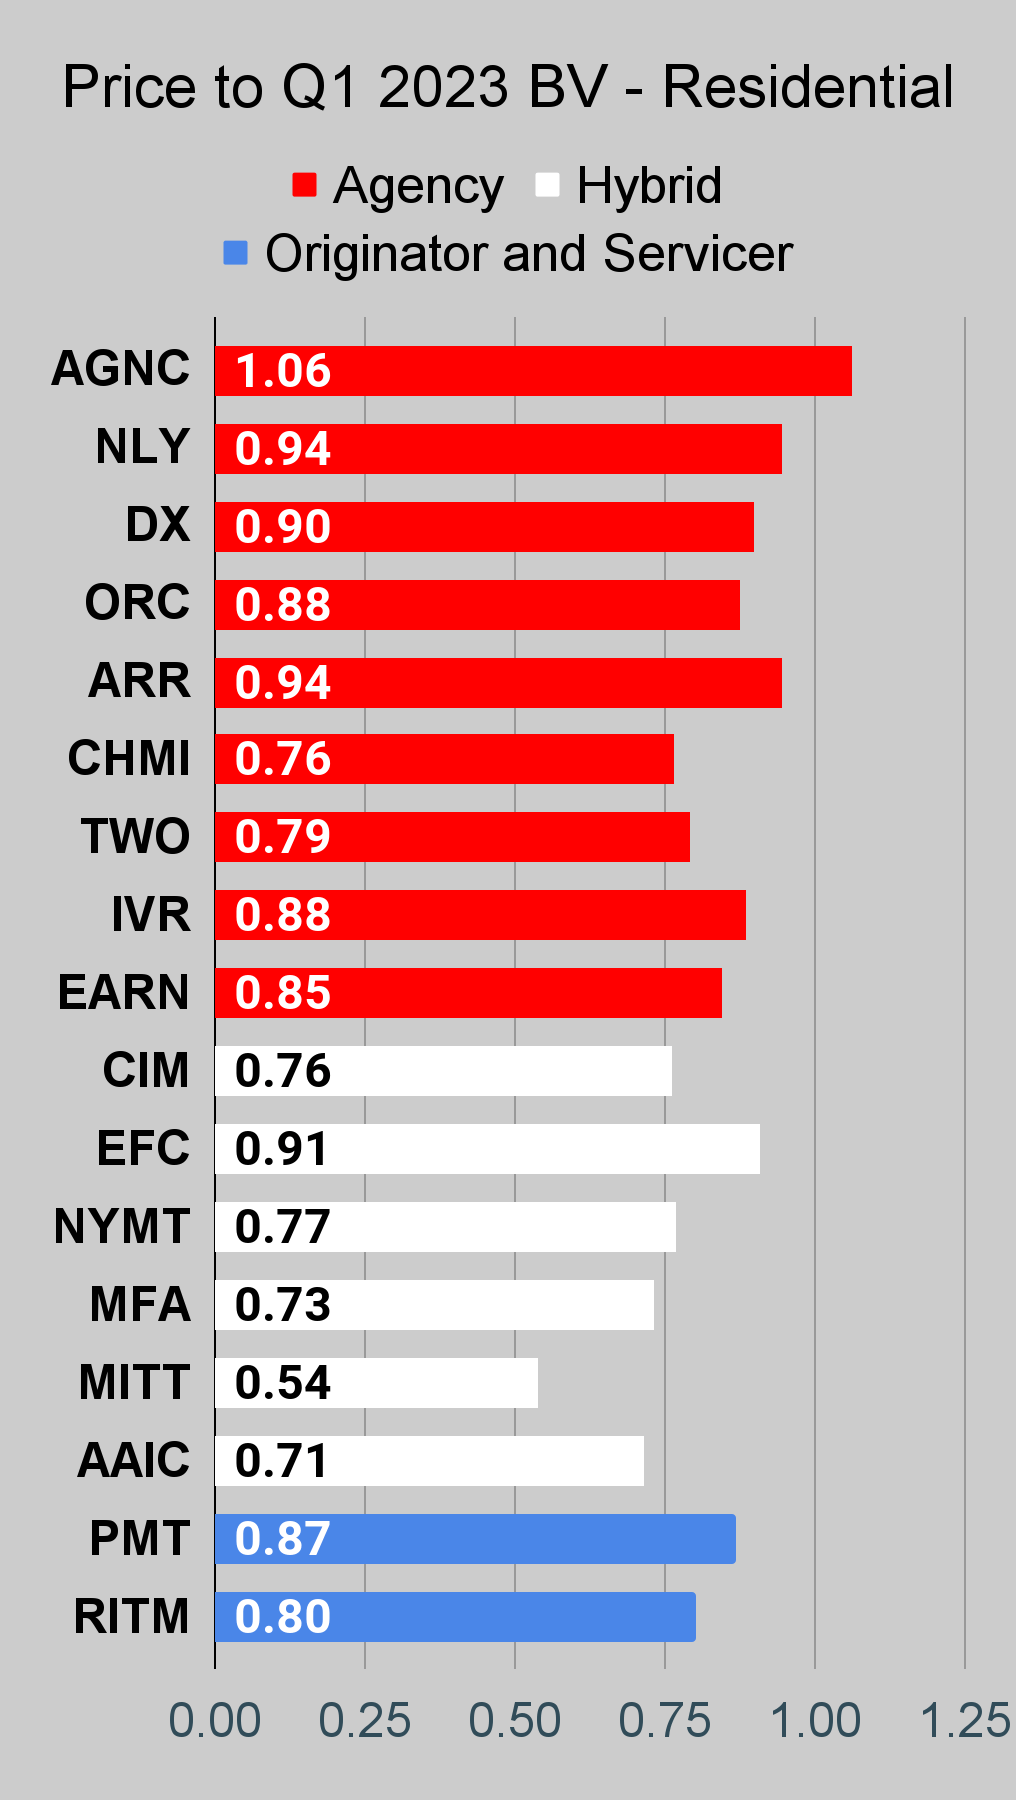
ARMOUR Residential REIT (ARR) is another trap. Shares trade slightly above our estimate for the current NAV. Is that reasonable? No.
Annaly Capital Management (NLY) trades at a slight discount to our estimate for the current NAV. Is ARR better than NLY? No. Does ARR deserve a higher ratio? No.
Why do investors cling to ARR? Because the trailing dividend yield is 18.7%. If ARR sustains that for a bit over five years:
- Shareholders recover all their money through dividends.
- Pigs might fly because this hypothetical is absurd. It’s not happening.
We’re bearish on ARR, but neutral on NLY. A pair trade would probably bring some alpha, but there are tax complications for most pair trading and investors can already get a high yield on a short-term Treasury ETF. For higher yields or locking yields in for longer, the baby bonds and preferred shares in the sector offer some nice choices.
A New Development
Due to subscriber requests, we’ve added more baby bonds to coverage. Since we have quite a few under coverage, it no longer makes sense to mix them in with the preferred shares. Consequently, I added in a new row of charts to provide metrics specific to baby bonds. This change also allows the charts to reference the time to maturity. For subscribers who missed the announcement, I went into more detail on the baby bonds in this subscriber article.
The baby bonds we're covering are from Gladstone Investment (GAIN), Ready Capital (RC), and a few that will be from Ellington Financial (EFC) after the buyout concludes.
Other Change
Blue Owl Capital Corporation (OBDC) is the new name for a BDC that was previously Owl Rock Capital Corporation and traded as ORCC. We covered it before and after the change. In the charts that follow, it's now referred to as OBDC.
Stock Table
We will close out the rest of the article with the tables and charts we provide for readers to help them track the sector for both common shares and preferred shares.
We include a quick table for the common shares that will be shown in our tables:
Type of REIT or BDC | ||||
Residential Agency | Residential Hybrid | Residential Originator and Servicer | Commercial | BDC |
If you’re looking for a stock and I haven’t mentioned it yet, you’ll still find it in the charts below. The charts contain comparisons based on price-to-book value, dividend yields, and earnings yield. You won’t find these tables anywhere else.
For mortgage REITs, please look at the charts for AGNC, NLY, DX, ORC, ARR, CHMI, TWO, IVR, EARN, CIM, EFC, NYMT, MFA, MITT, AAIC, PMT, RITM, BXMT, GPMT, WMC, and RC.
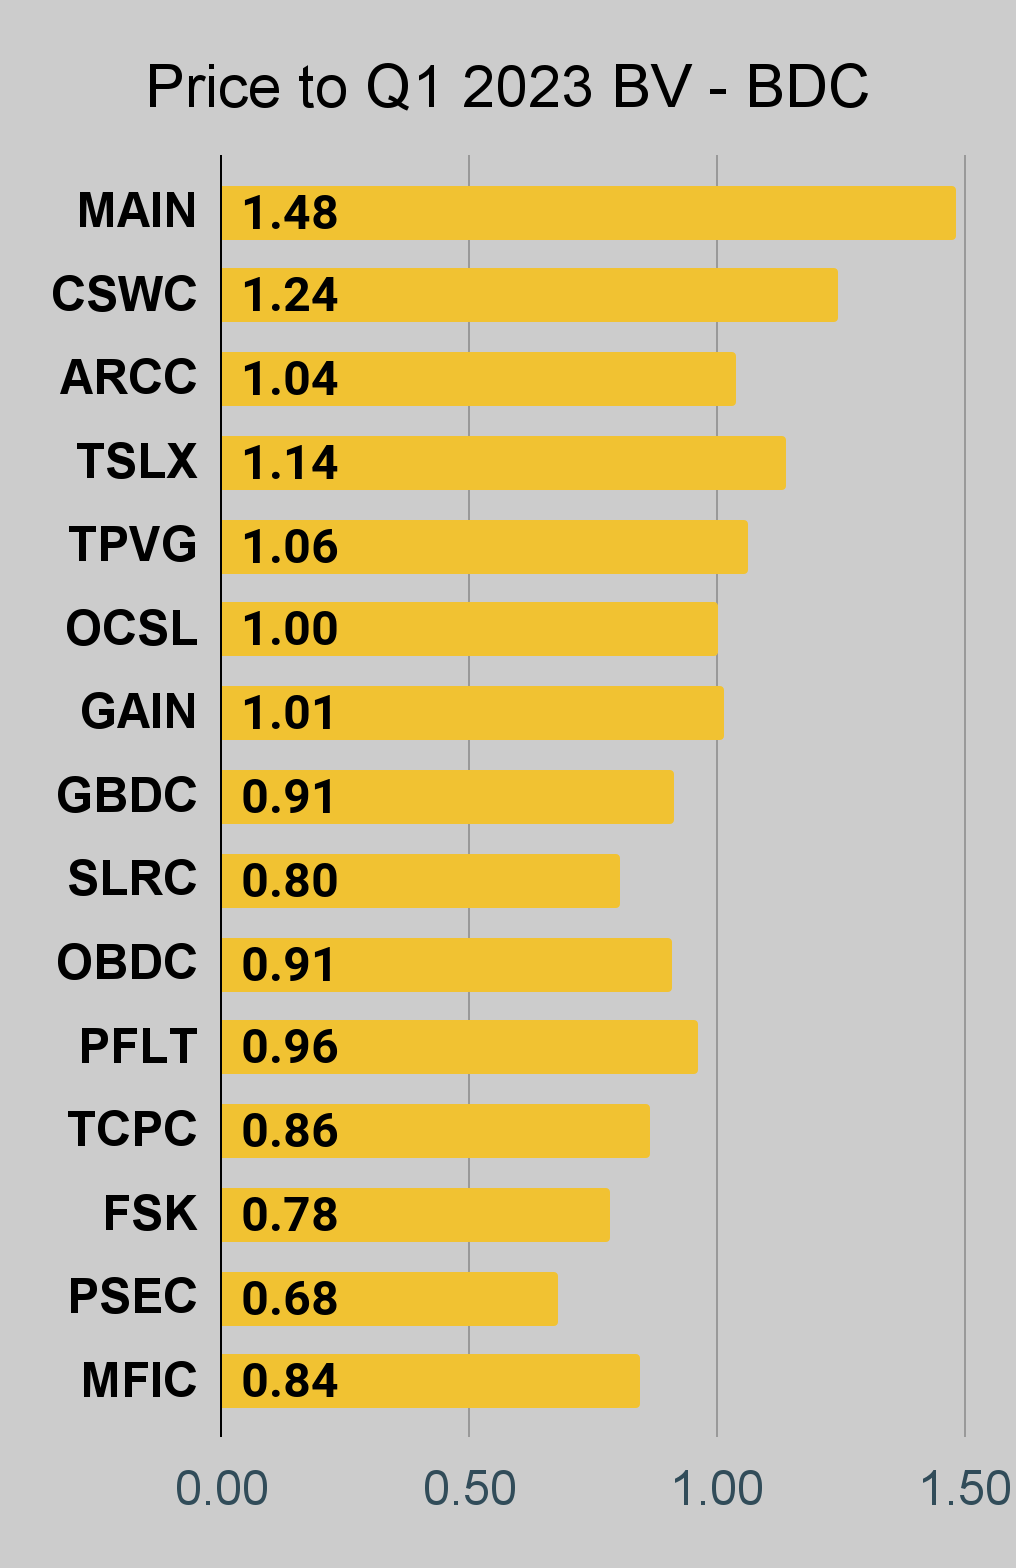
For BDCs, please look at the charts for MAIN, CSWC, ARCC, TSLX, TPVG, OCSL, GAIN, GBDC, SLRC, ORCC, PFLT, TCPC, FSK, PSEC, and MFIC.
This series is the easiest place to find charts providing up-to-date comparisons across the sector.
Residential Mortgage REIT Charts
Note: The chart for our public articles uses the book value per share from the latest earnings release. Current estimated book value per share is used in reaching our targets and trading decisions. It's available in our service, but those estimates are not included in the charts below. PMT and NYMT are not showing an earnings yield metric as neither REIT provides a quarterly “Core EPS” metric. Presently, a few other REITs also have no consensus estimate.
Second Note: Due to the way historical amortized cost and hedging is factored into the earnings metrics, it's possible for two mortgage REITs with similar portfolios to post materially different metrics for earnings. I would be very cautious about putting much emphasis on the consensus analyst estimate (which is used to determine the earnings yield). In particular, throughout late 2022 the earnings metric became less comparable for many REITs.
 The REIT Forum | 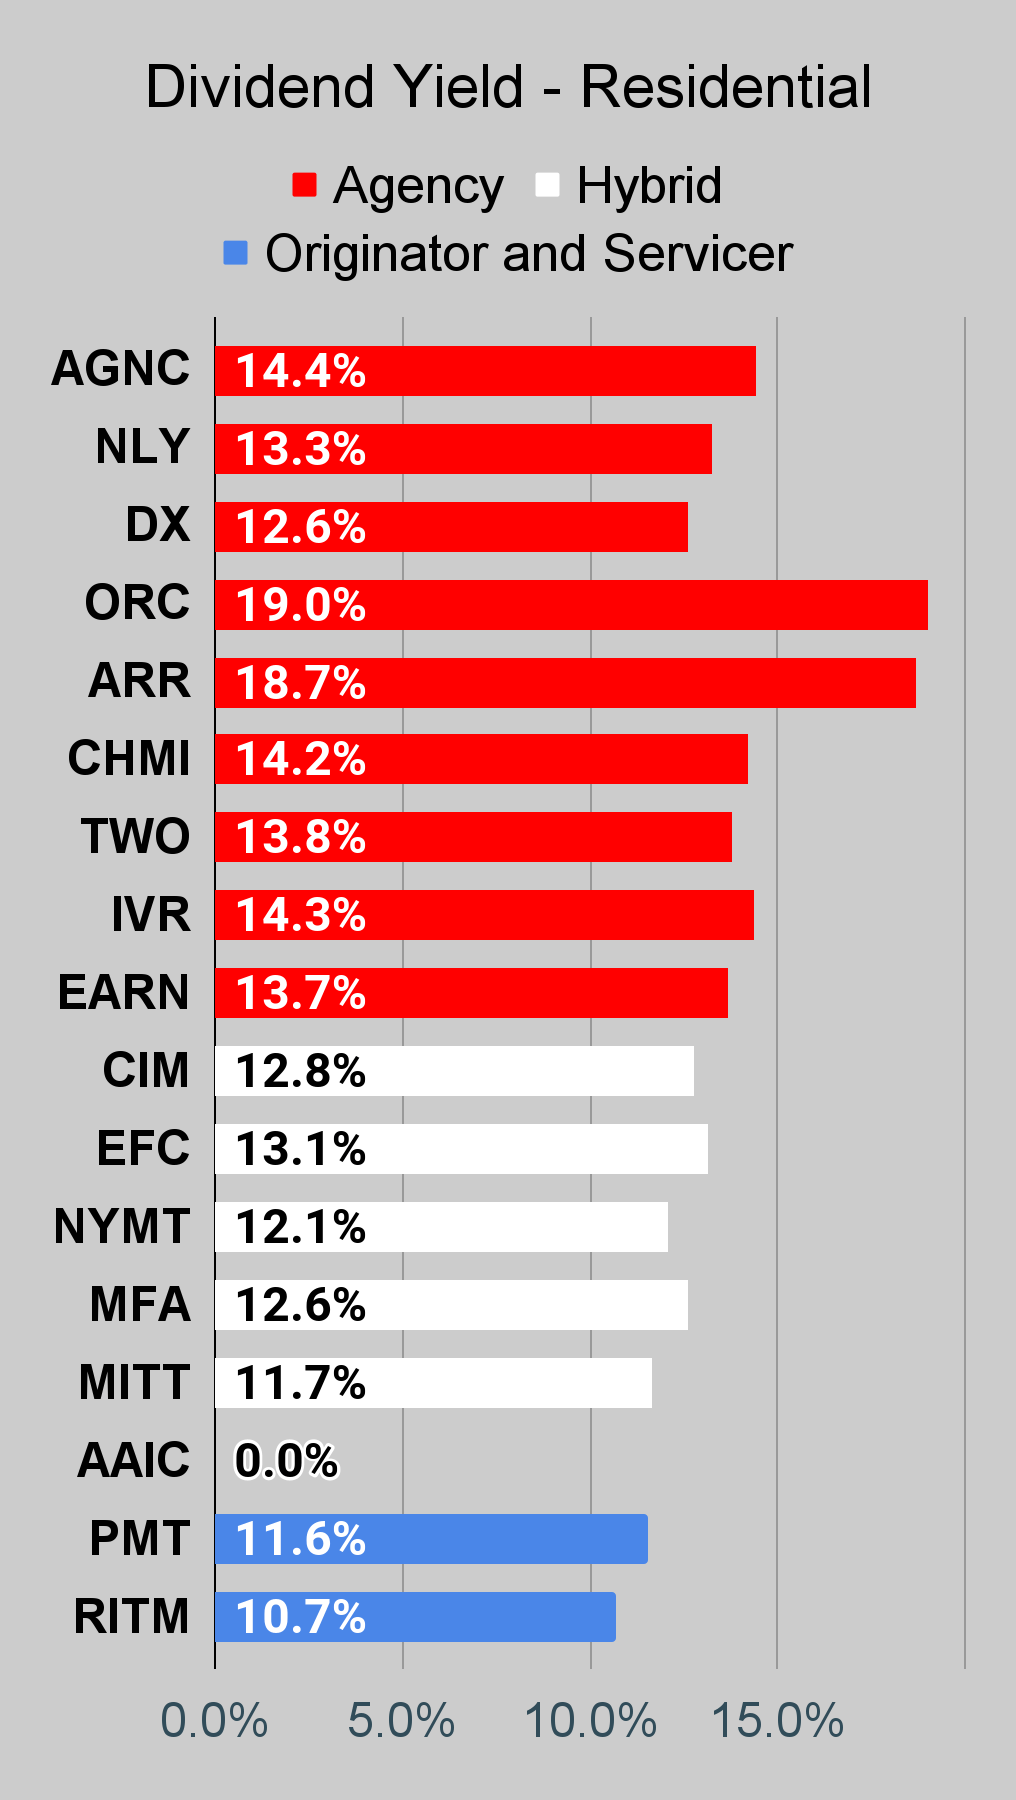 The REIT Forum | 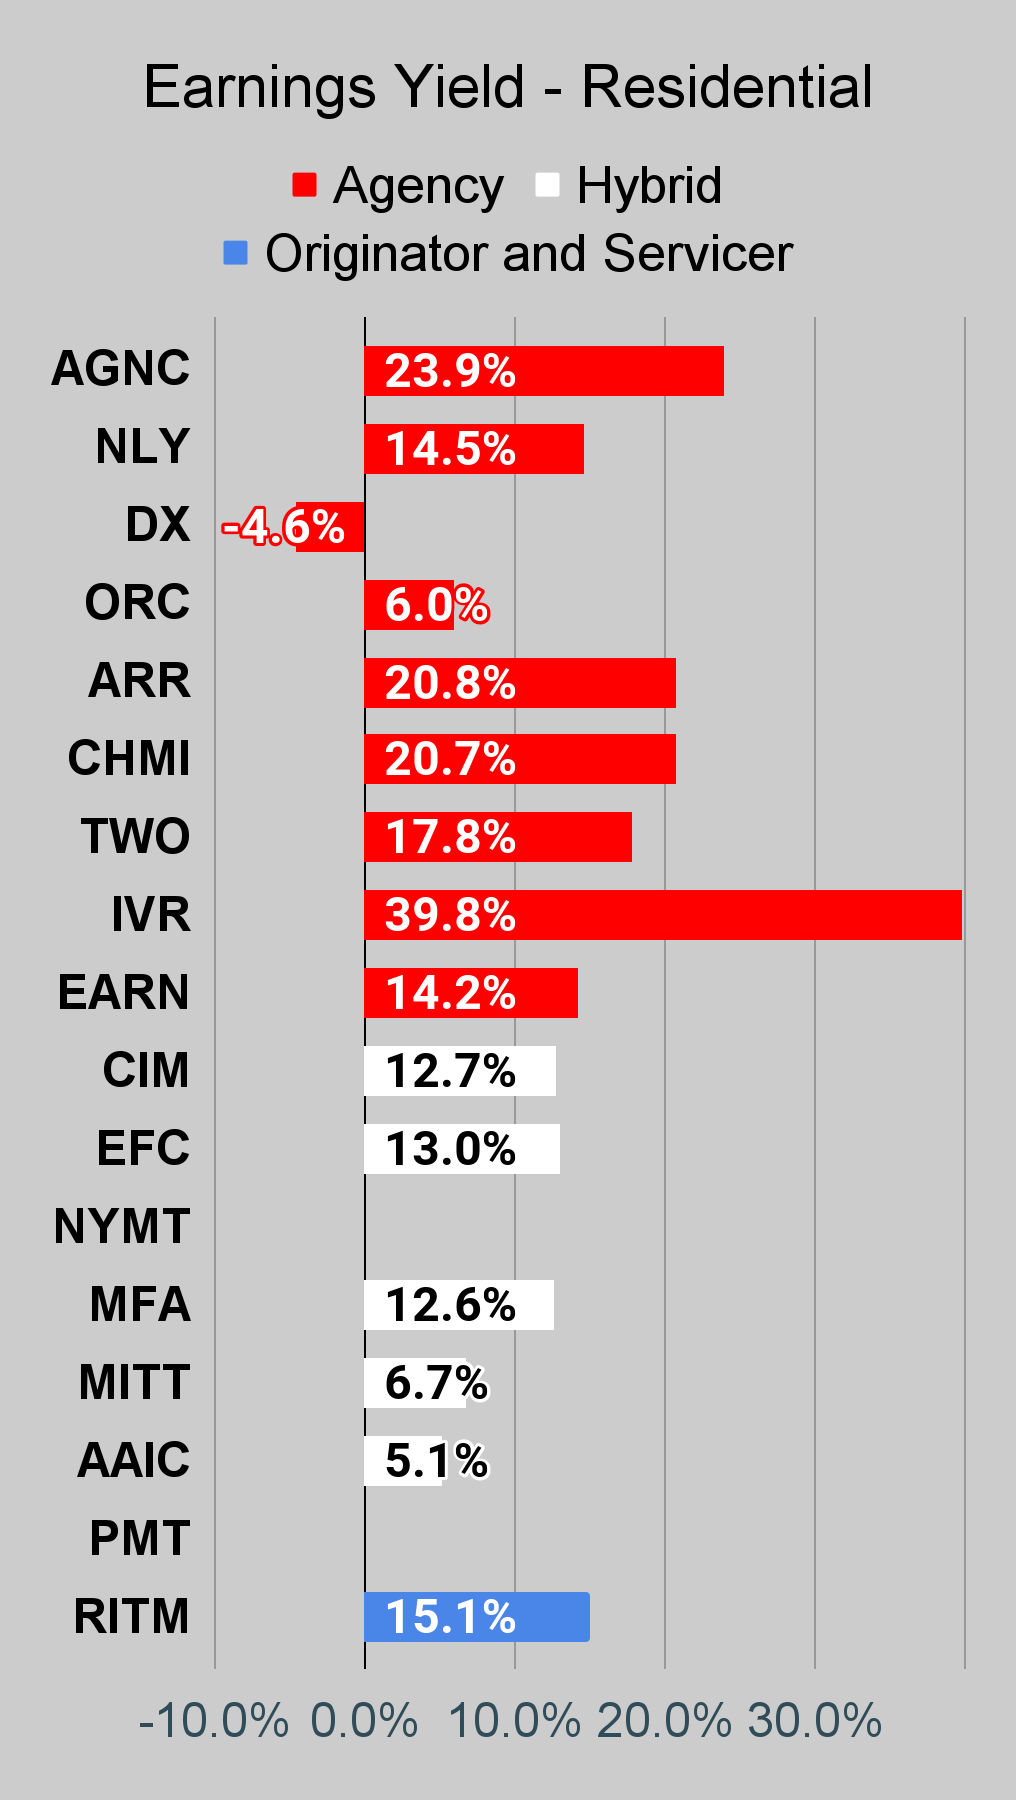 The REIT Forum |
Commercial Mortgage REIT Charts
 The REIT Forum | 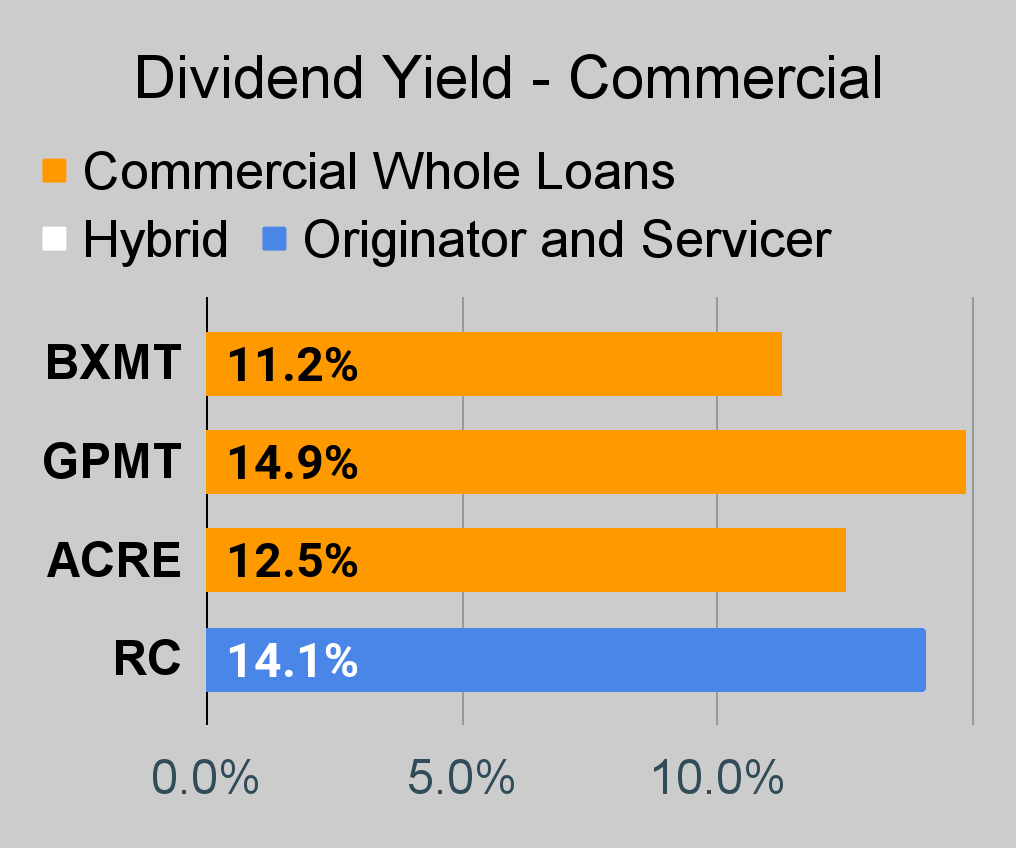 The REIT Forum |  The REIT Forum |
BDC Charts
 The REIT Forum | 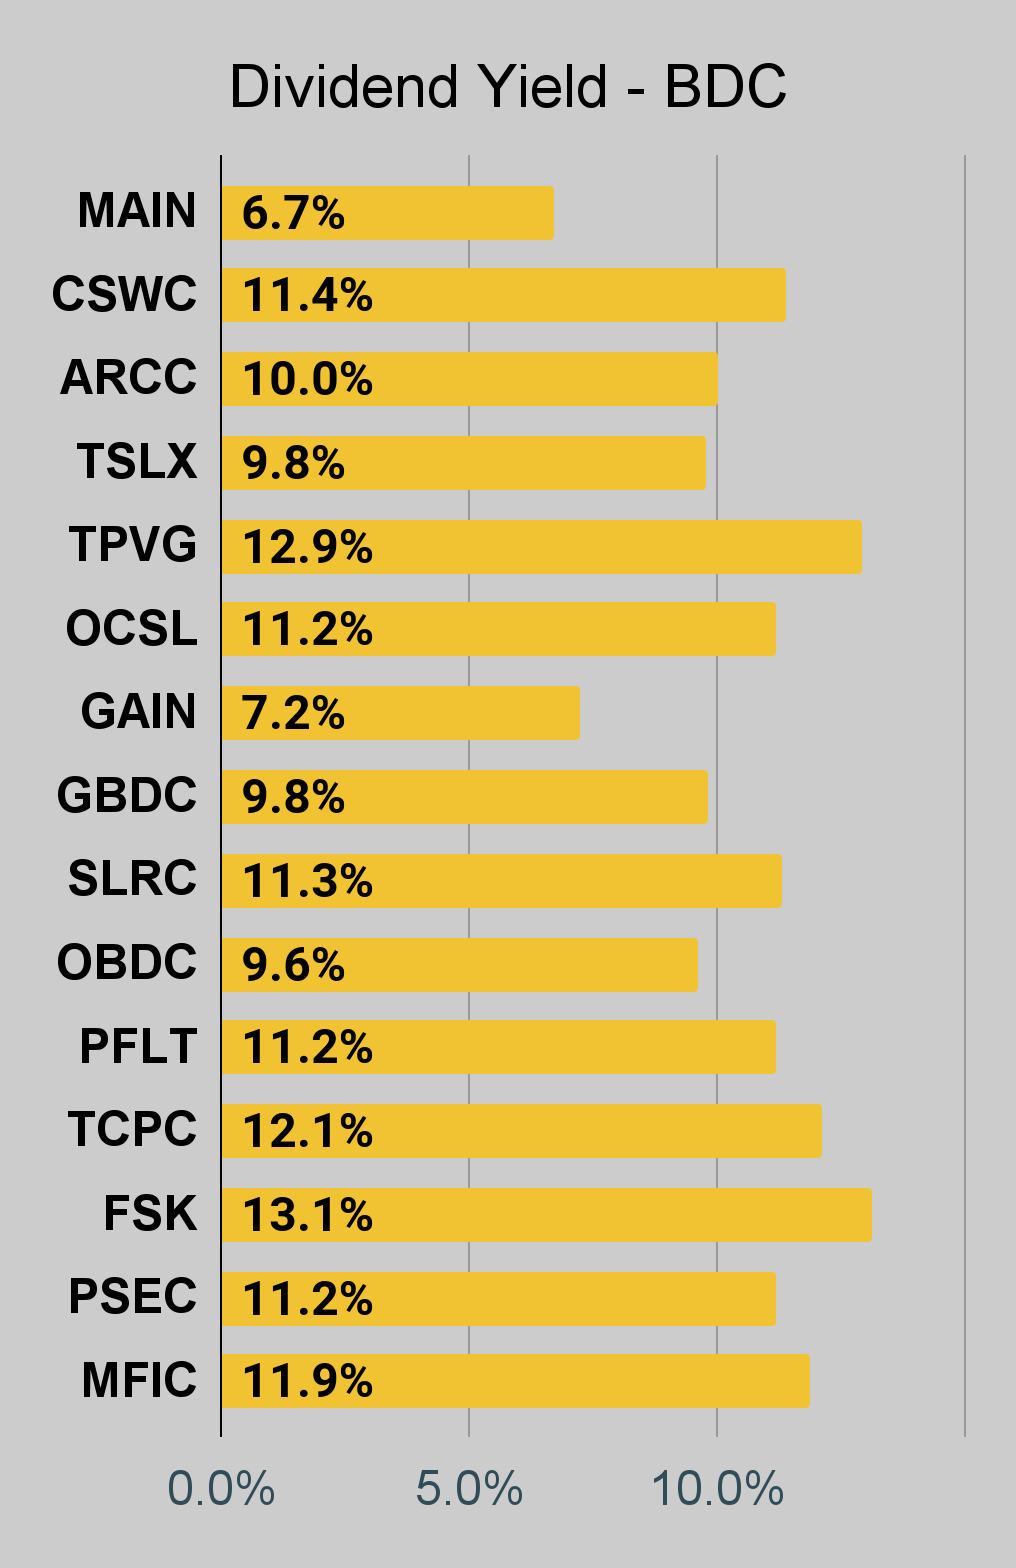 The REIT Forum | 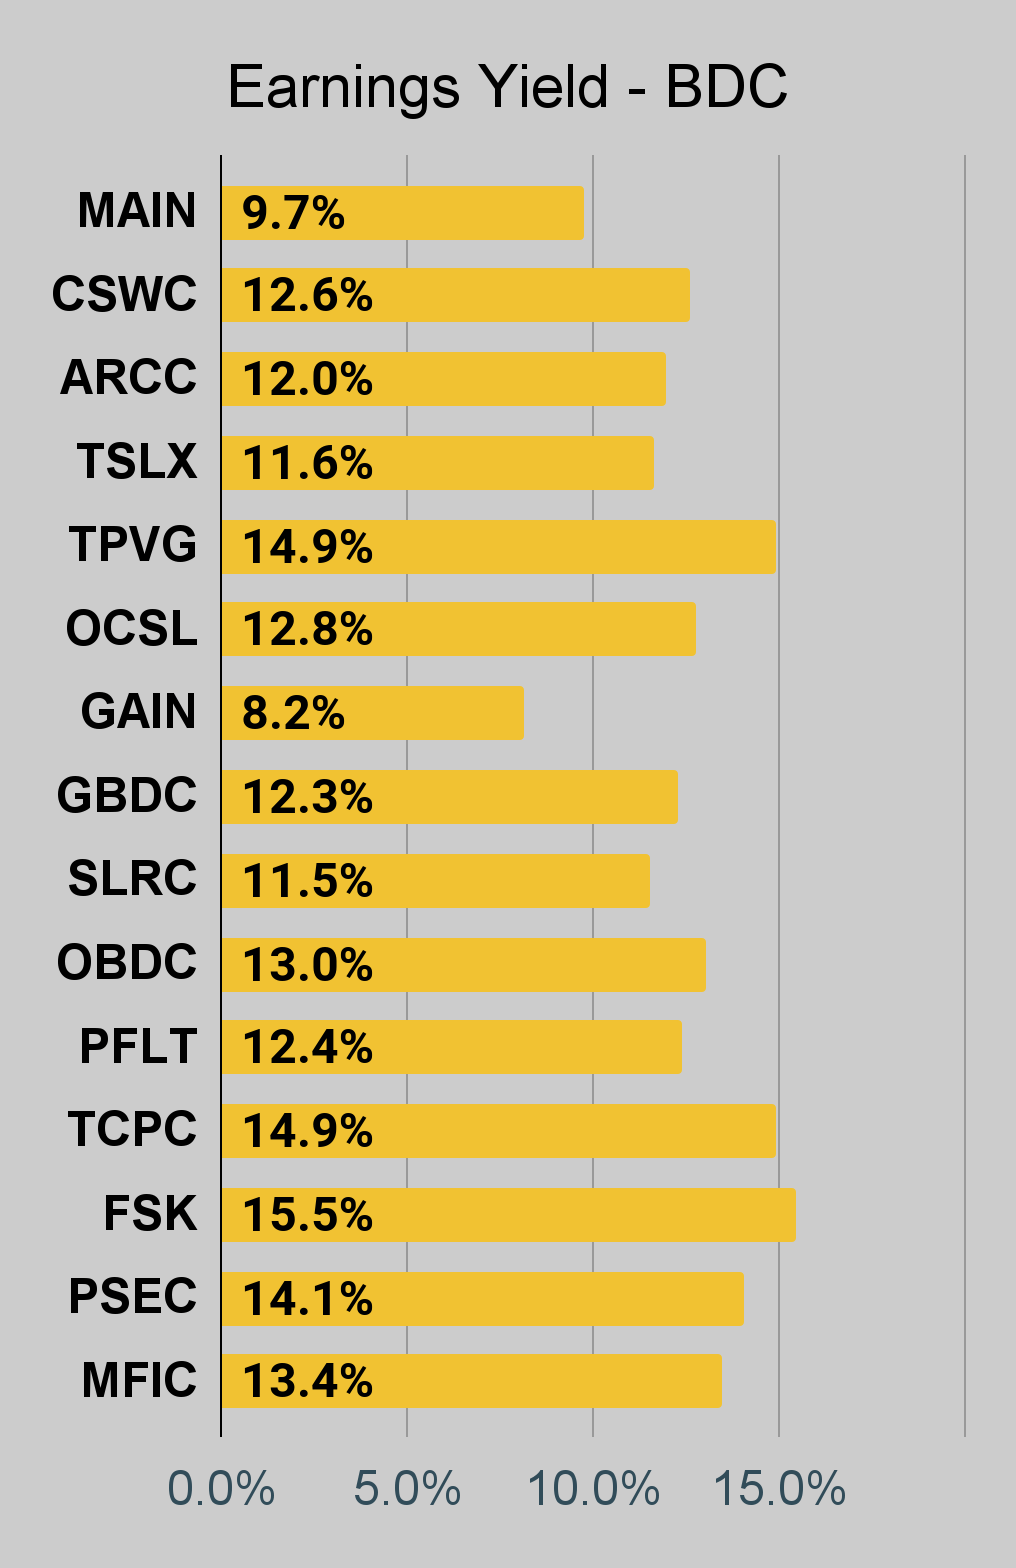 The REIT Forum |
Baby Bond Charts
Since we're covering more baby bonds, they get their own charts instead of being wrapped into the preferred share charts.
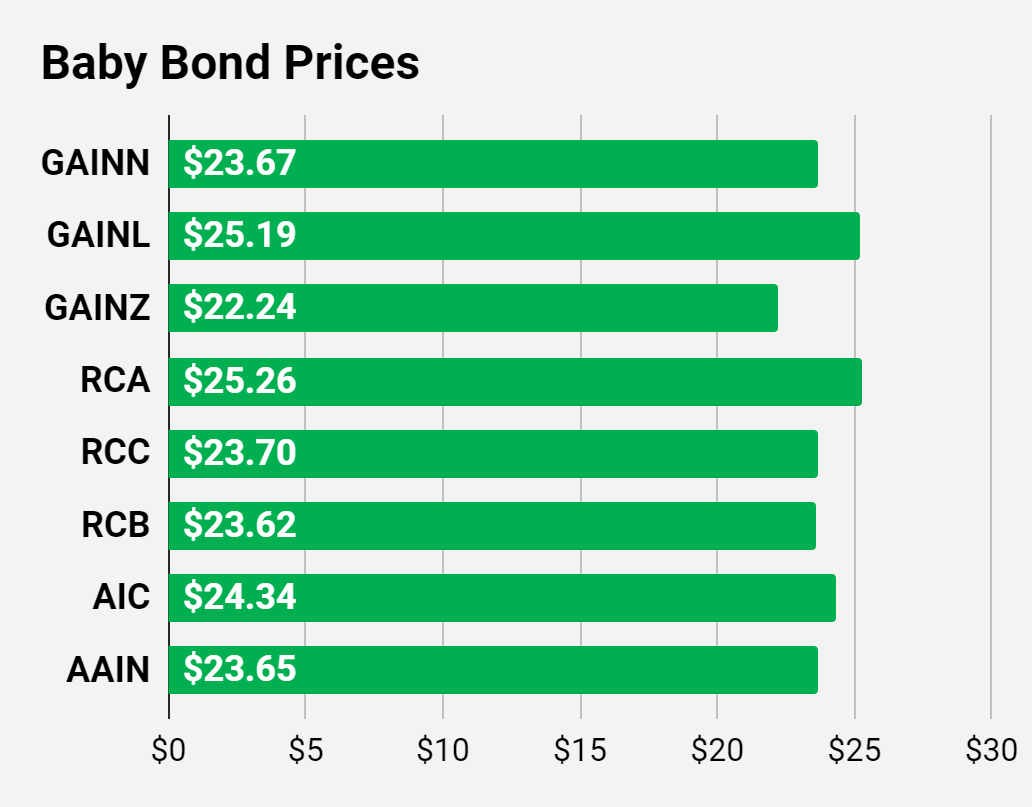 The REIT Forum | 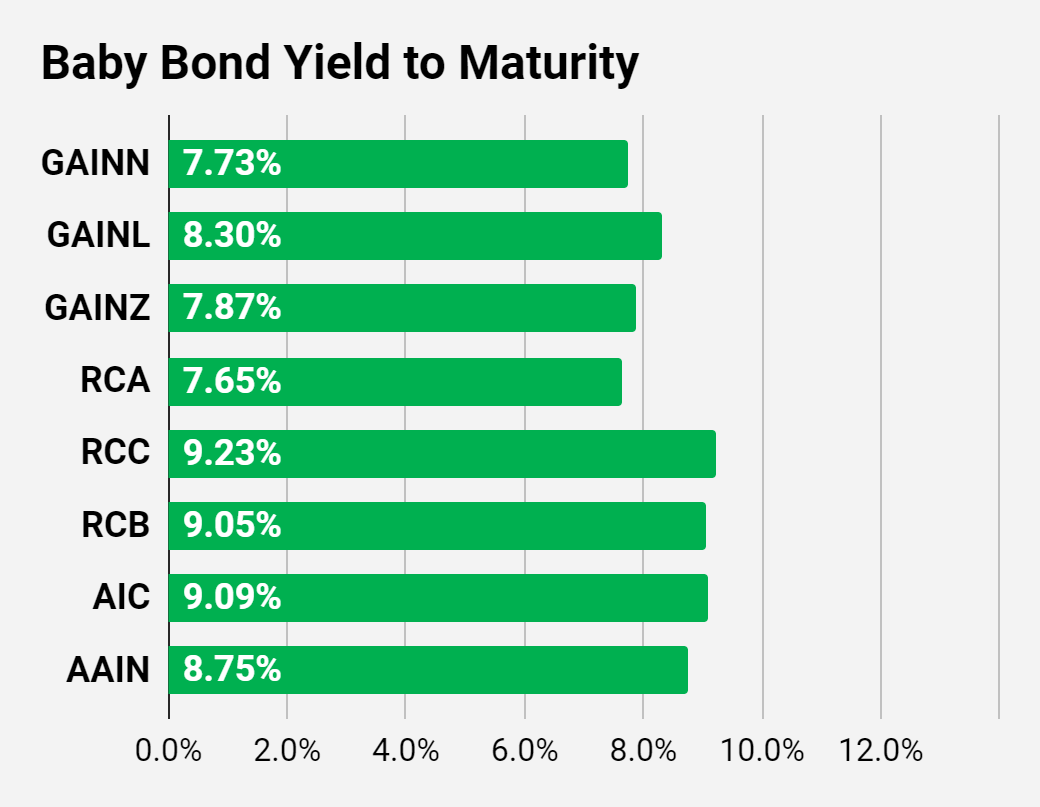 The REIT Forum | 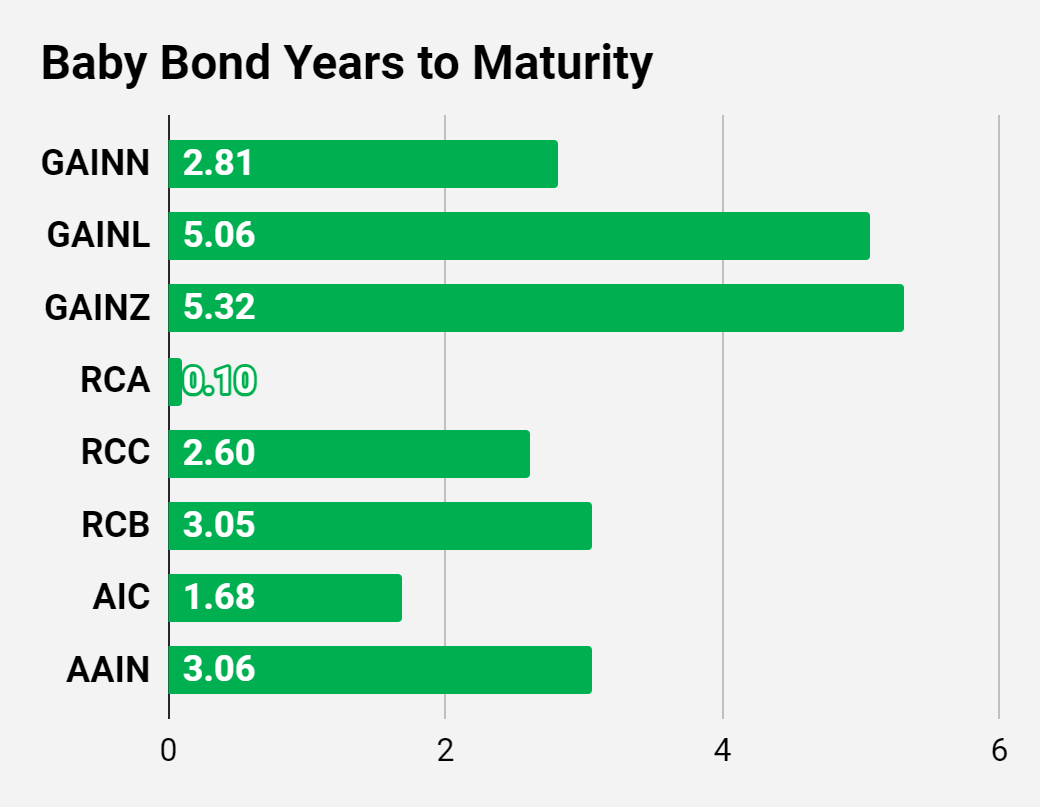 The REIT Forum |
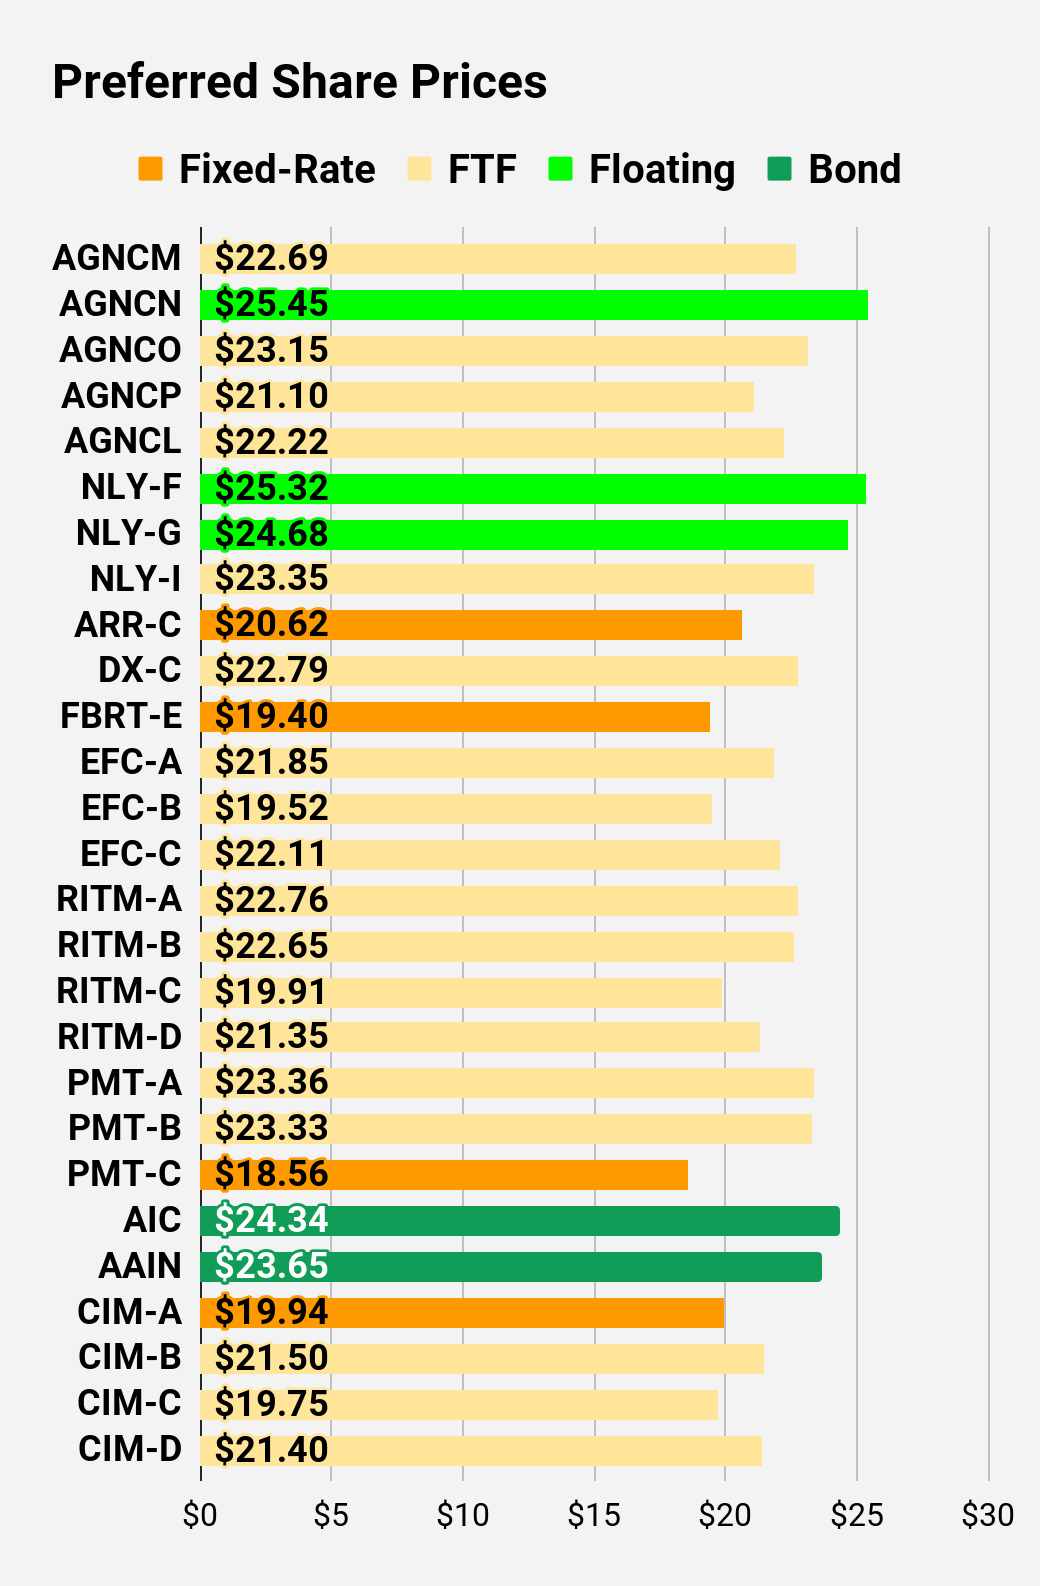
Preferred Share Charts
When a share already is floating, the stripped yield may differ from the “Floating Yield on Price” due to changes in interest rates. For instance, NLY-F already has a floating rate. However, the rate is only reset once per three months. The stripped yield is calculated using the upcoming projected dividend payment and the “Floating Yield on Price” is based on where the dividend would be if the rate reset today. In my opinion, for these shares the “Floating Yield on Price” is clearly the more important metric.
 The REIT Forum | 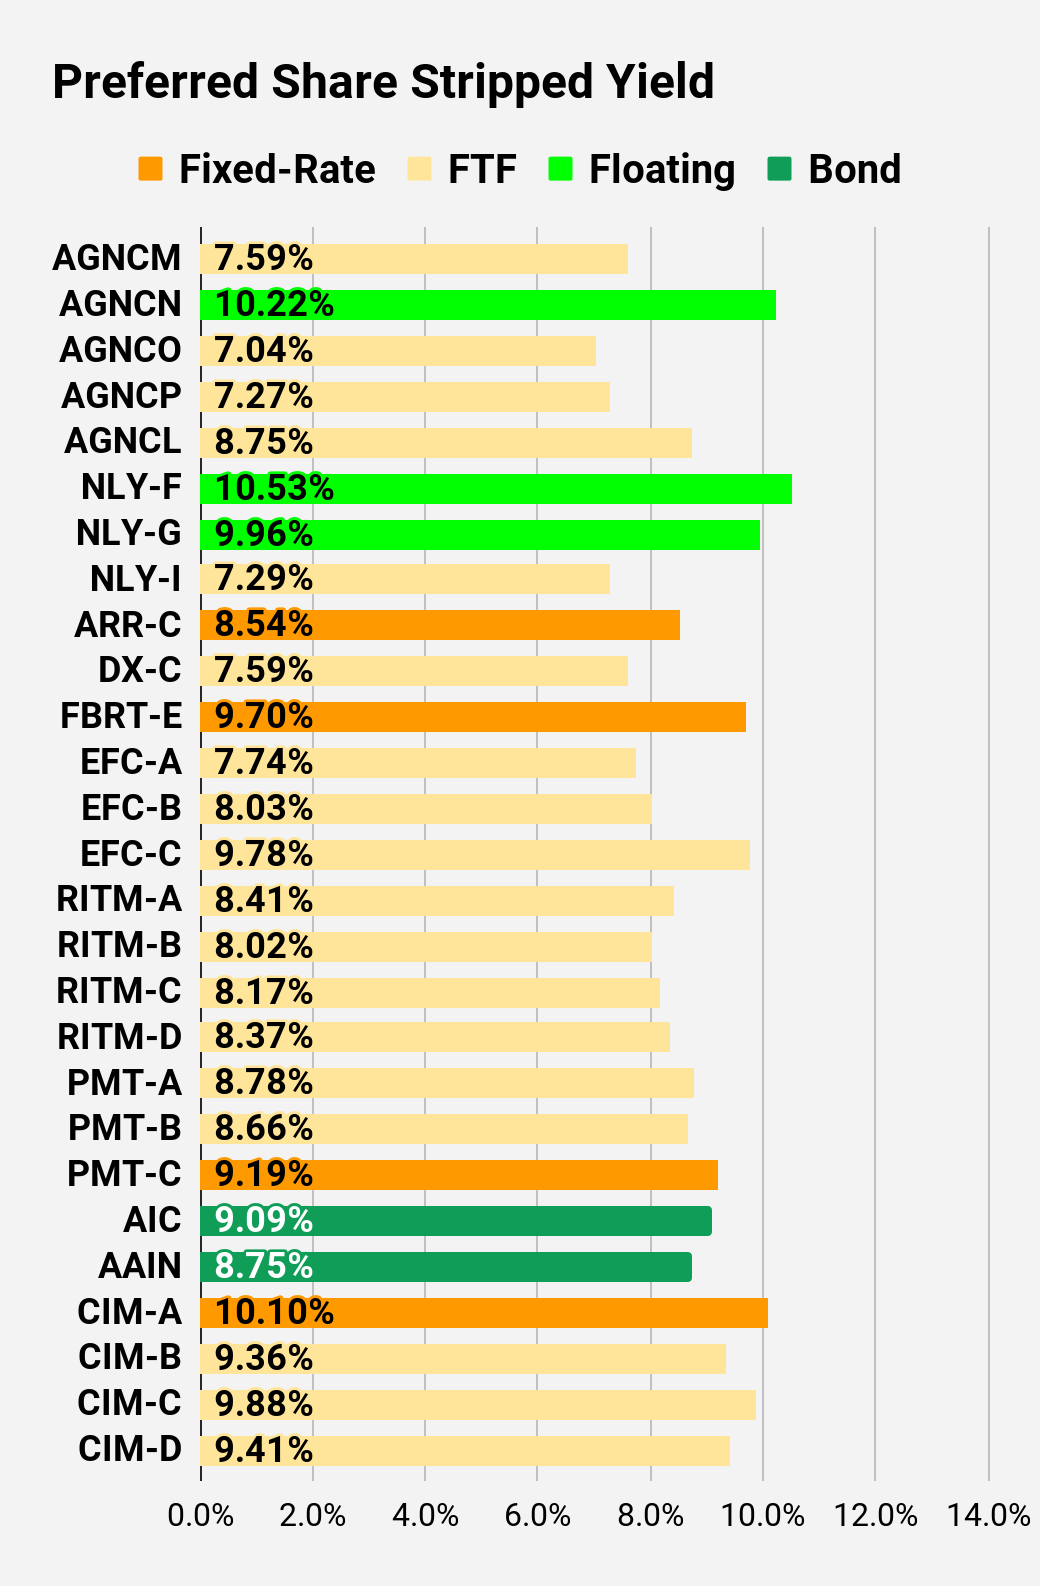 The REIT Forum |  The REIT Forum |
 The REIT Forum | 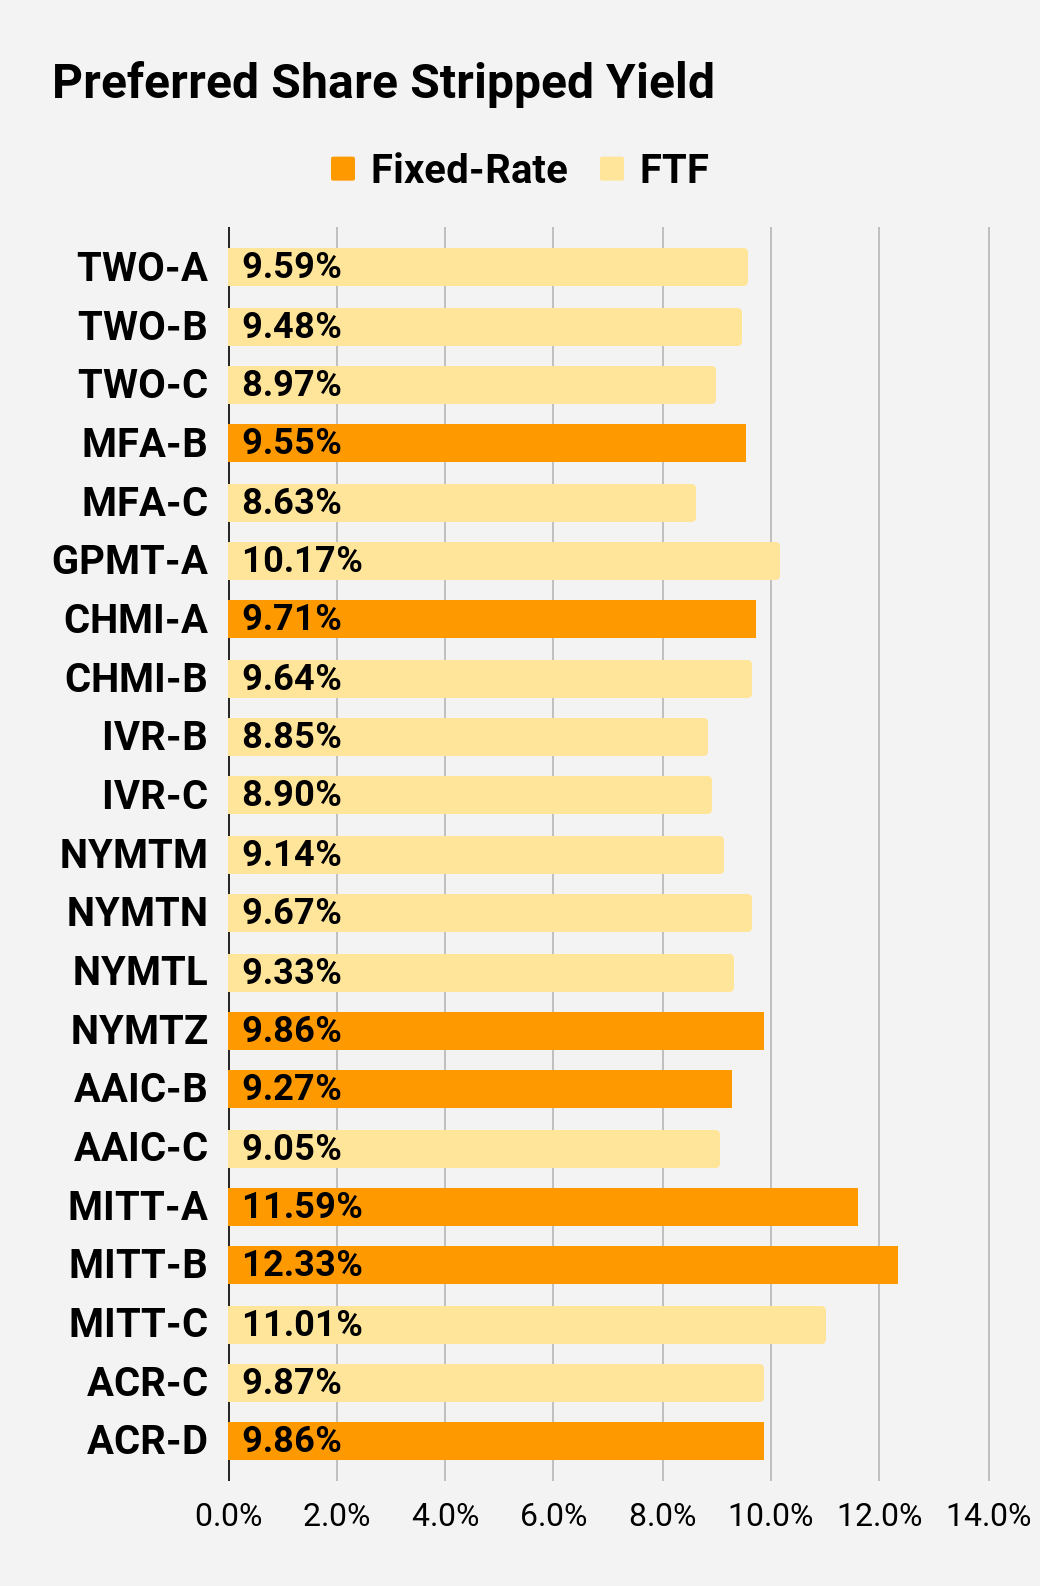 The REIT Forum | 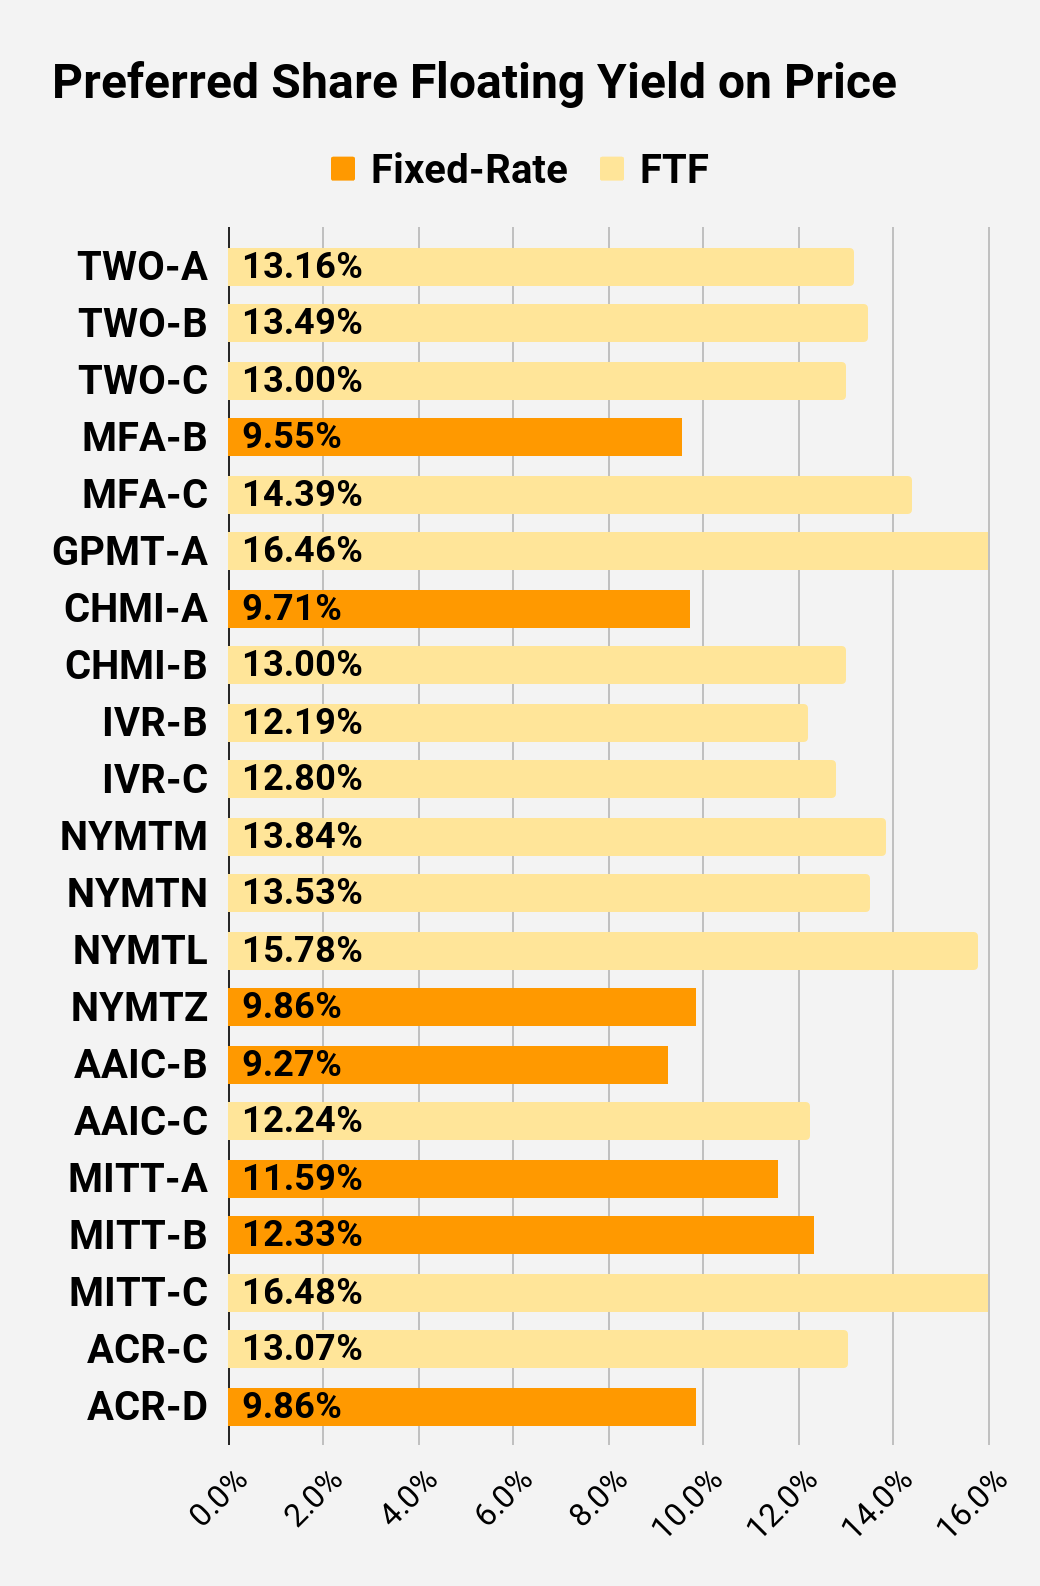 The REIT Forum |
Preferred Share Data
Beyond the charts, we’re also providing our readers with access to several other metrics for the preferred shares.
After testing out a series on preferred shares, we decided to try merging it into the series on common shares. After all, we're still talking about positions in mortgage REITs. We don’t have any desire to cover preferred shares without cumulative dividends, so any preferred shares you see in our column will have cumulative dividends. You can verify that by using Quantum Online. We’ve included the links in the table below.
To better organize the table, we needed to abbreviate column names as follows:
- Price = Recent Share Price - Shown in Charts
- BoF = Bond or FTF (Fixed-to-Floating)
- S-Yield = Stripped Yield - Shown in Charts
- Coupon = Initial Fixed-Rate Coupon
- FYoP = Floating Yield on Price - Shown in Charts
- NCD = Next Call Date (the soonest shares could be called)
- Note: For all FTF issues, the floating rate would start on NCD.
- WCC = Worst Cash to Call (lowest net cash return possible from a call)
- QO Link = Link to Quantum Online Page
Ticker | Price | BoF | S-Yield | Coupon | FYoP | NCD | WCC | QO Link | P-Link |
$22.69 | FTF | 7.59% | 6.88% | 10.86% | 4/15/2024 | $3.61 | |||
$25.45 | Floating | 10.22% | 10.37% | 10.46% | 8/10/2023 | -$0.26 | |||
$23.15 | FTF | 7.04% | 6.50% | 11.35% | 10/15/2024 | $3.89 | |||
$21.10 | FTF | 7.27% | 6.13% | 12.11% | 4/15/2025 | $6.59 | |||
$22.22 | FTF | 8.75% | 7.75% | 9.75% | 10/15/2027 | $11.03 | |||
$25.32 | Floating | 10.53% | 10.54% | 10.48% | 8/10/2023 | -$0.02 | |||
$24.68 | Floating | 9.96% | 9.72% | 9.90% | 8/10/2023 | $0.59 | |||
$23.35 | FTF | 7.29% | 6.75% | 11.32% | 6/30/2024 | $3.34 | |||
$20.62 | 8.54% | 7.00% | 8.54% | 1/28/2025 | $7.16 | ||||
$22.79 | FTF | 7.59% | 6.90% | 12.05% | 4/15/2025 | $5.23 | |||
$19.40 | 9.70% | 7.50% | 9.70% | 8/10/2023 | $5.73 | ||||
$21.85 | FTF | 7.74% | 6.75% | 12.27% | 10/30/2024 | $5.27 | |||
$19.52 | FTF | 8.03% | 6.25% | 11.86% | 1/30/2027 | $10.96 | |||
$22.11 | FTF | 9.78% | 8.63% | 10.64% | 4/30/2028 | $13.15 | |||
$22.76 | FTF | 8.41% | 7.50% | 12.67% | 8/15/2024 | $4.61 | |||
$22.65 | FTF | 8.02% | 7.13% | 12.54% | 8/15/2024 | $4.60 | |||
$19.91 | FTF | 8.17% | 6.38% | 13.41% | 2/15/2025 | $7.91 | |||
$21.35 | FTF | 8.37% | 7.00% | 12.51% | 11/15/2026 | $9.80 | |||
$23.36 | FTF | 8.78% | 8.13% | 12.24% | 3/15/2024 | $3.17 | |||
$23.33 | FTF | 8.66% | 8.00% | 12.43% | 6/15/2024 | $3.68 | |||
$18.56 | 9.19% | 6.75% | 9.19% | 8/24/2026 | $11.83 | ||||
$24.34 | Bond | 9.09% | 6.75% | 9.09% | 8/10/2023 | $0.91 | |||
$23.65 | Bond | 8.75% | 6.00% | 8.75% | 8/10/2023 | $1.76 | |||
$19.94 | 10.10% | 8.00% | 10.10% | 8/10/2023 | $5.28 | ||||
$21.50 | FTF | 9.36% | 8.00% | 13.21% | 3/30/2024 | $5.00 | |||
$19.75 | FTF | 9.88% | 7.75% | 13.05% | 9/30/2025 | $9.61 | |||
$21.40 | FTF | 9.41% | 8.00% | 12.79% | 03/30/2024 | $5.10 |
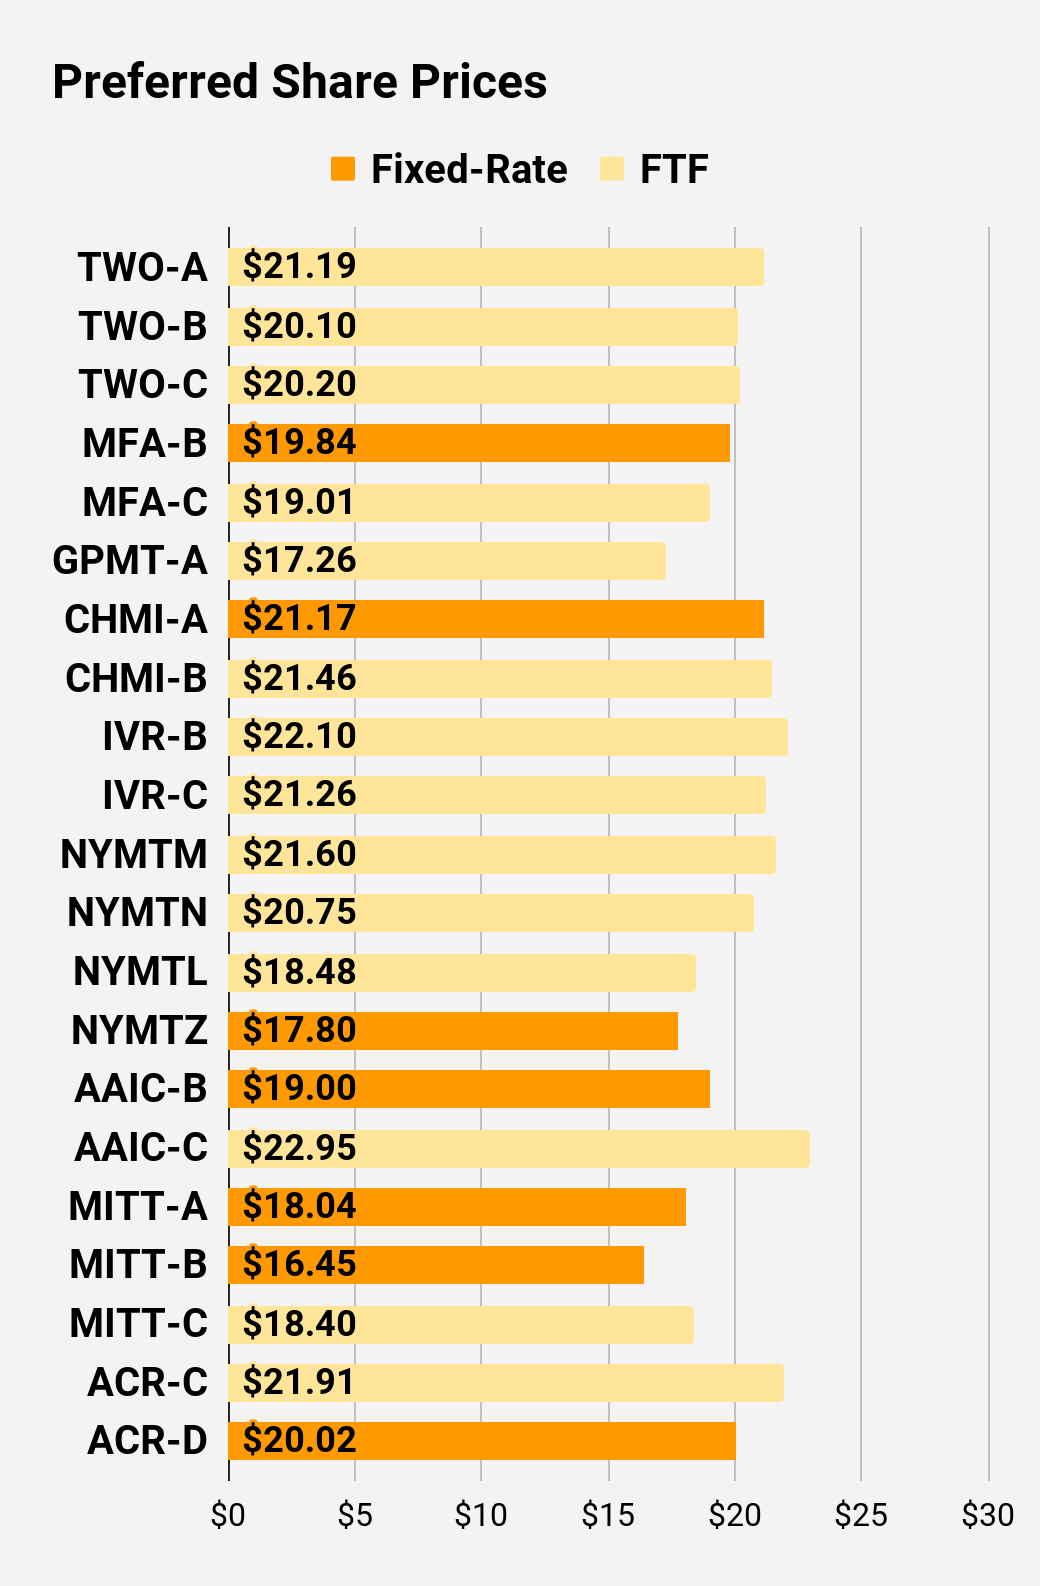
Second Batch:
Ticker | Price | BoF | S-Yield | Coupon | FYoP | NCD | WCC | QO Link | P-Link |
$21.19 | FTF | 9.59% | 8.13% | 13.16% | 04/27/2027 | $11.43 | |||
$20.10 | FTF | 9.48% | 7.63% | 13.49% | 07/27/2027 | $12.52 | |||
$20.20 | FTF | 8.97% | 7.25% | 13.00% | 1/27/2025 | $7.53 | |||
$19.84 | 9.55% | 7.50% | 9.55% | 8/10/2023 | $5.37 | ||||
$19.01 | FTF | 8.63% | 6.50% | 14.39% | 3/31/2025 | $8.84 | |||
$17.26 | FTF | 10.17% | 7.00% | 16.46% | 11/30/2026 | $13.64 | |||
$21.17 | 9.71% | 8.20% | 9.71% | 8/10/2023 | $3.90 | ||||
$21.46 | FTF | 9.64% | 8.25% | 13.00% | 4/15/2024 | $5.01 | |||
$22.10 | FTF | 8.85% | 7.75% | 12.19% | 12/27/2024 | $5.83 | |||
$21.26 | FTF | 8.90% | 7.50% | 12.80% | 9/27/2027 | $11.73 | |||
$21.60 | FTF | 9.14% | 7.88% | 13.84% | 1/15/2025 | $6.36 | |||
$20.75 | FTF | 9.67% | 8.00% | 13.53% | 10/15/2027 | $12.75 | |||
$18.48 | FTF | 9.33% | 6.88% | 15.78% | 10/15/2026 | $12.11 | |||
$17.80 | 9.86% | 7.00% | 9.86% | 1/15/2027 | $13.33 | ||||
$19.00 | 9.27% | 7.00% | 9.27% | 8/10/2023 | $6.13 | ||||
$22.95 | FTF | 9.05% | 8.25% | 12.24% | 3/30/2024 | $3.52 | |||
$18.04 | 11.59% | 8.25% | 11.59% | 8/10/2023 | $7.23 | ||||
$16.45 | 12.33% | 8.00% | 12.33% | 8/10/2023 | $8.81 | ||||
$18.40 | FTF | 11.01% | 8.00% | 16.48% | 9/17/2024 | $9.07 | |||
$21.91 | FTF | 9.87% | 8.63% | 13.07% | 7/30/2024 | $5.25 | |||
$20.02 | 9.86% | 7.88% | 9.86% | 5/21/2026 | $10.51 |
Strategy
Our goal is to maximize total returns. We achieve those most effectively by including “trading” strategies. We regularly trade positions in the mortgage REIT common shares and BDCs because:
- Prices are inefficient.
- Long term, share prices generally revolve around book value.
- Short term, price-to-book ratios can deviate materially.
- Book value isn’t the only step in analysis, but it's the cornerstone.
We also allocate to preferred shares and equity REITs. We encourage buy-and-hold investors to consider using more preferred shares and equity REITs.
Performance
We compare our performance against four ETFs that investors might use for exposure to our sectors:
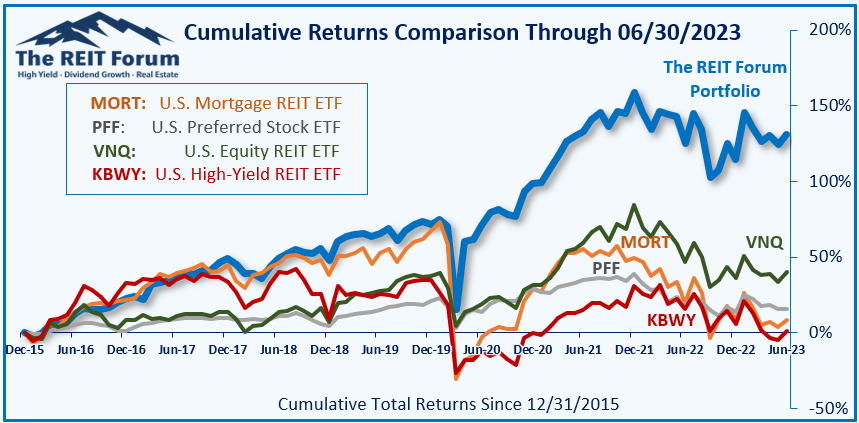
The REIT Forum
The four ETFs we use for comparison are:
Ticker | Exposure |
One of the largest mortgage REIT ETFs | |
One of the largest preferred share ETFs | |
Largest equity REIT ETF | |
The high-yield equity REIT ETF. Yes, it has been dreadful. |
When investors think it isn’t possible to earn solid returns in preferred shares or mortgage REITs, we politely disagree. The sector has plenty of opportunities, but investors still need to be wary of the risks. We can’t simply reach for yield and hope for the best. When it comes to common shares, we need to be even more vigilant to protect our principal by regularly watching prices and updating estimates for book value and price targets.
Ratings: Neutral on DX and NLY, Bearish on ARR
This article was written by

You’ll find several reports on The REIT Forum that don’t get posted to the public side of Seeking Alpha. Many of our public reports are dramatically reduced versions of subscriber articles. If you enjoy our public articles, you’ll love the content we keep for subscribers.
Analyst’s Disclosure: I/we have a beneficial long position in the shares of RITM-D, FBRT-E, GPMT-A, RC-E, DX-C, EFC-A, AGNCP, MFA-C, RITM-C, EFC-B, RITM, SLRC, MFA, GPMT, RC either through stock ownership, options, or other derivatives. I wrote this article myself, and it expresses my own opinions. I am not receiving compensation for it (other than from Seeking Alpha). I have no business relationship with any company whose stock is mentioned in this article.
Colorado Wealth Management Fund and Scott Kennedy are supporting contributors for The REIT Forum. Our ratings and outlooks will often overlap. Any recommendation posted in this article is not indefinite. We closely monitor all of our positions. We issue Buy and Sell alerts on our recommendations, which are exclusive to our members. I have an indirect conflict of interest with ABR and STWD. Neither I, nor any contributor for The REIT Forum, will provide investment advice, reply to questions, or engage in discussions regarding these two mREIT stocks. If you see this article anywhere other than Seeking Alpha or Thereitforum.com, please alert me.
Seeking Alpha's Disclosure: Past performance is no guarantee of future results. No recommendation or advice is being given as to whether any investment is suitable for a particular investor. Any views or opinions expressed above may not reflect those of Seeking Alpha as a whole. Seeking Alpha is not a licensed securities dealer, broker or US investment adviser or investment bank. Our analysts are third party authors that include both professional investors and individual investors who may not be licensed or certified by any institute or regulatory body.
