Phreesia Expects Slower Revenue Growth In Fiscal 2024

Summary
- Phreesia, Inc. provides a suite of patient care software and services to healthcare providers in the U.S. and Canada.
- Management recently guided to slower top line revenue growth in fiscal 2024 than fiscal 2023's growth over 2022.
- The company is still generating large operating losses.
- Until management can retain top line growth while making meaningfully progress toward operating breakeven, I'm on Hold for Phreesia, Inc. stock.
- Looking for more investing ideas like this one? Get them exclusively at IPO Edge. Learn More »
pick-uppath/E+ via Getty Images
A Quick Take On Phreesia
Phreesia, Inc. (NYSE:PHR) provides healthcare IT software to streamline patient processing and communications for healthcare organizations.
I previously wrote about Phreesia with a Hold outlook.
Top line revenue growth is tapering off somewhat and operating losses remain high.
I’m on Hold for Phreesia until management can make further progress reigning in operating losses while retaining strong growth.
Phreesia Overview
New York-based Phreesia was founded in 2005 to provide healthcare organizations with patient onboarding, engagement and payment software solutions.
Management is headed by Director and CEO Chaim Indig, who has been with the firm since the company’s inception and was previously Manager of Spotfire.
Phreesia has developed a suite of end-to-end solutions to manage patient intake processes with an integrated payments solution for the secure processing of patient payments and a channel for life sciences companies to engage patients using targeted and direct communication.
Various features of the Phreesia platform include initial patient contact, registration, appointment scheduling, payments, analysis, reporting as well as post-appointment patient surveys.
Additionally, management says that PHR’s platform is highly customizable and scalable to any size healthcare organization while integrating within a provider client’s workflows and leading Practice Management and Electronic Health Record systems.
Phreesia’s Market & Competition
According to a 2018 market research report by Grand View Research, the global patient care management market is projected to reach $33.3 billion by 2030, growing at a very strong CAGR of 14.4% between 2017 and 2030.
The main factors driving market growth are the increasing emphasis on patient-centric and more efficient care management, the growing burden of healthcare expenditure as well as rapid adoption of technological advancements.
Other factors fueling market growth include a growing geriatric population and a growing incidence of chronic illnesses requiring ongoing management.
The North American region held the largest market share in 2022 due to advancements in the IT solutions sector as well as an increase in demand for affordable and scalable products to reduce healthcare costs.
The European region is projected to grow at a substantial rate due to increasing adoption of advanced health informatics based on a growing emphasis on patient-centric care.
Major competitors that provide or are developing patient care management software include:
Allscripts Healthcare Solutions
Epic Systems
Cognizant
EXL Service
Koninklijke Philips
Cerner
ZeOmega
Medecision
IBM
ZocDoc
PatientPoint.
Phreesia’s Recent Financial Trends
Total revenue by quarter has continued to rise; Operating income by quarter has remained heavily negative, though up from its worst lows.
Total Revenue and Operating Income (Seeking Alpha)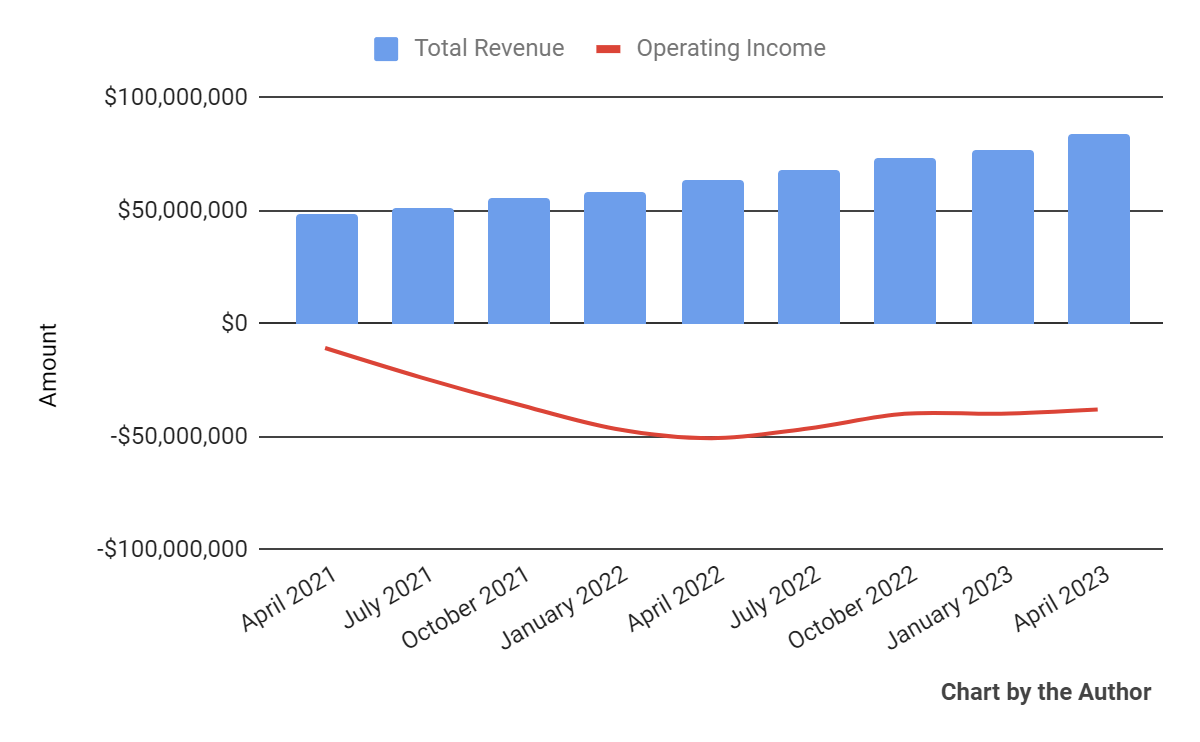
Gross profit margin by quarter has trended higher; Selling, G&A expenses as a percentage of total revenue by quarter have lowered dramatically in recent quarters.
Gross Profit Margin and Selling, G&A % Of Revenue (Seeking Alpha)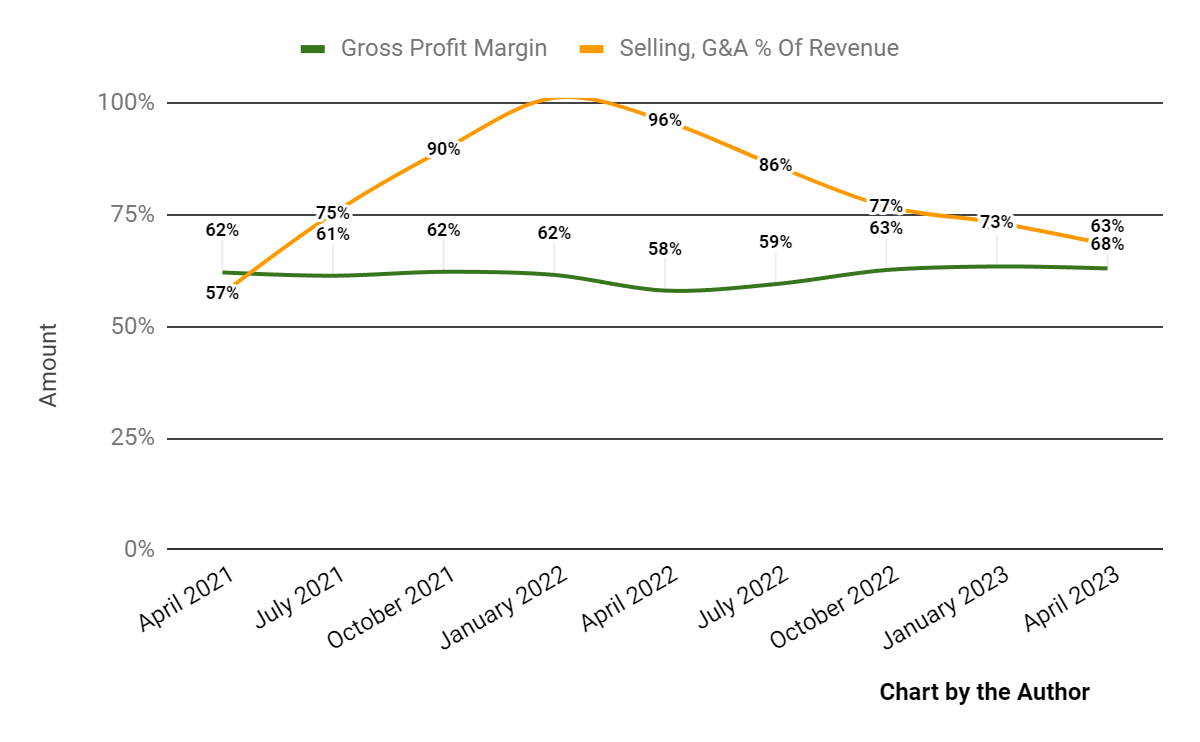
Earnings per share (Diluted) have remained substantially negative, though with some improvement in recent quarters.
Earnings Per Share (Seeking Alpha)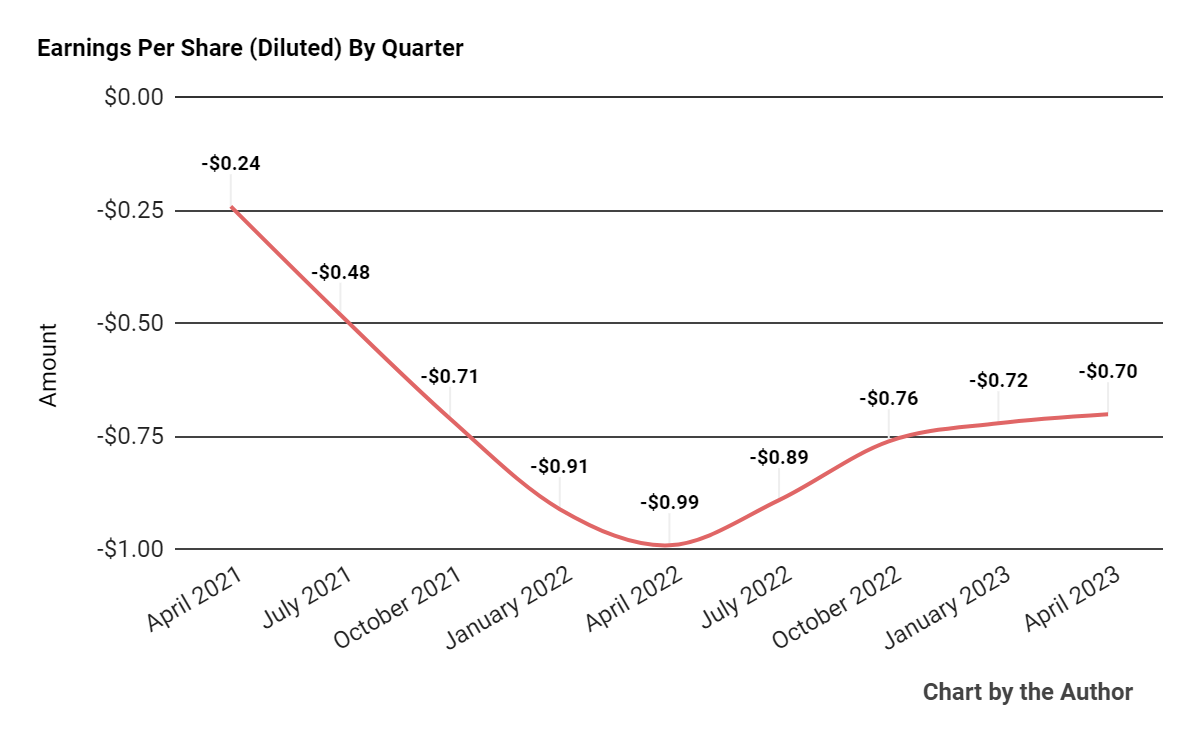
(All data in the above charts is GAAP.)
In the past 12 months, Phreesia’s stock price has risen 27.62% vs. that of the iShares Expanded Tech-Software Sector ETF’s (IGV) growth of 24.1%, as the chart indicates below.
52-Week Stock Price Comparison (Seeking Alpha)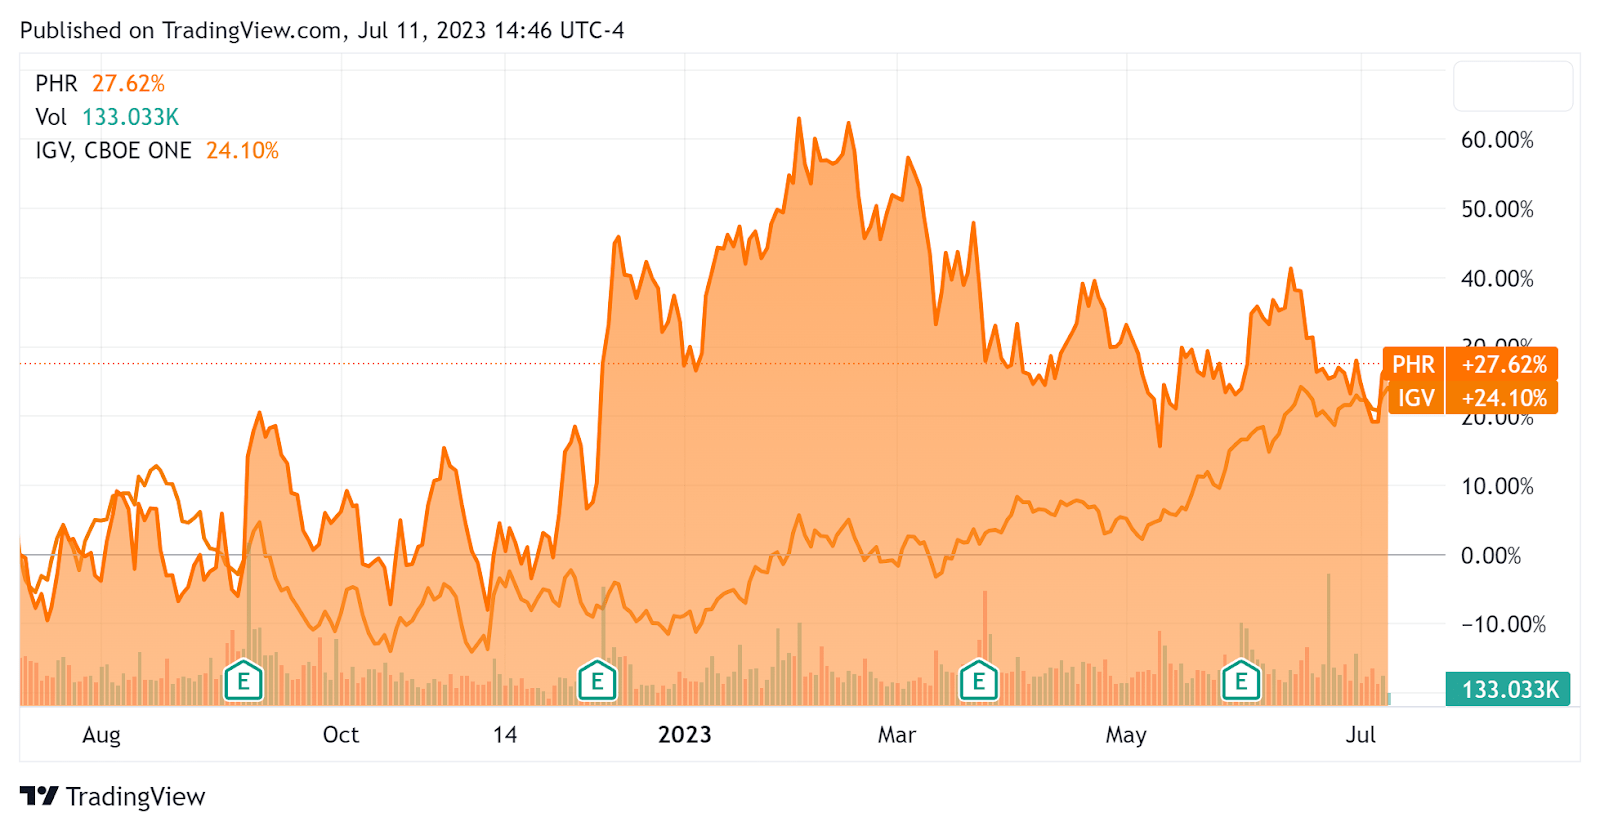
For the balance sheet, the firm ended the quarter with $149.8 million in cash and equivalents and only $0.3 million in total debt, all of which was categorized as the current portion due within 12 months.
Over the trailing twelve months, free cash used was $74.4 million, during which capital expenditures were only $4.3 million. The company paid a hefty $61.8 million in stock-based compensation ("SBC") in the last four quarters, the highest figure in the past eleven quarters.
Valuation And Other Metrics For Phreesia
Below is a table of relevant capitalization and valuation figures for the company.
Measure [TTM] | Amount |
Enterprise Value / Sales | 4.7 |
Enterprise Value / EBITDA | NM |
Price / Sales | 5.1 |
Revenue Growth Rate | 32.0% |
Net Income Margin | -53.9% |
EBITDA % | -47.9% |
Net Debt To Annual EBITDA | 1.3 |
Market Capitalization | $1,560,000,000 |
Enterprise Value | $1,420,000,000 |
Operating Cash Flow | -$70,150,000 |
Earnings Per Share (Fully Diluted) | -$3.07 |
(Source - Seeking Alpha.)
The Rule of 40 is a software industry rule of thumb that says that as long as the combined revenue growth rate and EBITDA percentage rate equal or exceed 40%, the firm is on an acceptable growth/EBITDA trajectory.
PHR’s most recent Rule of 40 calculation was negative (15.9%) as of FQ1 2024’s results, so the firm has performed poorly in this regard due to its high operating losses, per the table below.
Rule of 40 Performance | FQ1 2024 |
Revenue Growth % | 32.0% |
EBITDA % | -47.9% |
Total | -15.9% |
(Source - Seeking Alpha.)
Commentary On Phreesia
In its last earnings call (Source - Seeking Alpha), covering FQ1 2024’s results, management highlighted the firm’s ninth consecutive quarter of greater than 30% revenue growth.
The company had an average of just over 3,300 clients, with subscription services rising 30% YoY and payment processing revenue growing 25%.
Management did not disclose any company, customer or net retention rate metrics.
Total revenue for FQ1 2024 rose 32.2% year-over-year, and gross profit margin increased by 5.0%.
Selling, G&A expenses as a percentage of revenue dropped 27.7% YoY while operating losses narrowed YoY by 25.1%.
Looking ahead, leadership guided to $354.5 million in Fiscal 2024 revenue at the midpoint of the range, or a growth rate of 26.5%.
Adjusted EBITDA, which usually excludes stock-based compensation [SBC] expenses, is expected to be $57.5 million at the midpoint of the range. With SBC included at its trailing twelve-month result, it would be a $119.3 million EBITDA loss.
The company's financial position is in need of improvement, as it currently has only approximately two years of runway before it runs out of cash, at its trailing twelve-month burn rate.
PHR’s Rule of 40 performance has been highly negative due to its high operating losses.
From management’s most recent earnings call, I prepared a chart showing the frequency of key terms mentioned (or not) in the call, as shown below.
Earnings Transcript Key Terms Frequency (Seeking Alpha)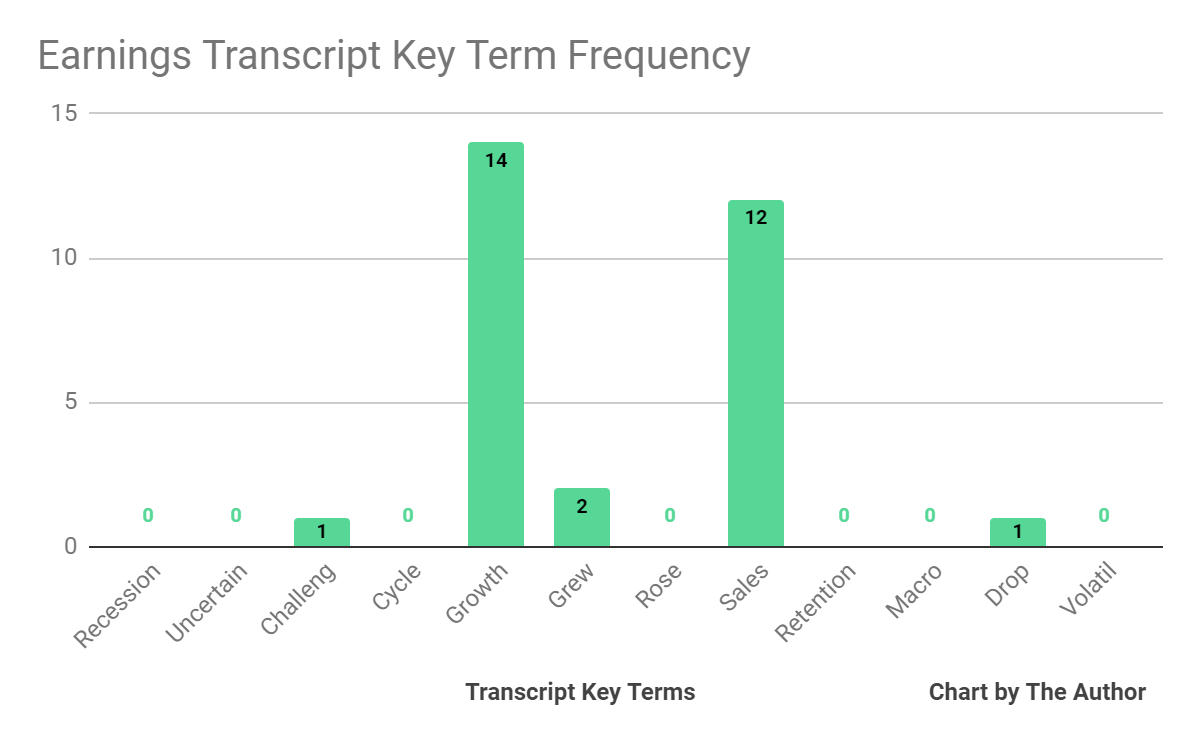
I’m most interested in the frequency of potentially negative terms, so management or analyst questions cited "Challeng[es][ing]" once and "Drop" once. The small number of negative terms is a potentially positive signal, at least as far as topline growth is concerned.
Regarding valuation, in the past twelve months, the firm's EV/Sales valuation multiple has risen 13.1%, as the chart from Seeking Alpha shows below.
EV/Sales Multiple History (Seeking Alpha)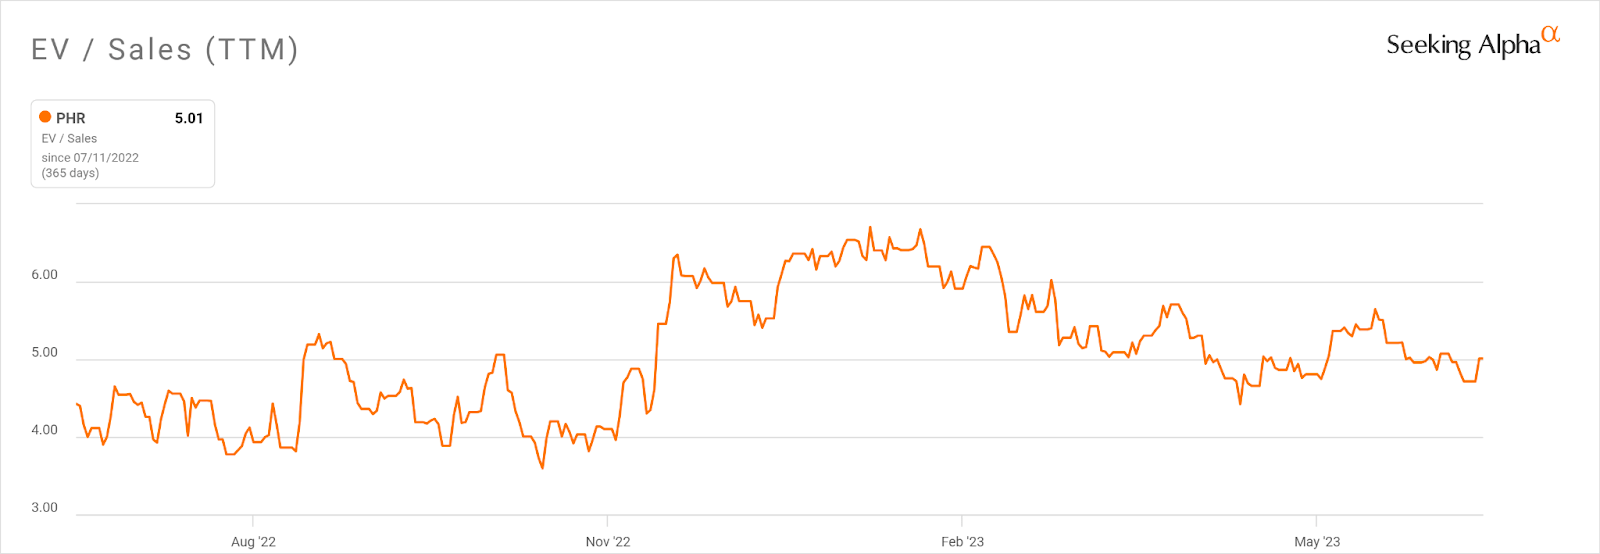
The primary risk for the stock is the drop in the company's top line revenue growth rate, from 32% in FYE 2023 down to 26.5% in FYE 2024.
This drop in growth trajectory combined with still significant operating losses leaves me wondering what the upside catalyst to the stock would be, other than the end of interest rate hikes and the start of rate cuts in 2024.
At least for now, I’m Neutral [Hold] on Phreesia until management can make further progress reigning in operating losses.

Gain Insight and actionable information on U.S. IPOs with IPO Edge research.
Members of IPO Edge get the latest IPO research, news, and industry analysis.
Get started with a free trial!
This article was written by

I'm the founder of IPO Edge on Seeking Alpha, a research service for investors interested in IPOs on US markets. Subscribers receive access to my proprietary research, valuation, data, commentary, opinions, and chat on U.S. IPOs. Join now to get an insider's 'edge' on new issues coming to market, both before and after the IPO. Start with a 14-day Free Trial.
Analyst’s Disclosure: I/we have no stock, option or similar derivative position in any of the companies mentioned, and no plans to initiate any such positions within the next 72 hours. I wrote this article myself, and it expresses my own opinions. I am not receiving compensation for it (other than from Seeking Alpha). I have no business relationship with any company whose stock is mentioned in this article.
Seeking Alpha's Disclosure: Past performance is no guarantee of future results. No recommendation or advice is being given as to whether any investment is suitable for a particular investor. Any views or opinions expressed above may not reflect those of Seeking Alpha as a whole. Seeking Alpha is not a licensed securities dealer, broker or US investment adviser or investment bank. Our analysts are third party authors that include both professional investors and individual investors who may not be licensed or certified by any institute or regulatory body.