The S&P 500: More Upside Ahead

Summary
- With the S&P 500 appreciating by 15% and the Nasdaq by 30% in the first half, many investors are asking what's left for H2?
- While stocks could go through a consolidation/pullback phase in the near-term, high-quality stocks should continue appreciating over the long-term.
- Better-than-expected earnings could provide a constructive near-term catalyst, while the Fed could offer a more accommodative atmosphere for stocks in the long term.
- Moreover, despite the run-up in some stocks, many high-quality equities remain inexpensive.
- My year-end target remains the 4,700-5,000 range for the SPX.
- This idea was discussed in more depth with members of my private investing community, The Financial Prophet. Learn More »
Eoneren
The S&P 500/SPX (SP500) has surged, increasing by about 15% in the year's first half. Moreover, the Nasdaq has been on fire, skyrocketing by a whopping 30% in the same time frame. However, with such massive AI-driven gains in the first half of the year, what's left for the second half? Is the rally over? How much of our profits will we give back?
While these are excellent questions, the best strategy is to invest in high-quality stocks that should beat the market over the long term. The SPX is technically overbought and could go through a pullback/consolidation process soon. However, the intermediate and long-term technical image remains sound, and there are constructive fundamental factors to consider.
The Fed is likely concluding the tightening phase process, and a more accommodating monetary environment could materialize in 2024. Moreover, inflation is moderating, and we should continue seeing progress in the coming months. Furthermore, earnings season is about to start, and better-than-expected results from high-quality companies should enable their stocks to appreciate in the short, intermediate, and long term.
SPX - Still A Bit Overbought In The Near-Term
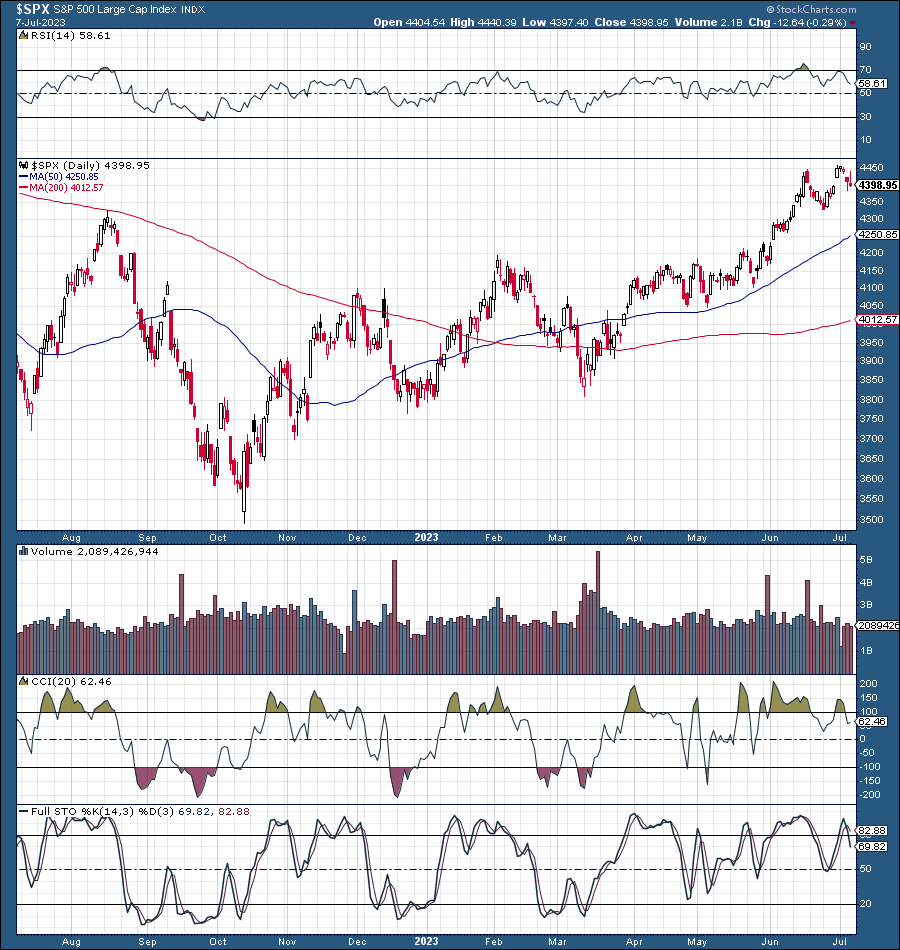
SPX (StockCharts.com)
The S&P 500 has exploded higher, appreciating by about 28% from trough to peak in the recent new bull market phase. However, due to the slightly overheated technical conditions, we could see a transitory pullback/consolidation phase in the near term.
The RSI exceeded 70 in early June, illustrating highly overextended technical conditions. Also, the SPX recently made a possible double top around 4,450, but the RSI made a lower high. This dynamic implies that near-term bullish momentum might be fading, and we could see a correction to around 4,200 or lower before the next up move begins.
Intermediate and longer term, the technical image appears bullish as we continue making higher highs and higher lows, along with the 50-day MA going above the 200-day MA early this year. As the market pulls back or consolidates here, we should look for compelling buying opportunities to advance in the year's second half.
Earnings Season is Finally Here
Significant earnings start rolling this week, and the dynamic of better-than-expected results could be a catalyst to push many stocks higher.
On Thursday, PepsiCo (PEP) reports, followed by (UNH), (JPM), and other big banks on Friday and next week. Also, Tesla (TSLA) will report next Wednesday, and we should see many exciting earnings announcements as the weeks unfold.
Other Significant Earnings In the Next Two Weeks Include: (BAC), (WFC), (BLK), (C), (MS), (NFLX), (GS), (KMI), (HAL), (JNJ), (ABT), (AXP), and (SLB).
Rate Probabilities Imply One More Increase
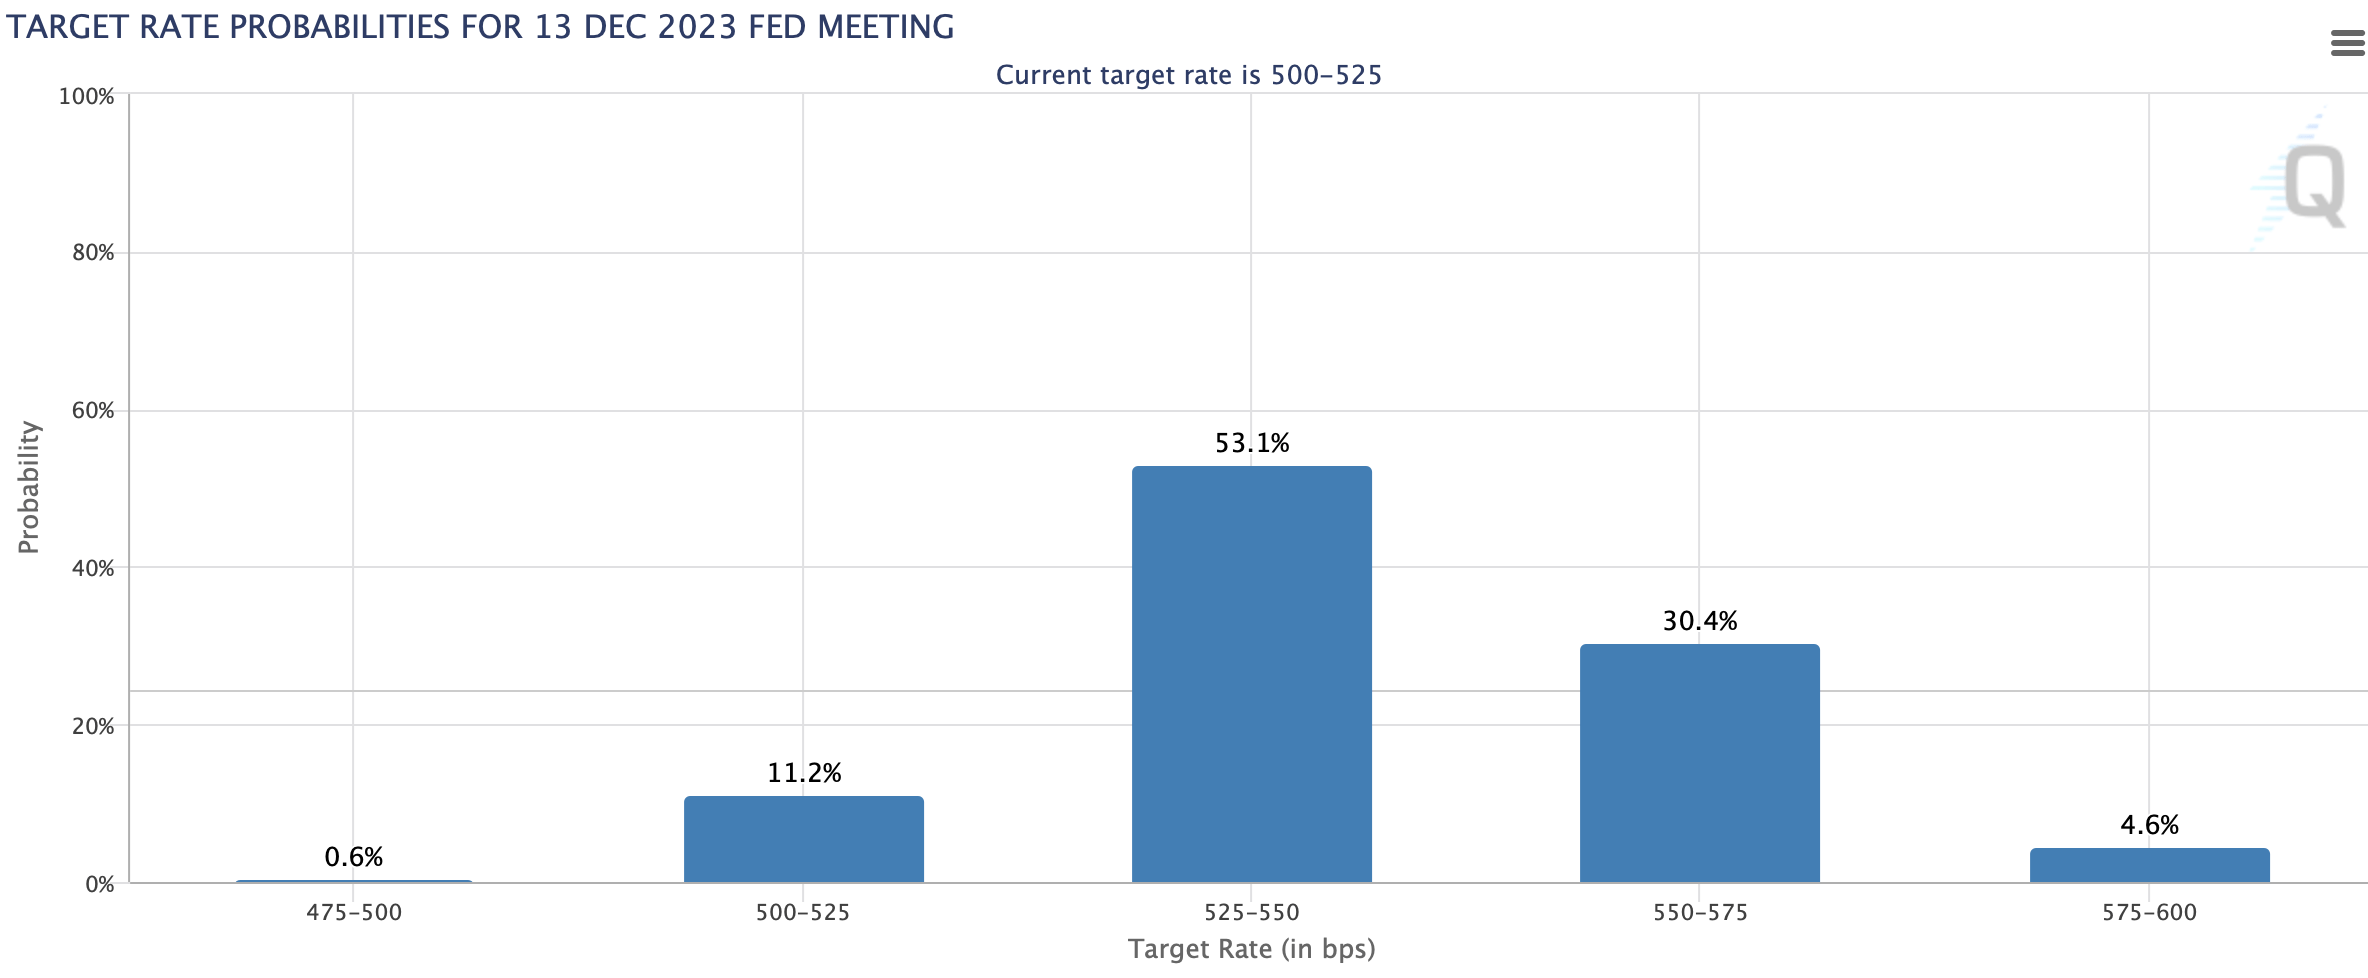
Rate probabilities (CMEGroup.com)
There is about a 65% chance that the benchmark rate will be 5.25-5.5%, or lower, by the end of this year. However, the benchmark is 5-5.25% now. Therefore, another 25 Bps increase won't make much difference. The Fed's main priority is to bring inflation down, and it's done an excellent job of achieving its goal.
Inflation - Lower for Now
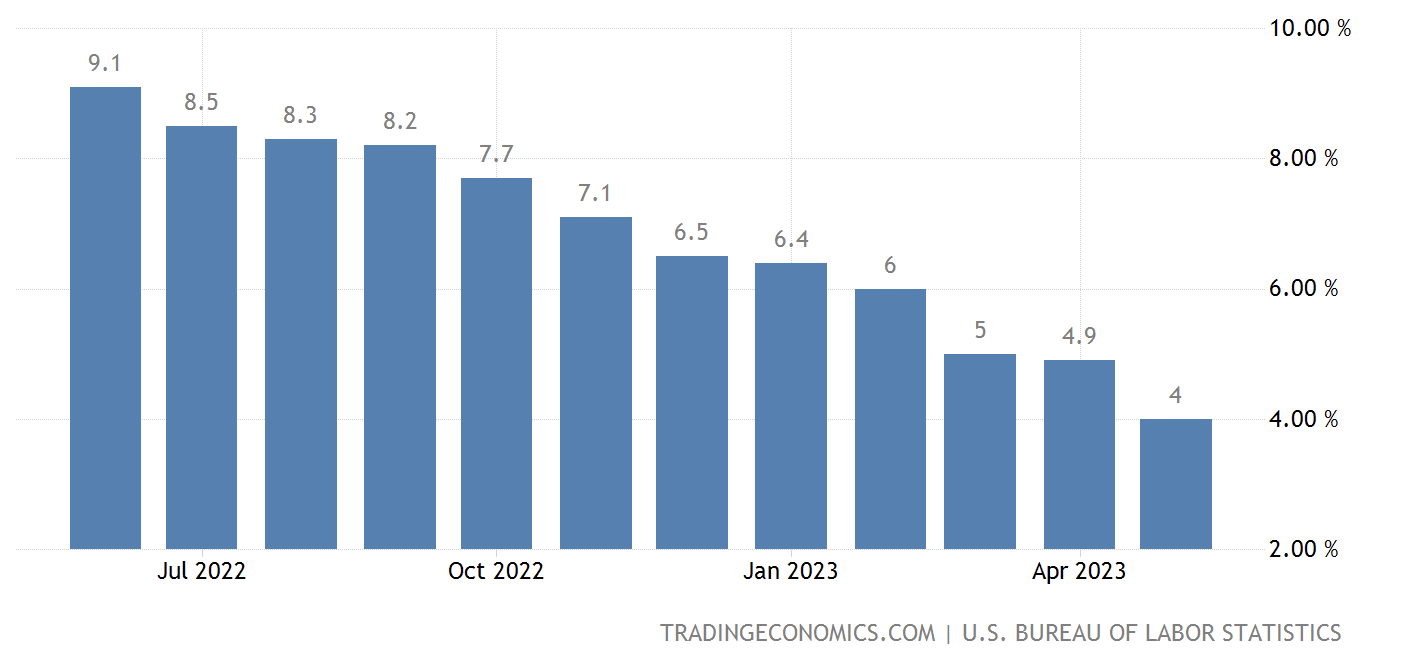
CPI Inflation (tradingeconomics.com)
The Fed cut inflation by more than half in the last twelve months. The Fed has managed better than I had expected. However, it is not likely that the Fed will bring inflation down to a sustainable 2% rate. Instead, we could see the Fed "tolerating" inflation at persistently higher levels of 3-4%. The recent jobs report came in worse than expected, and other growth-related indicators are slowing down. Therefore, the Fed will likely need to jump-start growth soon, which may lead to relatively high inflation levels.
Economic Indicators - Last Week's Numbers

Data (Investing.com)
We saw substantially worse-than-expected manufacturing ISM and PMI numbers early last week. The below 50 readings illustrate contraction, implying substantial difficulties in the manufacturing space. ISM non-manufacturing saw a rise. We could be seeing higher-quality manufacturing jobs being slashed for lower-quality service openings. Moreover, we're finally witnessing weakness in the labor market. The latest confirmed payroll report was 209K, below the 225K estimate. Moreover, the private nonfarm number was only 149K, 51K below June's estimate. Thus, we must observe future employment numbers to ensure there is no significant deterioration in the system.
The CPI Report - Could Move Markets
On Wednesday, we have the crucial CPI inflation report. The CPI may be the most critical inflation gauge and has the potential to move markets. The market expects a core CPI of 5% and a non-core of 3.1%. We want a number roughly in line with or lower than the estimates. We don't want a number that's too hot (above 5.1%) or too cool (below 4.7%) in the core number. A reading of about 4.7-5.1% in the core CPI illustrates that the Fed's plan is working, and we should continue seeing inflation moderate in the months ahead. Therefore, with inflation improving and the labor market weakening, we could see a steady shift toward a more accommodative monetary atmosphere as we move forward.
Valuation Check - Stocks Still Inexpensive Here
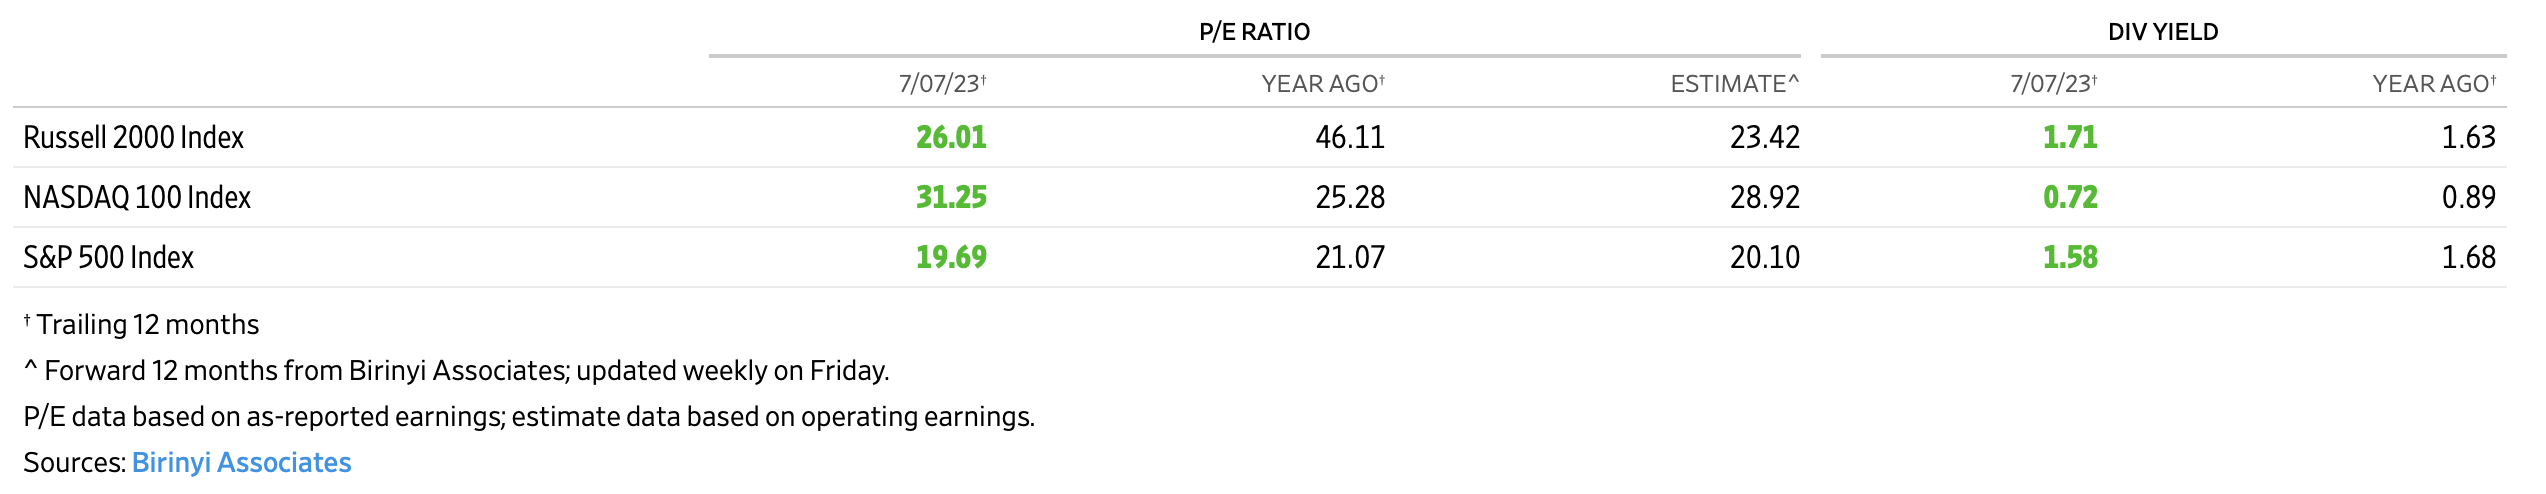
S&P 500 P/E ratio (WSJ.com)
Despite the significant rebound in the S&P 500 and other major averages, stocks are still relatively inexpensive. The S&P 500 is trading only around 19–20 times its earnings. Moreover, the SPX's forward P/E ratio is 20, but it could be lower as many companies could outperform the low-ball estimates as we advance in the coming months. Moreover, the Fed's future shift toward a more accommodative monetary policy should improve earnings and enable multiples to expand in future years.
Also, While the Nasdaq's P/E ratio is slightly above 30, its forward P/E is below 29, which is relatively inexpensive for the tech-heavy index ready to provide substantial growth as we advance. Furthermore, the Russell 2K index trades around 26 times EPS and has a forward P/E ratio of only 23, making small caps appear inexpensive here. This dynamic may be due to considerable buy interest for large-cap stocks lately. Nevertheless, we should see the buying interest trickle down to the smaller-cap quality stocks as we advance. Therefore, quality small/mid-caps, tech, and the top components of the SPX should perform increasingly well as we move forward. The SPX's P/E multiple could expand to around 22 by year-end, implying approximately a 10-15% return for the significant average in the second half is plausible.
The Bottom Line: SPX Could Go Higher in H2 2023
I remain constructive on excellent companies as we advance in the intermediate and long term. Despite the overheated technical conditions and the probability of a near-term pullback/consolidation phase, high-quality companies should continue outperforming in the second half of 2023 and beyond. Moreover, we could see better-than-expected earnings announcements from many companies soon, serving as a near-term catalyst for higher stock prices. Furthermore, the Fed should shift to a more accommodative monetary stance in 2024, serving as a positive catalyst for stock prices in the intermediate and longer term. Due to the recent robust performance, and the likelihood of continued outperformance, my 2023 year-end target for the SPX remains in the 4,700-5,000 range.
QRAre You Getting The Returns You Want?
- Invest alongside the Financial Prophet's All-Weather Portfolio (2022 17% return), and achieve optimal results in any market.
- Our Daily Prophet Report provides crucial information before the opening bell rings each morning.
- Implement our Covered Call Dividend Plan and earn an extra 40-60% on some of your investments.
All-Weather Portfolio vs. The S&P 500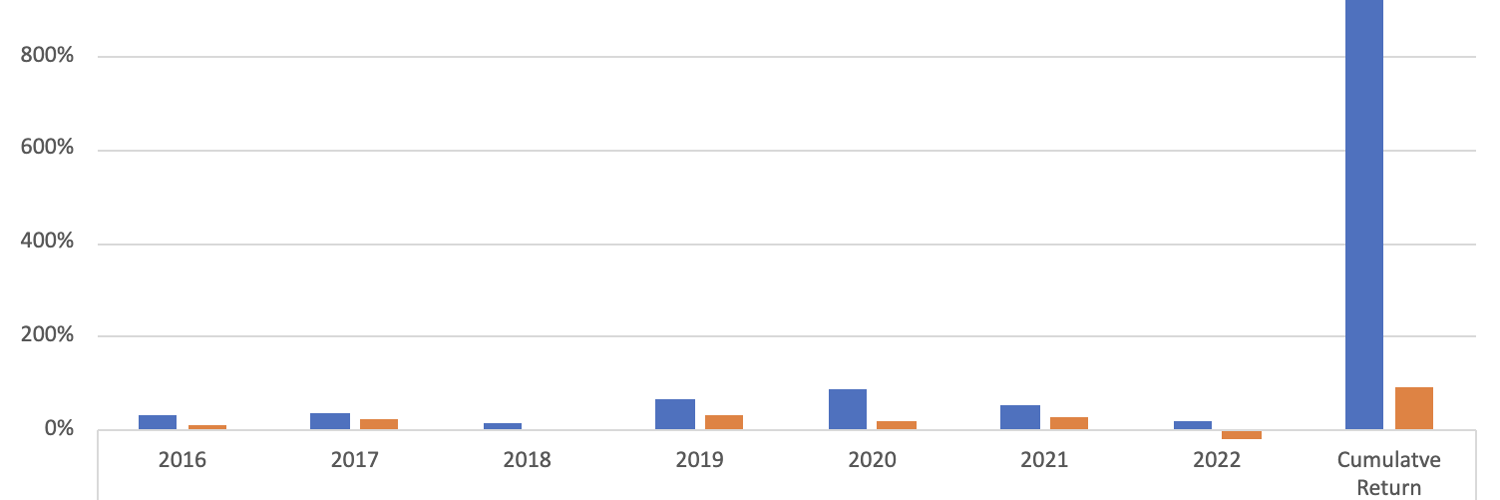
Don't Wait! Unlock Your Own Financial Prophet!
Take advantage of the 2-week free trial and receive this limited-time 20% discount with your subscription. Sign up now, and start beating the market for less than $1 a day!
This article was written by

Hi, I'm Victor! It all goes back to looking at stock quotes in the old Wall St. Journal when I was a kid. What do these numbers mean, I thought? Fortunately, my uncle was a successful commodities trader on the NYMEX, and I got him to teach me how to invest. I bought my first actual stock in a company when I was 20, and the rest, as they say, is history. Over the years, some of my top investments include Apple, Tesla, Amazon, Netflix, Facebook, Google, Microsoft, Nike, JPMorgan, Bitcoin, and others.
Analyst’s Disclosure: I/we have a beneficial long position in the shares of ASSETS MENTIONED either through stock ownership, options, or other derivatives. I wrote this article myself, and it expresses my own opinions. I am not receiving compensation for it (other than from Seeking Alpha). I have no business relationship with any company whose stock is mentioned in this article.
I am long a diversified portfolio with hedges.
Seeking Alpha's Disclosure: Past performance is no guarantee of future results. No recommendation or advice is being given as to whether any investment is suitable for a particular investor. Any views or opinions expressed above may not reflect those of Seeking Alpha as a whole. Seeking Alpha is not a licensed securities dealer, broker or US investment adviser or investment bank. Our analysts are third party authors that include both professional investors and individual investors who may not be licensed or certified by any institute or regulatory body.