Investor Outlook - The Puts To Calls Ratio

Summary
- Proper use of the "puts to calls" ratio provides insight into investor expectations, with high ratios indicating bearish sentiment and low ratios indicating bullish sentiment.
- The current ratio stands at .588, which is in the lowest 20% of historic readings, suggesting the continuation of this bull market.
- The current ratio is a neutral reading. Investors should only worry if or when the ratio first reaches a "red zone" reading.
PashaIgnatov
The Investor Outlook series will focus on specific indicators that measure what investors are thinking and doing about the market. This article looks at the well known "puts to calls" ratio.
The "Puts to Calls" Ratio
Since “call” options are a bet the market will rise and “put” options a bet it will decline, the ratio of “put buying” to “call buying” provides insight into what investors expect. This ratio was developed by market technician Marty Zweig back in 1971, so it has a long history.
The CBOE (Chicago Board Option Exchange) publishes this ratio each day and the Sentiment King then averages the ratio over twenty days. This average helps filter out short-term statistical “noise” and provides longer term investor outlooks.
The ratio acts as a contrary opinion indicator and helps spot when too many investors are either bullish or bearish. History shows you can invest with the crowd for a while, but when the crowd gets too lopsided, it's time to go the other way. The ratio helps find these moments.
The chart below plots this ratio against the S&P 500 for the last seventeen years.
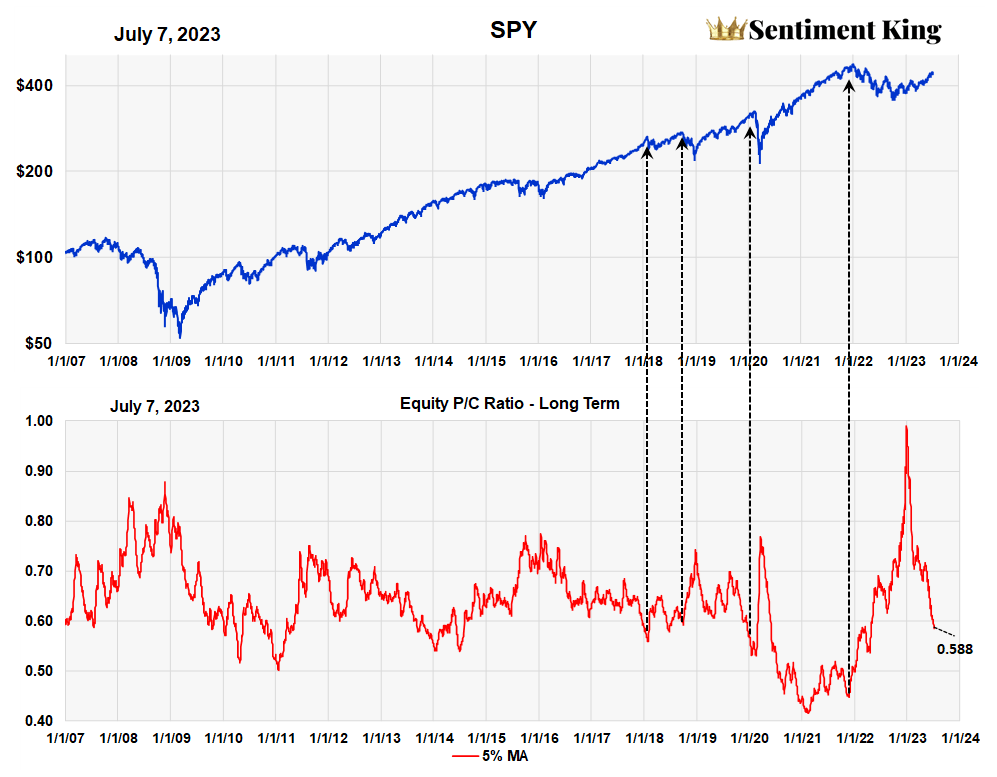
20 Day Average of the Daily Puts to Calls Ratio (Sentiment King)
Historically, a ratio of .75 or more has been a good signal that a decline is over and the market is getting ready to advance. There are simply too many bears. In fact, the record high ratio last November was a major factor that helped us call the end of the bear market (The Equity 'Puts To Calls' Ratio Finally Signals A Bull Market) and the start of a new bull market.
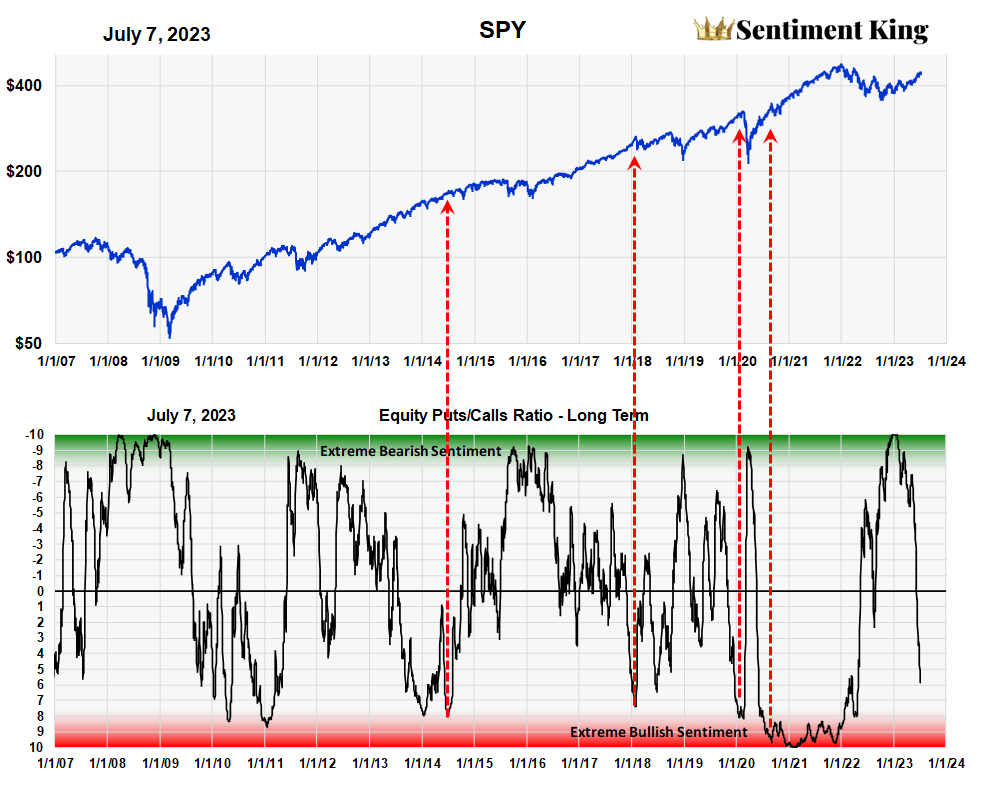
Using the “puts to calls” ratio to find major market tops is less successful. It tends to reach lows early and give false signals. As a general rule, however, ratios of .55 or less usually occur prior to a major decline. We’ve indicated a few with four, dashed arrows.
Unfortunately, these ratios often come before the top of the market, so it's not good at timing the top of markets. For example, the lowest ratio occurred in late January of 2021, a year before the start of the bear market.
However, the ratio has value at early stages of a bull market since the likelihood of a major advance occurring before the ratio gets to .55 or less is very low.
As indicated on the chart, the current ratio is .588. Where does this ratio stand historically?
The Sentiment King's Ranking of the Current “Puts to Calls” Ratio
It is easier to see what the current ratio means when we put it on the Sentiment King ranking scale. The SK ranking scale gives the ratio historical perspective. Green Zone readings mean there are too many bears and red zone readings mean too many people are now bullish. These occur when the ratio is in the top or bottom 10% of historic values.
Ranking of the Puts to Calls Ratio on the SK Ranking Scale (Sentiment King)
There's a large band in between we call the neutral zone and most of the time the ratio lies in this zone. It's important to note that the "puts to calls" ratio only has meaning when it's at extremes – either in the red or green zones; neutral readings have no value.
We can use the ratio at early stages of a bull market since the likelihood of a major decline occurring before the ratio first reaches the red zone is highly unlikely. You can see from the chart that the current ratio of .588 is not in the red zone yet. At +6 the ratio is in the lowest 20% of historic readings. To get to reach the red zone it has to be in the lowest 10% of historic readings.
Conclusion
Since the strong buy signal late last year, the ratio has been declining as fewer investors buy "puts" and more buy "calls." History shows investors don't have to worry about the end of a bull market until the ratio first reaches a red zone reading somewhere during the move. Even then it's not a signal of a market decline.
This article was written by

Analyst’s Disclosure: I/we have no stock, option or similar derivative position in any of the companies mentioned, and no plans to initiate any such positions within the next 72 hours. I wrote this article myself, and it expresses my own opinions. I am not receiving compensation for it (other than from Seeking Alpha). I have no business relationship with any company whose stock is mentioned in this article.
Seeking Alpha's Disclosure: Past performance is no guarantee of future results. No recommendation or advice is being given as to whether any investment is suitable for a particular investor. Any views or opinions expressed above may not reflect those of Seeking Alpha as a whole. Seeking Alpha is not a licensed securities dealer, broker or US investment adviser or investment bank. Our analysts are third party authors that include both professional investors and individual investors who may not be licensed or certified by any institute or regulatory body.
Recommended For You
Comments (7)
CBOE and USI data are very different.
Why is your data better than theirs?

www.cboe.com/...Sincerely,Mike McDonald