M.D.C. Holdings: Not The Best Financially But Has A Margin Of Safety

Summary
- MDC is a cyclical company as its performance is tied to US Housing Starts, where there was no growth in the long-term annual average over the past 70 years.
- MDC had hardly any revenue growth over the past 18 years and should be valued based on its cyclical Earnings Power Value.
- A valuation of MDC on such a basis showed that there are margins of safety. But I have concerns about MDC financial strengths.
Justin Sullivan/Getty Images News
Investment thesis
From 2005 to 2022, M.D.C. Holdings Inc, (NYSE:MDC) revenue grew at a CAGR of 0.8 %. There was hardly any revenue growth. During this period there was a strong correlation between its revenue and Housing Starts.
Housing Starts are cyclical. But over the past 70 years, there was no growth in the long-term annual average Housing Starts. As such, you should view MDC as a no-growth cyclical company.
A valuation of MDC on an Earnings Power Value (EPV) basis showed that there is a 16 % to 41 % margin of safety depending on how you compute the gross profit margins. There is a higher margin of safety if you assumed that there would be a 1/3 increase in the long-term annual average Housing Starts. MDC is thus a potential investment opportunity.
Thrust of my analysis
In my article “Home Builders' Base Rates: A Reference For Better Fundamental Analysis”, I identified 9 listed home builders. These are companies with readily available financial data from 2005 to 2022 – the latest peak-to-peak Housing Starts cycle. MDC is one of the companies on that list.
I had previously determined the intrinsic values of 4 homebuilders based on their performance over the 2005 to 2022 cycle. Refer to the respective articles on Lennar, Toll Brothers, PulteGroup and NVR if you want the details.
I will analyze and value MDC using the same approach as those for the others. You can then compare them on an “apple-to-apple” basis. This is the fifth article in my series to determine the cyclical values of the top 9 homebuilders.
My approach for all the companies can be summarized as follows:
- Verify that the company’s performance is correlated to the Housing Starts. Housing Starts is cyclical thus making the company a cyclical one if there is a strong correlation.
- Determine the normalized or through-the-cycle performance of the company based on the Housing Starts.
- I considered 2 views of the long-term annual average Housing Starts - 1.5 million units and 2.0 million units. For both cases, I assumed that there is no growth in the long-term annual average Housing Starts.
You can read the rationale/basis for the above approach from the previous articles. The crux is determining the normalized earnings. In this context, I used the following equation for the homebuilding operations.
The Gross Profits for the homebuilding operations were computed based on Gross Profits = Deliveries X Selling Price X Cyclical Gross Profit Margins. The Cyclical Gross Profit Margins were assumed to be the average 2005 to 2022 Gross Profit Margins (normalized margins).
The above formula was along the lines of Damodaran's suggestion to reflect the current size of the business. According to him, we should take the current revenue and determine the cyclical earnings by multiplying it with the normalized margins.
MDC has 2 major operations – homebuilding and financial services. The homebuilding is the larger earnings contributor, and I modelled the revenue based on Deliveries X Selling Price.
The financial services operations only contributed less than 3% of the total revenue in 2022. I modelled the revenue for this operation based on a linear regression equation linking its revenue with that of the homebuilding operations. This was derived using the EXCEL plotting function as illustrated in Chart 1.
Chart 1: Link between Finance Services Revenue and Homebuilding Revenue (Author)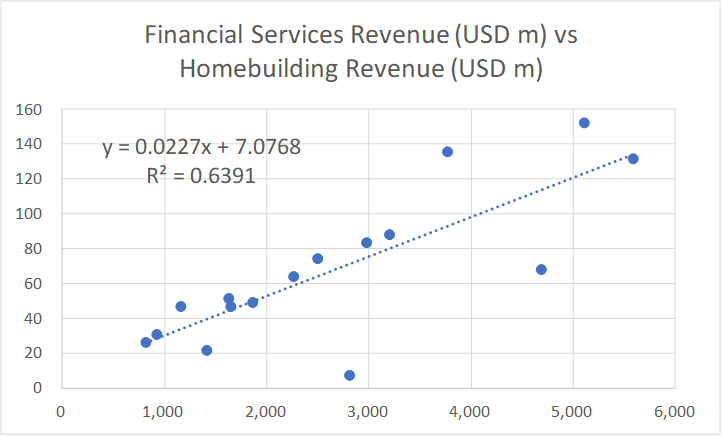
Cyclical sector
MDC operates in a cyclical sector as acknowledged by the company.
In my previous articles of this series, I drew the following conclusions based on my analysis of the Housing Starts and House Price Index. Refer to them for the details.
- Over the past 70 years, there is no growth in the long-term annual average Housing Starts. I took this long-term average as 1.5 million units per year.
- In the past 2 years, Housing Starts seemed to be at the long-term annual average level.
- Over the past 70 years, there have been 4 occasions when the annual Housing Starts had exceeded 2 million units.
- While there is no growth in the annual average Housing Starts, there was long-term price growth. The revenue growth for the homebuilding sector resulted from both volume growth and price growth.
I used these conclusions to determine the various parameters and assumptions for my valuation of MDC.
While nobody disputed the cyclical nature of the sector, we have different views on the long-term annual Housing Starts:
- I have assumed that there is no change to the long-term annual average Housing Starts. My basic argument is that 70 years of data cannot be wrong.
- There are many Seeking Alpha readers who believe that there is some fundamental change to this long-term annual average Housing Starts.
I do not have a crystal ball on how the future will unfold. As such I will value MDC under both views and let you decide what to do. I have already covered the pros and cons of these 2 views in the previous articles. Refer to them.
In addition there is no clear indication of the current direction of the Housing Starts. Is the current drop in Housing Starts is a temporary pullback from an uptrend? Or is it the start of its downtrend leg?
MDC has this to say about the future:
“While we remain confident in the long-term growth prospects for the industry given the underproduction of new homes over more than the past decade, the current demand for new homes is subject to continued uncertainty due to… inflation concerns, the Federal Reserve's continued quantitative tightening…mortgage interest rates, consumer confidence, the current geopolitical environment…” MDC 2022 Form 10k.
We can expect a declining performance for 2023 compared to 2022. But to be fair, MDC did not opine about the direction of the long-term average annual Housing Starts.
Performance
I look at 3 metrics to get an overview of the performance over the cycle – revenue, profit after tax (PAT), and gross profitability (gross profits/total assets).
Chart 2: MDC Performance Index (Author)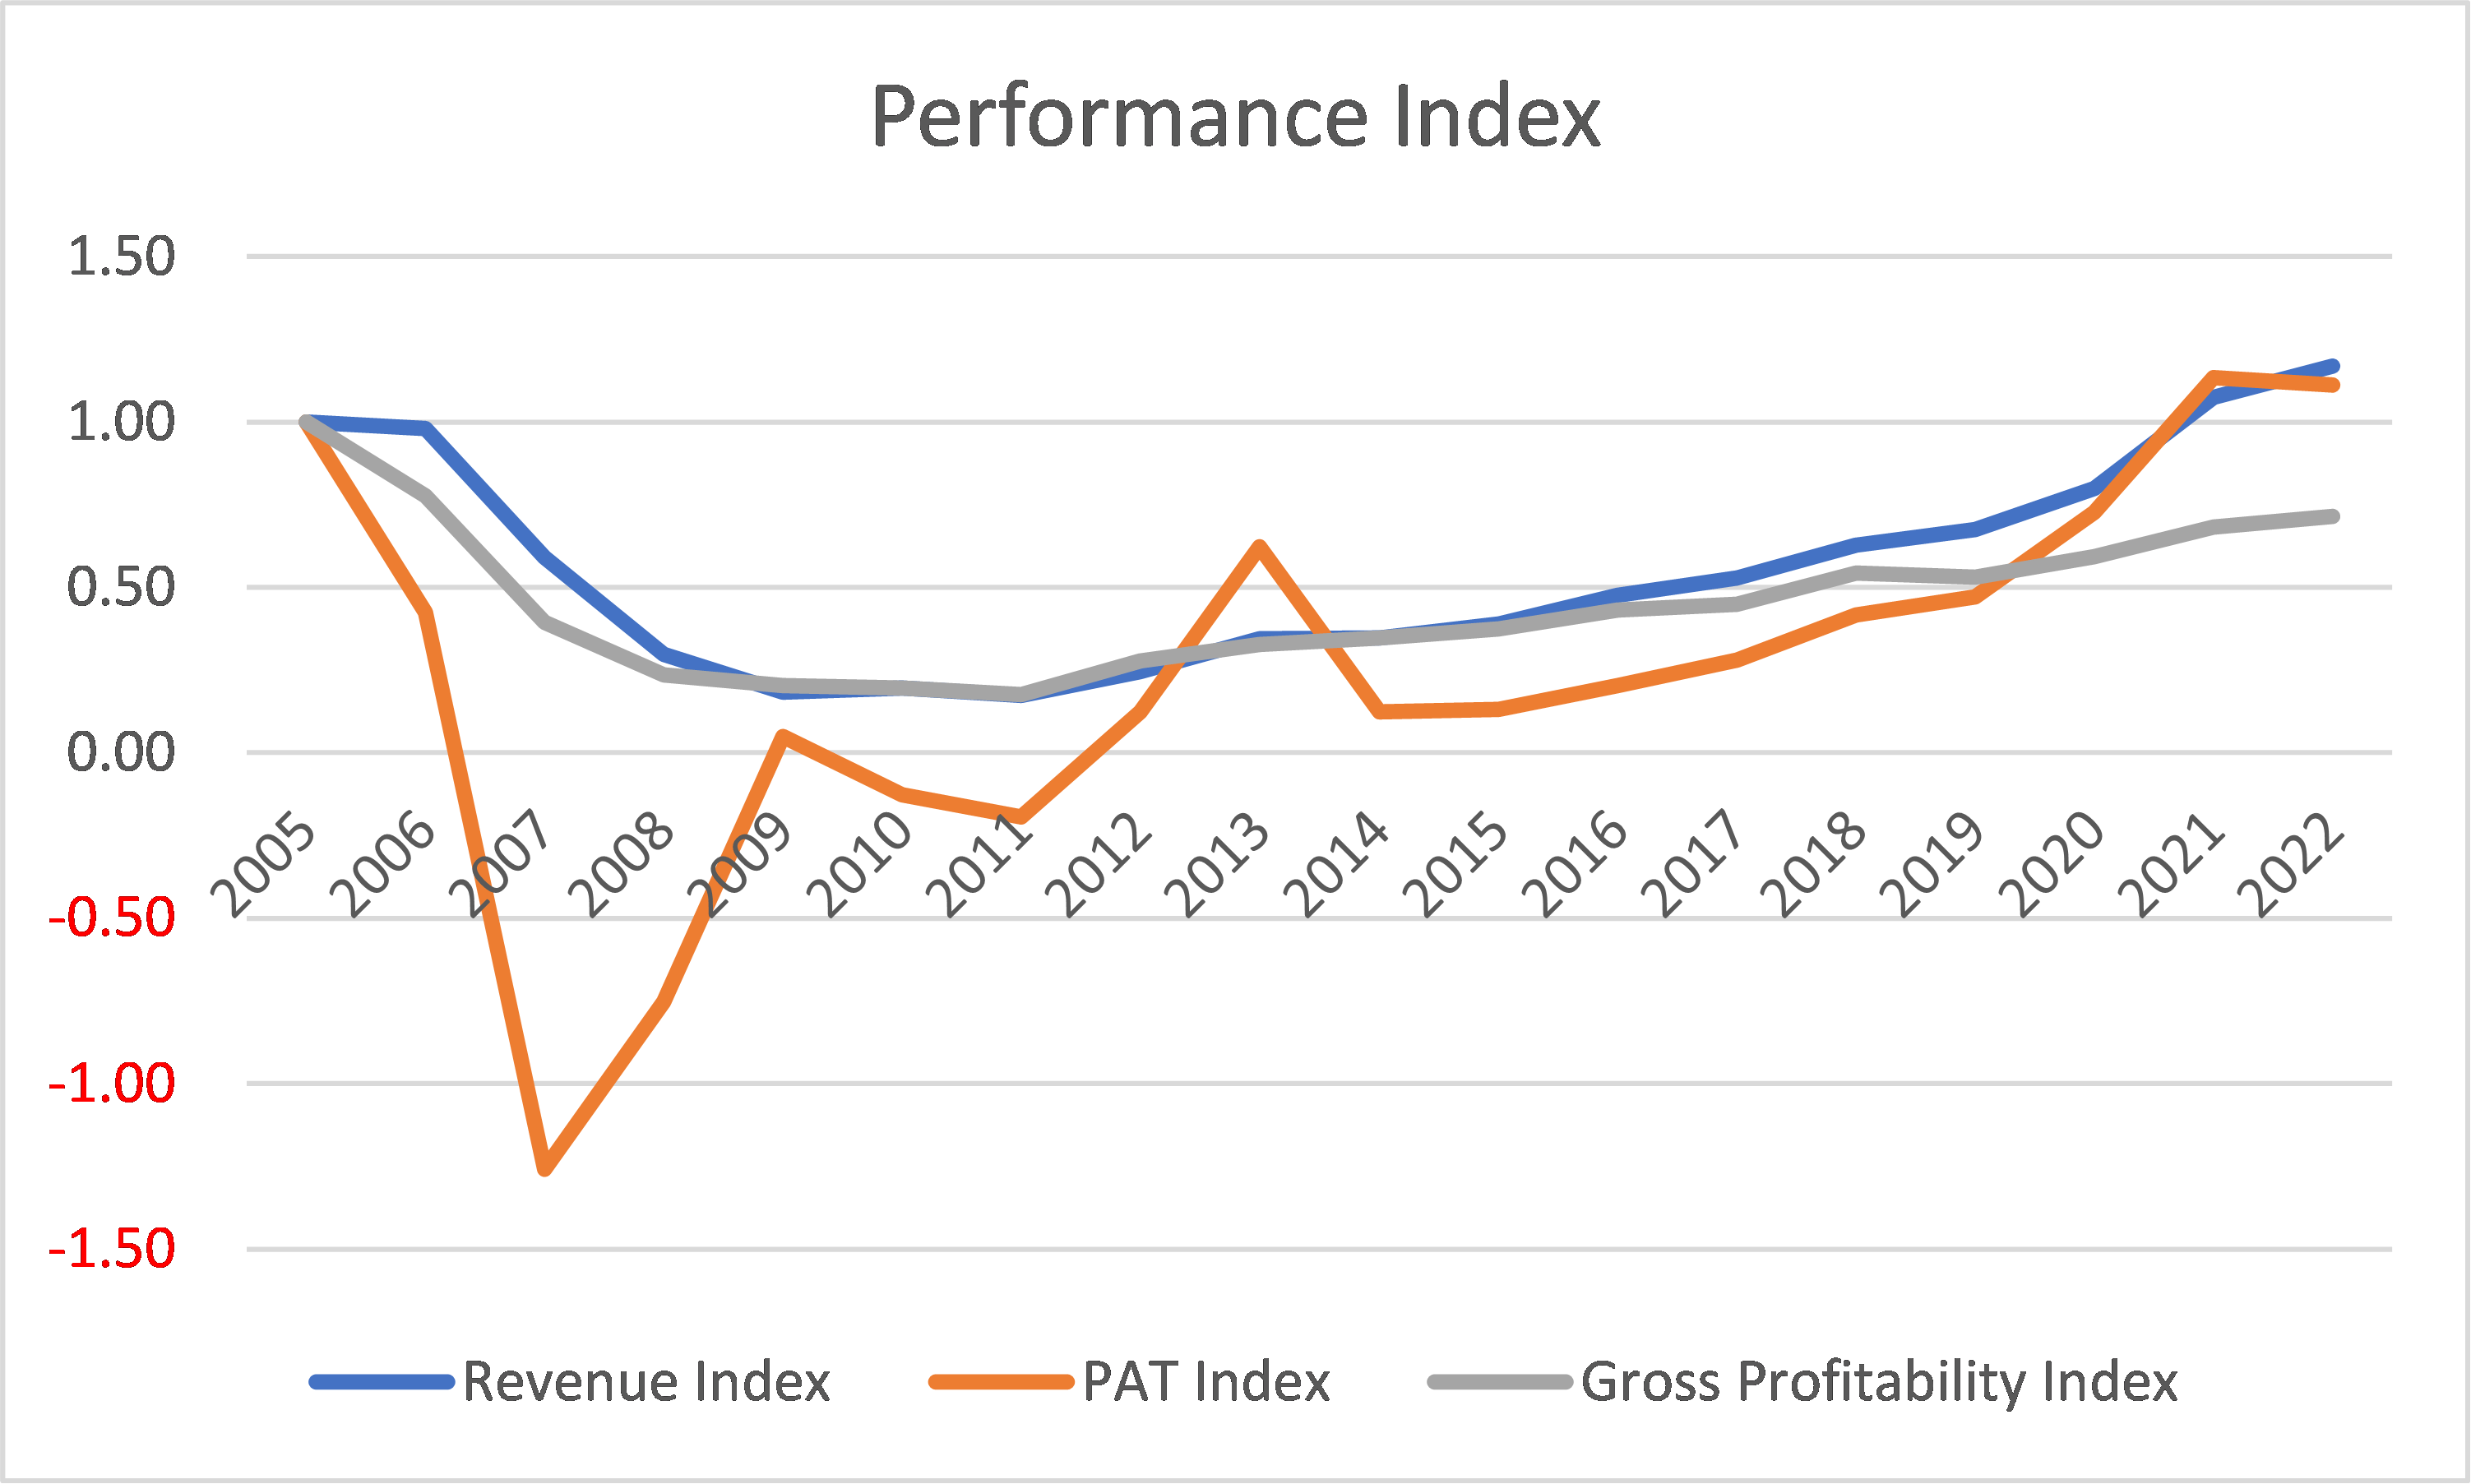
Chart 2 shows the performance of MDC over the 2005 to 2022 cycle. During this period there were:
- 0.86 correlation between MDC revenue and the Housing Starts.
- 0.85 correlation between the US Housing Starts and MDC’s Deliveries.
The conclusion is that MDC is a cyclical company whose performance is tied to the US Housing Starts.
Note the following performances:
- There was hardly any revenue growth from 2005 to 2022. Revenue grew at 0.8 % CAGR over the past 18 years.
- MDC suffered losses in 2007 to 2008, and 2010 to 2011. There was even a loss before tax in 2009. But it managed to be profitable after tax because of a large tax credit.
- Gross profitability in 2022 was lower than that in 2005. In fact, the gross profitability in all the years since 2006 was lower than that in 2005.
A breakdown of the revenue into Deliveries and Selling prices is shown in Chart 3.
Chart 3: Homebuilding Performance Index (Author)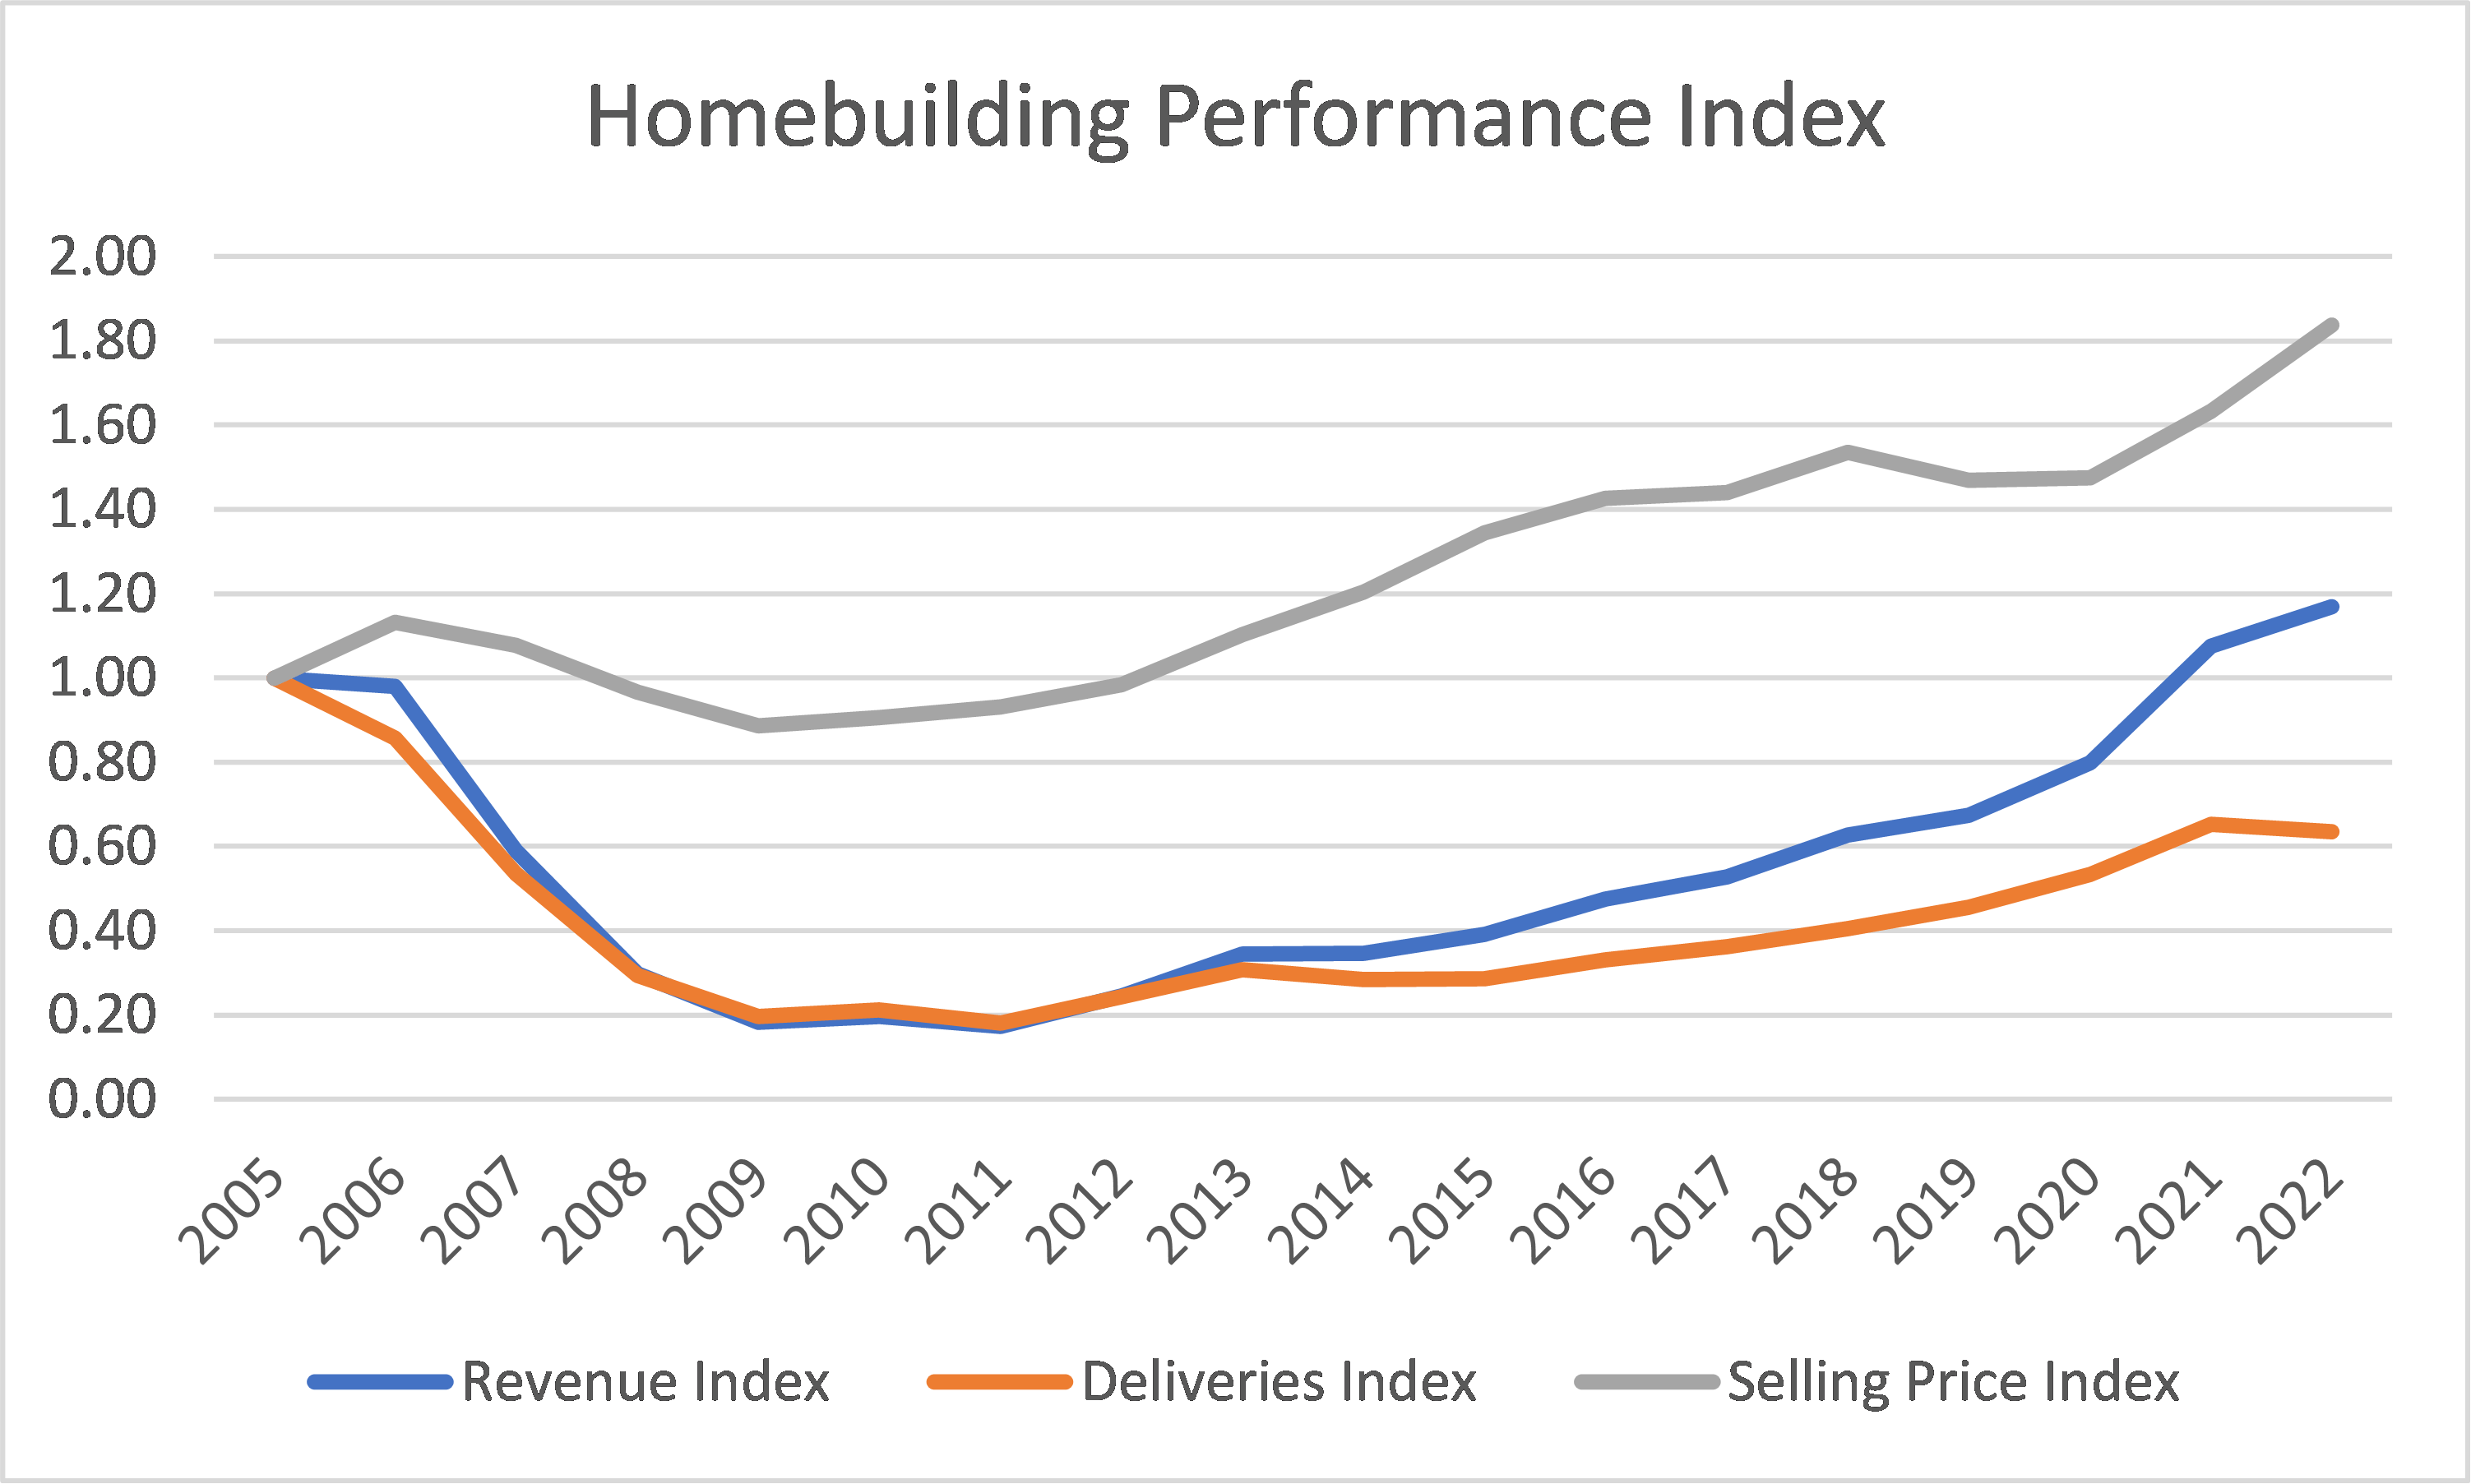
I estimated that during this period physical volume (as measured by Deliveries) shrank at 2.4 % compounded per year while unit selling price grew at 3.3 % CAGR.
The overall revenue growth of 0.8 % CAGR was driven by price growth. Furthermore, it was all organic growth as there was no acquisition.
What does all this mean? MDC is a no-growth company in a no-growth (volume terms) cyclical sector. It is more appropriate to value it based on its EPV.
Financial position
As of the end of Dec 2022, MDC had USD 1.1 billion in cash. This is about 21 % of its total assets. This is a high ratio as the ratios for the Lennar, TOL Brothers and PulteGroup only ranged from 7 % to 12 %. However, NVR had 44 % of cash to total assets.
You may think that this meant that MDC is strong financially. But I have several concerns:
- It has a Debt Equity ratio of 0.55 at the end of 2022. My base rate for the sector was a mean Debt Equity ratio of 0.41 for 2022.
- Over the past 18 years, it generated an average of USD 72 million per year in Cash Flow from Operations compared to the average PAT of USD 126 million per year. The mean Cash Flow from Operations over the same period for my base rate was USD 328 million.
- It managed to generate positive Cash Flow from Operations annually only for half of years from 2005 to 2022. Among the 9 panel companies (including MDC), there was only 2 companies that did worse than MDC.
I would like cyclical companies to be financially sound going into the downtrend leg of a cycle as I do not know how severe the downtrend will be. I do have some concerns here.
Valuation
I valued MDC based on the EPV using the single-stage Free Cash Flow to the Firm (FCFF) model.
I focused on 3 Scenarios:
- Scenario 1. I assumed that 2021/22 represented the long-term annual average Housing Starts of 1.5 million units.
- Scenario 2. This assumed that the long-term annual average Housing Starts was increased to 2.0 million units.
- Scenario 3 – This assumed a non-cyclical scenario. I assumed that the 2021 and 2022 performances represented the long-term performance. As such I used the actual average 2021 and 2022 Gross Profit Margins.
Table 1 summarized the results. You can see that there is 16 % margin of safety under Scenario 1. But this is below my target of 30% margin of safety.
But the margins of safety under Scenarios 2 and 3 are greater than my 30 % target.
While there is a margin of safety under Scenario 3, I do not think that this is realistic as the evidence points to MDC being a cyclical company.
Note that the value under Scenario 2 is over-estimated as it assumed that we are now at the 2.0 million units of Housing Starts. It would take a few more years to reach this level and the valuation would be reduced accordingly. But I did not estimate the impact of this as the current margin of safety is very large.
Table 1: Summary of MDC Valuation (Author)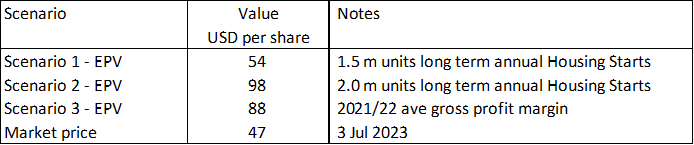
Sensitivity analysis
For the valuation shown in Table 1, I took the average Gross Profit Margins for each year from 2005 to 2022.
But in my earlier Lennar article, I had computed the normalized Gross Profit Margins = (sum of 2005 to 2022 Gross Profits) divided by the (sum of the 2005 to 2022 revenue).
This was different from what I did for MDC above.
If I had adopted the Lennar approach, the value of MDC would be about 16% to 21 % higher as shown in Table 2.
- Under Scenario 1, there is now a 41 % margin of safety.
- Under Scenario 2 we already had a large margin of safety based on the earlier assumptions. Changing how the average gross profit margins are computed does not change the conclusion here.
Table 2: Value with a different basis for estimating the gross profit margins (Author)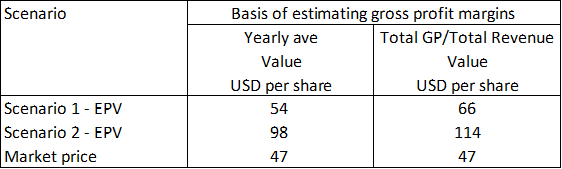
Valuation model
I valued MDC on the same basis as I did for the other homebuilders using the single-stage Free Cash Flow to the Firm (FCFF) model.
Value of the operating assets of the firm = FCFF X (1 + g) / (WACC – g)
Where:
FCFF = EBIT X (1 – t) X (1 – Reinvestment rate)
g = growth rate = zero under the EPV.
t = tax rate based on the past 3 years average rate.
WACC = weighted average cost of capital derived from the first page of a Google search for the term “MDC WACC” as summarized in Table 3.
Table 3: Estimating the WACC (Various)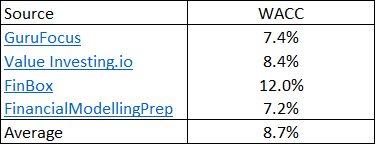
Reinvestment rate = zero under the EPV model.
EBIT = Gross profits – Selling, Admin, and Selling or SGA expenses – Other expenses and asset write-downs.
Gross Profits
The Gross Profits for MDC were derived as shown in Table 4. The key assumption here is that the sector was operating at the long-term annual average Housing Starts in 2021/22. As such the average 2021/22 Deliveries and Selling Price represented the cyclical performance.
Table 4: Deriving the Gross Profits (Author)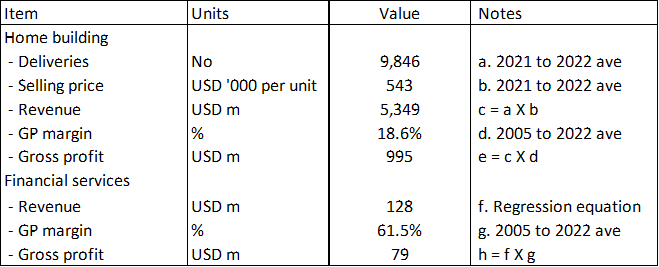
The Gross Profits for the homebuilding operations = Deliveries X Selling Price X Gross Profit Margins.
The Gross Profits for the financial services operations = Revenue X Gross Profit Margins.
The cyclical Gross Profit Margins for both operations were assumed to be the 2005 to 2022 average values.
The revenue for the financial services we derived based on the linear regression equation using EXCEL as shown earlier in Chart 1 where:
- Revenue for the homebuilding operations was the independent variable.
- Revenue for the financial services operations was the dependent variable.
Sample calculation
Table 5 shows a sample calculation for the intrinsic value.
Table 5: Calculating the intrinsic value (Author)
Notes to Table 5: Over the past 18 years, MDC incurred some asset write-downs and other one-off charges. I included the average in my valuation.
Risks and limitations
I would summarize the risks and limitations of my valuation into 3:
- Low WACC.
- Regression equation.
- 2021/22 averages
Part of the reason for the 8.7 % WACC was because of the current high risk-free rate and equity risk premium. This is due to the uncertainty associated with the high inflation rates, possible recession, and the Ukraine invasion. If you are going to look at the value over the cycle, I would argue that you should also consider the values over the cycle. This meant that my valuation is conservative.
In my analysis and valuation, I derived the financial services revenue using the linear regression equation. There is a 0.64 R-squared value for this equation. In other words, the equation only explained about 2/3 of the changes in the revenue. I would have preferred a higher R-squared. In mitigation, the financial services are very small as they contributed less than 3 % of the total revenue in 2022.
2021/22 averages
The average annual Housing Starts in 2021/22 is about 1.5 million units, which is about the same as the long-term average annual Housing Starts.
As such I have assumed that the average 2021/22 values for the key parameters - Deliveries and Selling Price - were good representations of the cyclical values.
I have used this to determine the Deliveries and Selling Prices for Scenario 1.
But if you accept this argument, shouldn’t the 2021/22 average Gross Profits also represented the cyclical Gross Profits?
Using this 2021/22 average as the value for item “i” in my valuation model as per Table 5, I obtained an intrinsic value of USD 89 per share. This is equal to a 90% margin of safety.
We now have 2 different values based on different approaches for estimating the intrinsic value over the cycle – Scenario 1 and this gross profit method.
Which is more representative? I am not sure how to answer this yet and would like to get feedback from the readers.
Conclusion
MDC is no-growth company in a no-growth cyclical sector. Any analysis, and valuation of MDC should be based on its EPV over the cycle.
I assumed that the cycle is represented by the 2005 to 2022 performance. This is pegging it to the latest peak-to-peak Housing Starts cycle.
My valuation of MDC on an EPV basis and over the cycle showed that there is a 16% to 41 % margin of safety depending on how you calculate the gross profit margins. This is based on the view that there is no growth in the long-term annual average Housing Starts under Scenario 1
If you assumed that there is a 1/3 increase in the long-term annual average Housing Starts as per Scenario 2, the margin of safety would be greater than my 30% cut-off.
Of the 5 companies that I have covered so far, MDC is the only one that have substantial margins of safety. MDC is hence a potential investment opportunity. However, I would like to hold off until I have covered the balance 4 homebuilders. This is because I would only invest in one homebuilder from a risk mitigation perspective.
While there are margins of safety for MDC, I do have some concerns about its financial strengths. It is obvious that this is one metric I would use when comparing with the balance 4 homebuilders.
I differentiate between a good company and a good investment. A good company is one that is fundamentally sound. A good investment is one with a high margin of safety. I would like to have a good investment and a good company. But I would choose a good investment over a good company if forced to.
MDC seems to fall into the category of a good investment and a not-so-good company. I am still hunting for a good investment cum good company.
I am a long-term value investor and my analysis and valuation is based on the long-term prospect of a company. This is not an analysis for those seeking to make money over the next few weeks or months.
This article was written by

Analyst’s Disclosure: I/we have no stock, option or similar derivative position in any of the companies mentioned, and no plans to initiate any such positions within the next 72 hours. I wrote this article myself, and it expresses my own opinions. I am not receiving compensation for it (other than from Seeking Alpha). I have no business relationship with any company whose stock is mentioned in this article.
Seeking Alpha's Disclosure: Past performance is no guarantee of future results. No recommendation or advice is being given as to whether any investment is suitable for a particular investor. Any views or opinions expressed above may not reflect those of Seeking Alpha as a whole. Seeking Alpha is not a licensed securities dealer, broker or US investment adviser or investment bank. Our analysts are third party authors that include both professional investors and individual investors who may not be licensed or certified by any institute or regulatory body.