Top Piotroski-Graham Long-Term Value Portfolio: 2023 Returns +32.6% YTD With New Semi-Annual Selections

Summary
- The 1-year dividend adjusted returns for July 2022 are +25.65% and the current January 2023 dividend adjusted returns are +35.6% YTD.
- The past 5 value portfolios have returned: Jan 2023 +32.6%, Jul 2022 +19.89%, Jan 2022 +26.64%, Jul 2021 +13.02%, Jan 2021 +78.70%, not including large dividends.
- A return to value investing is expected in 2023 and this enhanced model strongly outperforms even without applying the Momentum Gauges to avoid downturns.
- All 10 of the current January stocks are positive with 7/10 stocks gaining over 10% and as much as +146.6% YTD from SKYW.
- These value portfolios have outperformed the S&P 500 every year since the model's inception in 2017 and the 2-year weighted average portfolio returns are 42.7%.
- Looking for a helping hand in the market? Members of Value & Momentum Breakouts get exclusive ideas and guidance to navigate any climate. Learn More »

Michele Ursi/iStock Editorial via Getty Images
Introduction
These selections continue as ongoing tests and active portfolios exclusively for readers looking for value stocks. This approach uses one of the best fundamental value models in peer-reviewed financial literature with my additional customized enhancements. The schedule of portfolio selections, research analysis, and the 2023 forecast article for members are available here:
- Forecasting The S&P 500 For 2023: Year Of The Fed-Pivot And More Record Volatility (SP500)
- MDA Breakout Strategies: How To Trade For Maximum Returns
Top Piotroski-Graham Long Term Value Portfolio: 2023 Returns +32.61% With New July 2023 Semi-Annual Selections
These top selections for the mid-year July 2023 bonus selections comprise the 24th portfolio since 2017 formed to test the one-year buy/hold portfolios of the Joseph Piotroski Value algorithm that remains one of the best-performing value-based selection models in peer-reviewed financial research. The portfolios are now released 2 times per year with the last 2 articles:
- Top Piotroski-Graham Long Term Value Portfolio: 2022 Returns +13.1% With New January 2023 Semi-Annual Selections
- Top Piotroski-Graham Long Term Value Stocks: July 2022 Semi-Annual Selections
The benefits to financial statement analysis are concentrated in small and medium-sized firms, companies with low share turnover, and firms with no analyst following, yet this superior performance is not dependent on purchasing firms with low share prices. A positive relationship between the sign of the initial historical information and both future firm performance and subsequent quarterly earnings announcement reactions suggests that the market initially underreacts to the historical information. ~ Joseph Piotroski
Retests of the Piotroski model continue to outperform all other top value algorithm models as recently shown in peer-reviewed financial literature according to Amor-Tapia, B. & Tascón, M.T. (2016). The selections offered here have been improved to include the Benjamin Graham enhancements and additional parameters described in the methods section below.

Public Domain
I am frequently asked, "How long are these selections good to hold?" Both Benjamin Graham and Joseph Piotroski developed their models for 2-year buy/hold periods. Numerous scholarly research studies, some referenced at the end of the article, have tested the algorithm results over 2-year periods with these models outperforming other peer reviewed value selection models. I track all portfolio results for more than 2 years and continue to see strong long term results for more than 3 years.
January 2023 Portfolio Returns
2023 has delivered the best start of the year for the Nasdaq +31.7% since 1983, but nearly 90% of those gains have been unusually concentrated in the 10 largest mega cap stocks. Last year delivered the worst half-year start to the stock market since 1970 and the worst full-year returns since 2008. Those who followed the Momentum Gauges to avoid record downturns can further enhance these portfolio returns.
1-year charts of the major indices
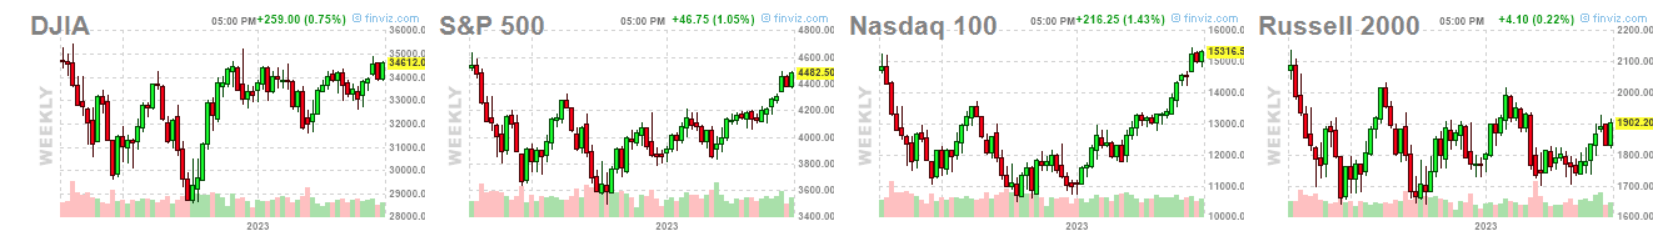
FinViz.com
Despite these large market downturns, the Piotroski-Graham enhanced value portfolios have a two-year weighted average return of +43% NOT including large dividends.
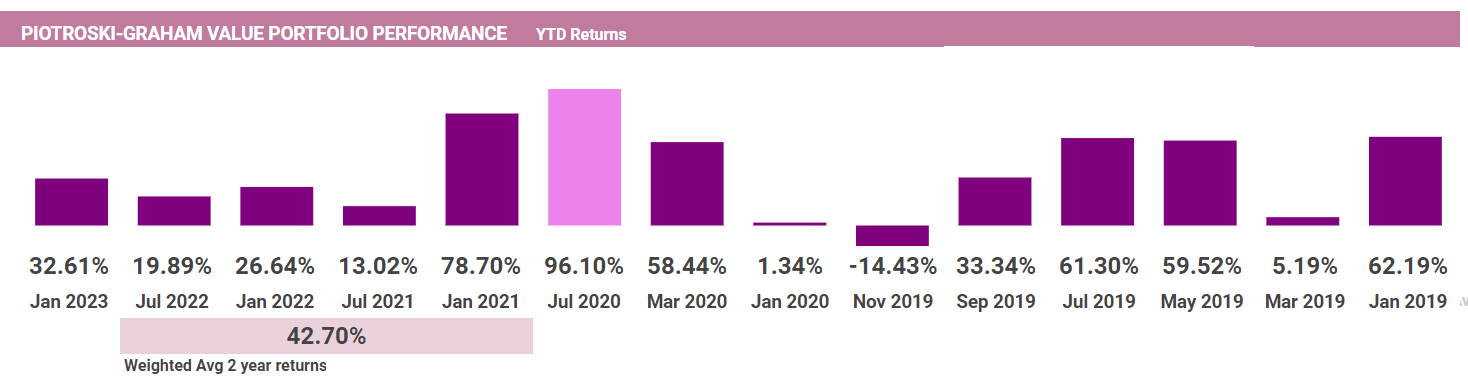
VMBreakouts.com
January Dividend Adjusted Returns vs. S&P 500
The Piotroski-Graham enhanced portfolio from January has significantly outperformed the S&P 500 again this year. When including large dividends from the portfolio, the total returns for the first half of the year are at +35.6% YTD.
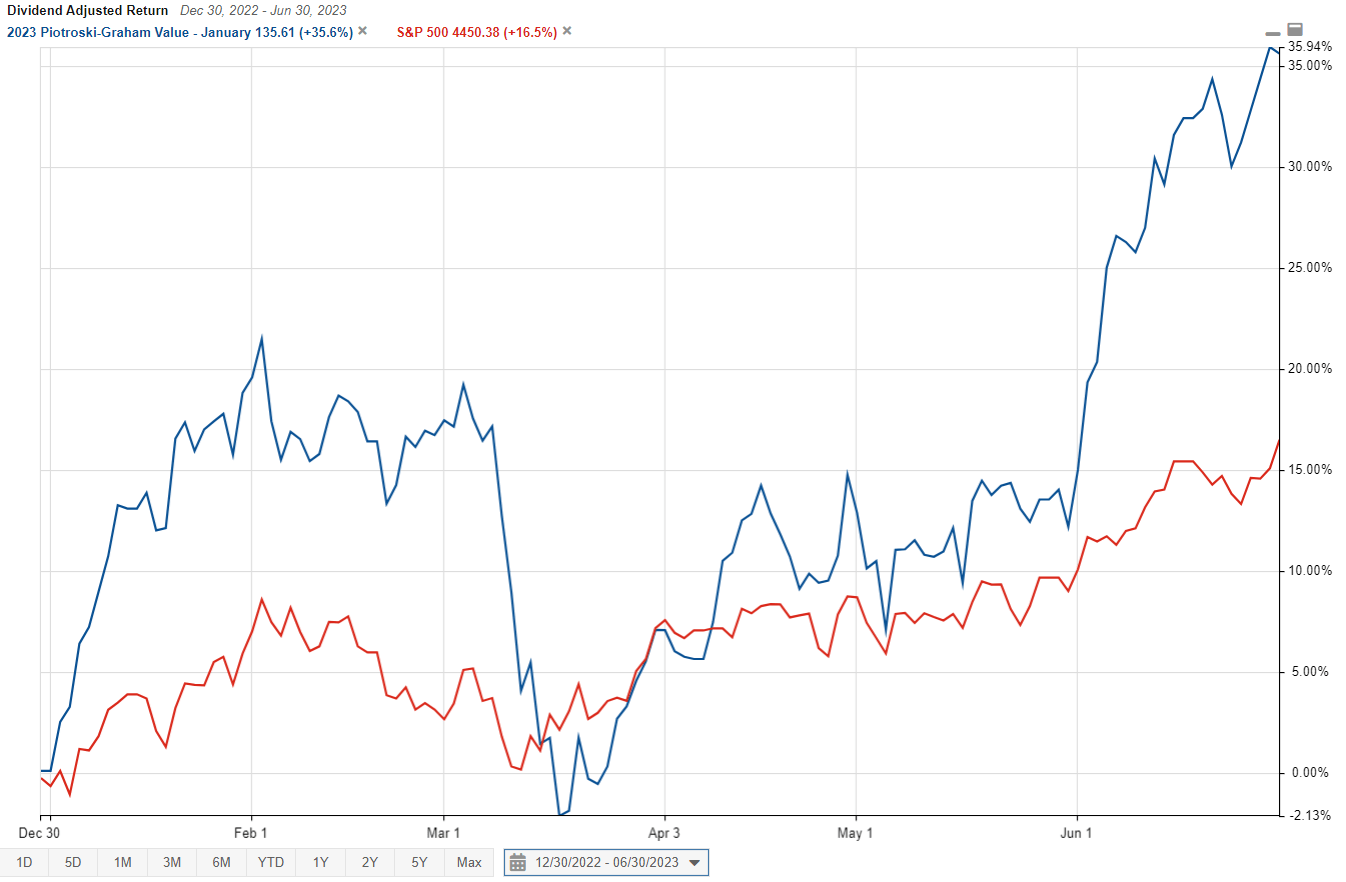
StockRover.com
Following the Daily Momentum Gauge signals or even the Weekly Gauge signals shown below you could further enhance the posted returns of the January Piotroski-Graham portfolio. You can also add downside protection (cash or bear funds) for additional gains.
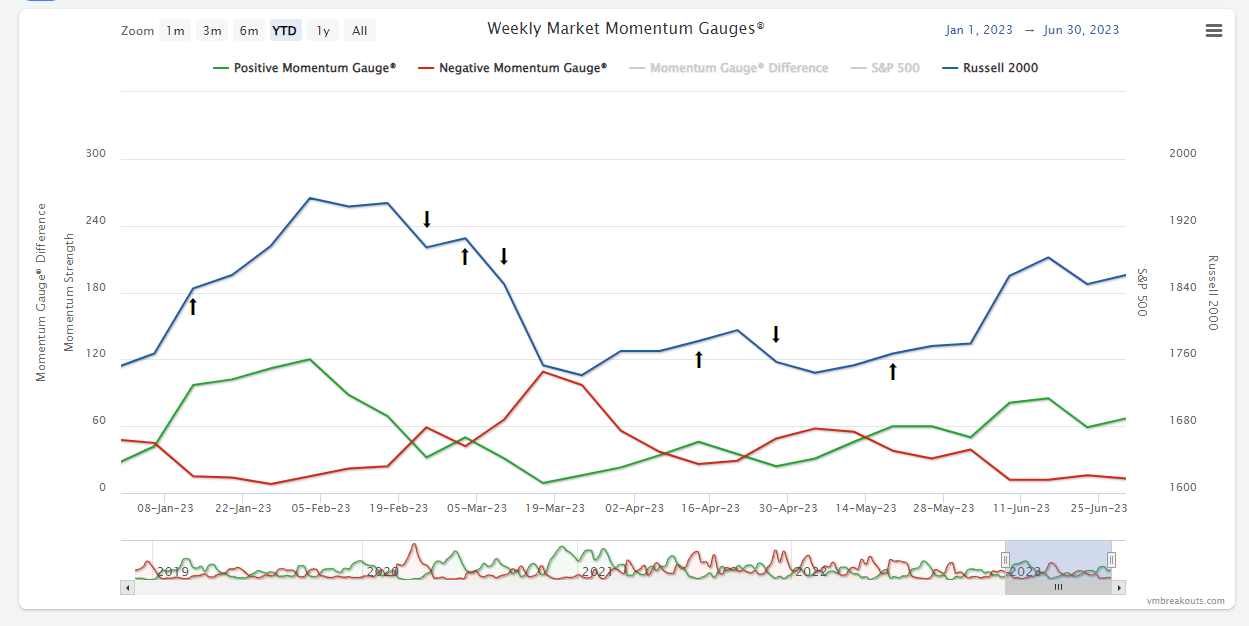
app.VMBreakouts.com
The January 2022 Piotroski-Graham portfolio is leading the S&P 500 by +27.9% while the S&P 500 remains negative -4.4% from the start of last year. The large monthly swings can be used to further enhance returns by following the daily or weekly Momentum Gauge signals. These returns are measured for at least 2-years consistent with the financial literature measurement periods that documented strong results.

StockRover.com
July 2023: Piotroski/Graham Value Enhanced Selections
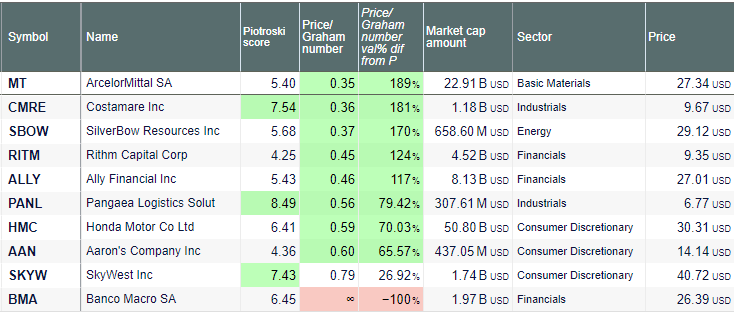
These new selections have the highest Piotroski F-Scores of all the stocks screened across the US markets with a share price above $3 and average daily volume over 100k shares. In addition, the Benjamin Graham enhancements have been applied on the basis that these characteristics are well documented to deliver excess annual market returns.
These stocks meet the qualifying price/Graham number values less than one and even better value score less than 0.50. According to historical long term results, these stocks have very high investment value from oversold levels that should deliver strong long term gains. Additionally, none of these stocks had any red-flags from the Beneish M-Score forensic algorithm that checks for earnings manipulation or financial irregularities:
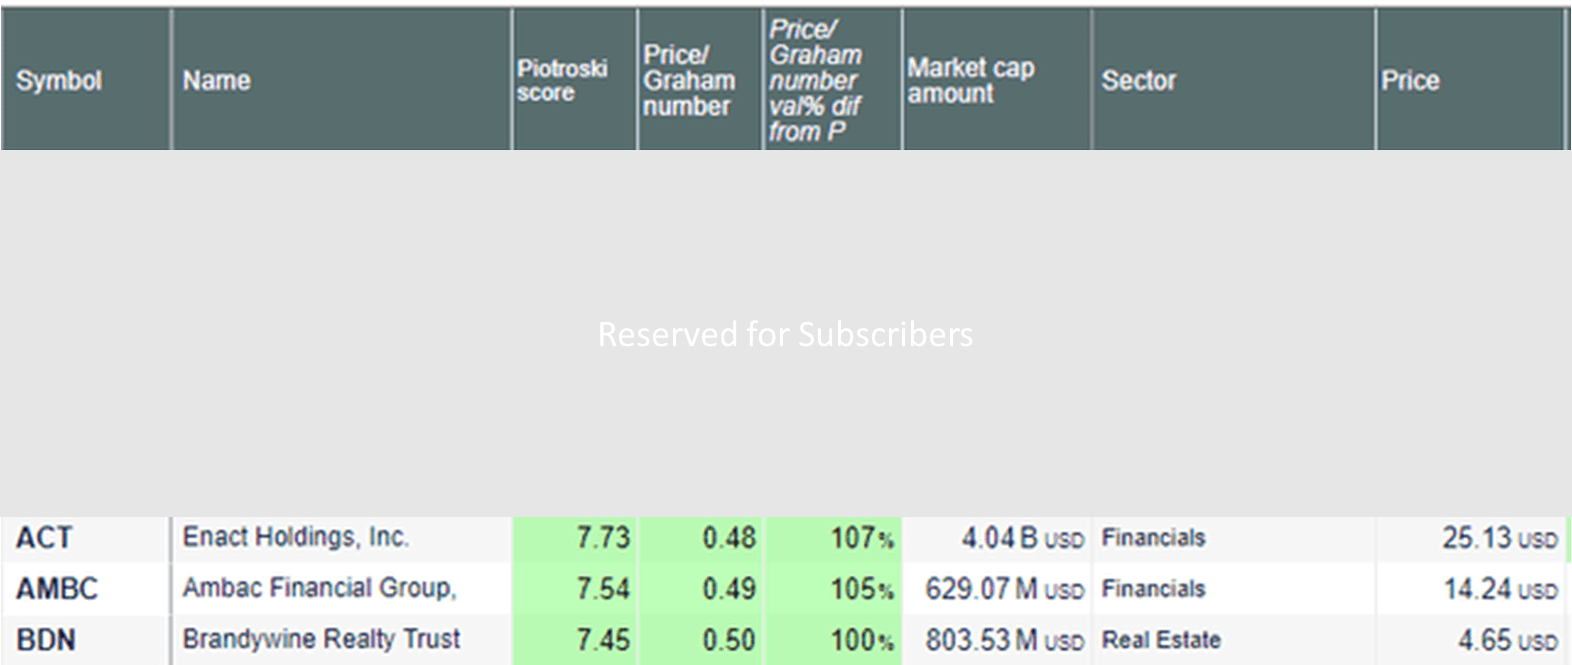
UncleStock.com
Overall Scores Independent of the Piotroski-Graham Algorithms
An independent ranking of these firms using other value and growth scores is shown below that may provide additional insight into the risk of these firms.
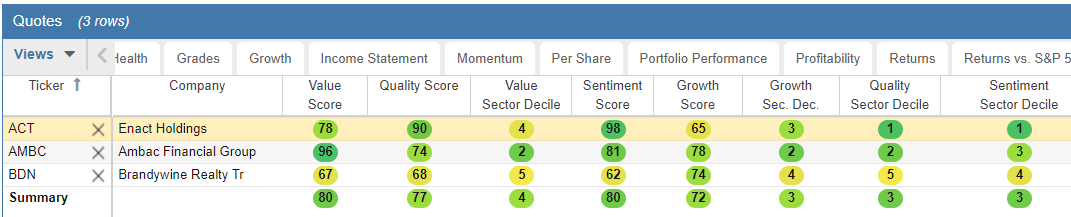
StockRover.com
The 10 stocks belong to the following sectors: 1 Basic Materials, 2 Energy, 3 Financials, 2 Industrials, and 2 Real Estate sector stocks. These stocks and sectors show strong potential into 2023 from a sampling of highly undervalued stocks from more than 7,500+ stocks.
Enact Holdings (ACT)

FinViz.com
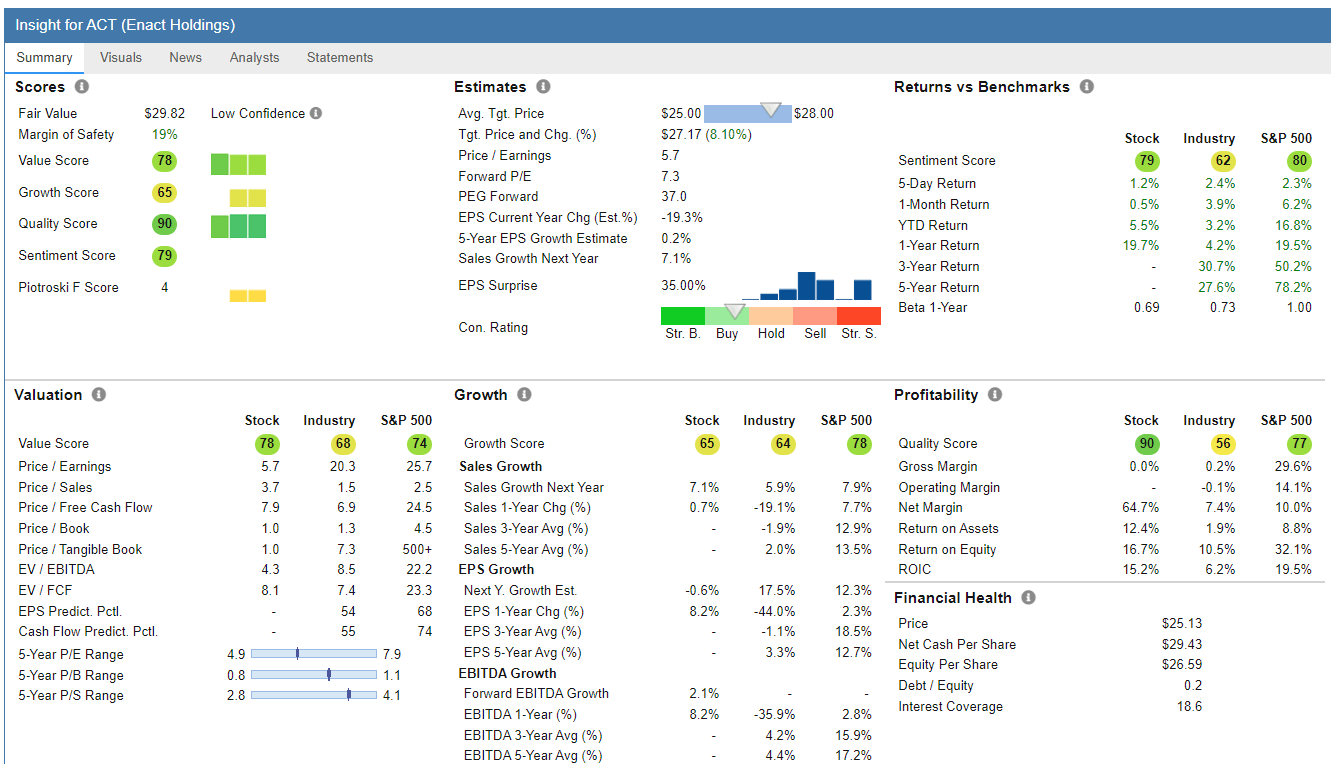
StockRover.com
Ambac Financial Group (AMBC)
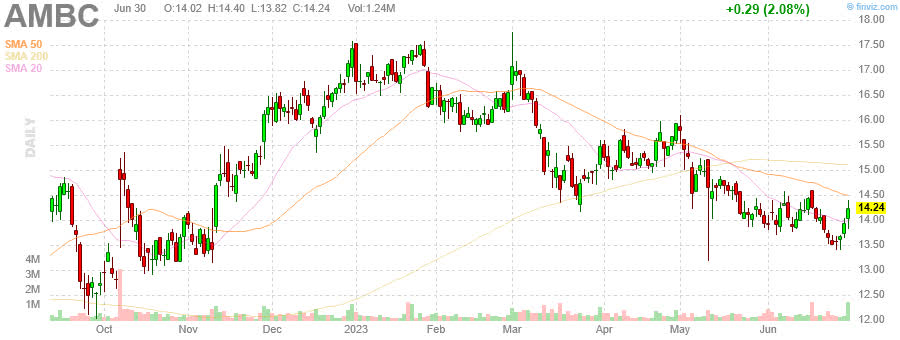
FinViz.com

StockRover.com
Brandywine Realty Trust (BDN)
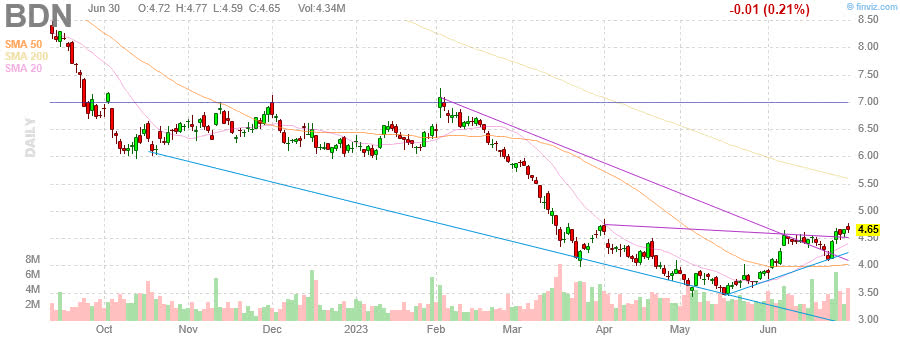
FinViz.com
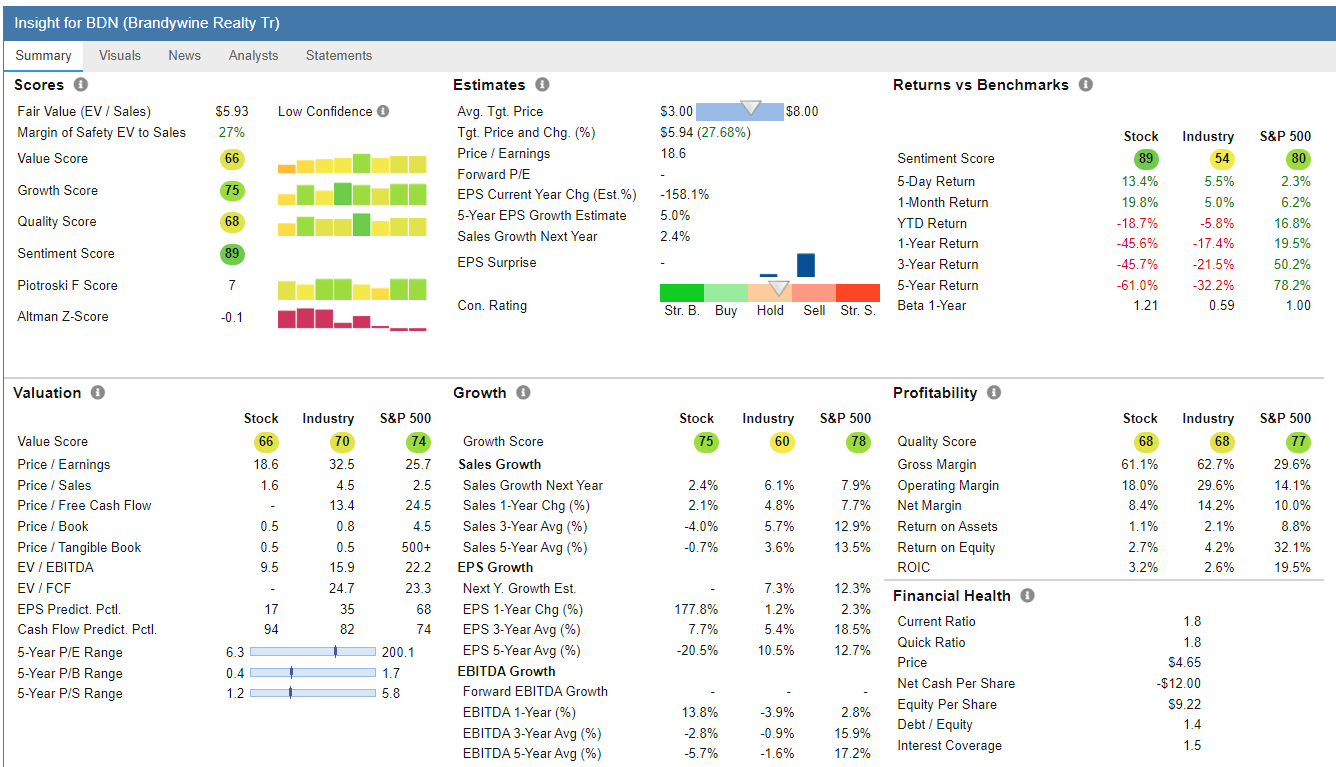
StockRover.com
Review of January 2023: Piotroski/Graham Value Enhanced Selections
I am frequently asked if stocks should be removed / replaced in every 6-month update over each of the 2-year measurement periods. This review provides an updated screen on valuations of the ten stocks from the 2023 January Piotroski-Graham selections with today's values. (SBOW) is now showing a red flag on the Beneish M-Score for possible financial irregularities. Most of these January selections continue with extremely good Piotroski and Graham valuation scores.
UncleStock.com
The top gainers so far from January are SkyWest (SKYW) +147.5%, Banco Macro S.A. (BMA) +52.6%, Pangaea Logistics Solutions (PANL) +37.3% and Honda Motor Co. (HMC) +32.0%
Introduction to Piotroski F-Score Methodology
This article continues the series of testing the best value investment research over a one-year time horizon for well-documented and substantial value-investing returns. This study is testing the Piotroski F-score model to see how many of the different value portfolios formed each month can outperform the market over a year-long period.
These Piotroski value selections are designed as a more stable, long-term investment approach to identify highly oversold stocks, in contrast to the Weekly Breakout Forecast based on highly volatile, short-term momentum stocks. The value selection formulas have been well-documented in the financial literature over the past 17 years to consistently outperform benchmark indexes.
- The Piotroski stock selections above build on the findings from the Amor-Tapia & Tascon (2016) research that evaluates top selection models in more detail in the initial August report that found the Piotroski model to be one of the best models tested for value investment selections.
- The American Association of Individual Investors also documents their own multi-year test results of the Piotroski F-score as one of the best-performing models with 17-year annualized total returns of 14.4%.
- The V&M Breakout Enhanced Piotroski portfolios combining Graham parameters and my additional liquidity price/volume limits consistently outperform the AAII Benchmark Piotroski portfolios that produced -24.2% in 2022, +20.3% in 2021, +0.3% in 2020, -19.1% in 2019, and -36.1% in 2018.
The values and methodologies from Joseph Piotroski and Benjamin Graham were devised for long-term value approaches that differ significantly from growth or momentum strategies. Like many models, they can cycle in/out of favor as economic conditions and markets change. The benefit of the inclusion of the different types of models that I offer is to identify when these larger cycles begin to shift and readers can reap significant gains from changing models. Additionally, there has been no other value strategy yet tested in the financial literature that has beaten the Piotroski approach in all the peer-reviewed studies over competitive 1-year tests.
Cycles can shift dramatically and this is another important reason for following the Momentum Gauges® closely. This is especially true with long term portfolios. The macroeconomic factors (QE, QT, Covid impacts) can greatly affect the success of individual portfolios and stocks. Back in 2021 during the largest QE stimulus in US history, many stock pickers assumed they were geniuses until the QE 4 program ended in 2022 subsequently delivering one of the worst market returns since 2008.
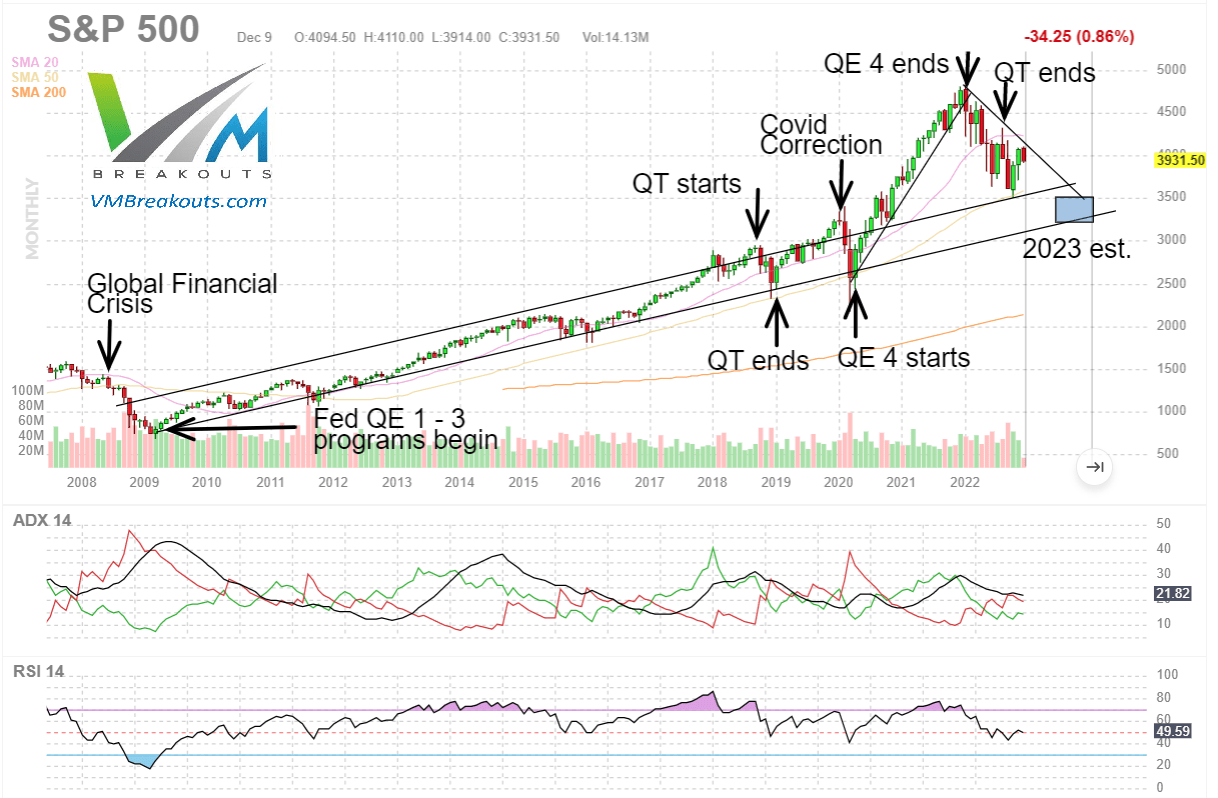
FinViz.com VMBreakouts.com
Background on Value Scoring Systems
Calculating scores and assigning values to stocks based on fundamental data remain one of the most popular methods for value stock investing. Most of us are familiar with such scoring systems as the Value Line Rank (started in 1965), the CANSLIM composite ranking system (started in 1988), the Zacks Rank (started in 1982, first made public in 1992), and many other popular systems that have given us good results over the years. To this day, it is not uncommon to find substantial overlap among the best stocks identified by different value ranking methodologies. Most medium- to long-term investors are well served by taking these models into consideration.
Less well-known are the academic composite value models based on fundamentals that continue to be rigorously tested in peer-reviewed financial literature. Some of these published models have their measurement scoring integrated into publicly available stock screens from various stock analysis websites. One of the best academic models retested recently by Amor-Tapia and Tascon (2016) is the Piotroski score model created by Joseph Piotroski in 2000:
The Piotroski (2000) FSCORE: The Score consists of aggregating nine individual binary signals derived from accounting variables related to profitability. The most favorable value score is 9 and the least favorable is zero.
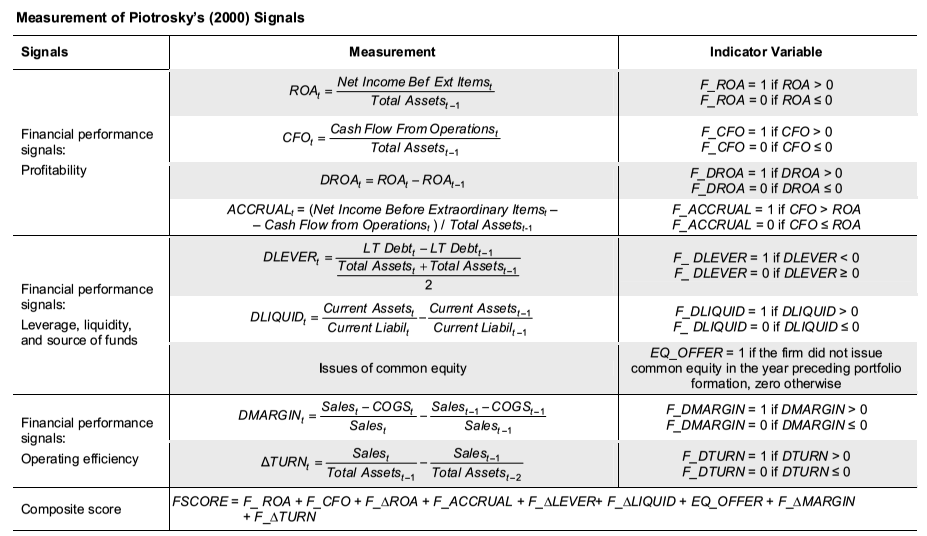
Amor-Tapia & Tascon 2016
(Amor-Tapia &Tascon, 2016)
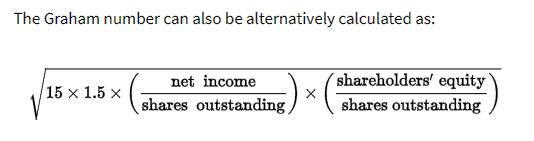
The Graham Number: Benjamin Graham, often called "the Father of Value Investing," first leveraged key financial ratios to identify undervalued companies with strong growth potential. The Graham Number value score results from a formula developed by Benjamin Graham that is based on his assessment that good value stocks should have a P/E ratio below 15 and a P/B ratio below 1.5:
Benjamin Graham
This Graham Number value equals the square root of 22.5 x EPS x P/B. Because it leaves out many other important characteristics it is better applied as an enhancement to the highly successful Piotroski F-Score value selection model.
Conclusion
The Piotroski F-Score model has been well-documented in the financial literature and by practitioners to generate significant excess returns on an annual basis. In addition the enhanced value model selections above also eliminate financial outliers and low-priced stocks that may jeopardize the best performance results possible. This value model remains one of the top selection models among dozens also tracked by the American Association of Individual Investors. The advantage of this model is described by Joseph Piotroski from his published research:
First, value stocks tend to be neglected. As a group, these companies are thinly followed by the analyst community and are plagued by low levels of investor interest. Given this lack of coverage, analyst forecasts and stock recommendations are unavailable for these firms.
Second, these firms have limited access to most "informal" information dissemination channels and their voluntary disclosures may not be viewed as credible given their poor recent performance. Therefore, financial statements represent the most reliable and most accessible source of information about these firms.
Third, high BM firms tend to be "financially distressed"; as a result, the valuation of these firms focuses on accounting fundamentals such as leverage, liquidity, profitability trends, and cash flow adequacy. These fundamental characteristics are most readily obtained from historical financial statements. ~ Joseph Piotroski
Since my testing began of this Enhanced Piotroski-Graham value model, it has consistently outperformed the S&P 500 and benchmark AAII Piotroski selection models every year.
The majority of the portfolios I offer in my service are long term value portfolios even though much more attention is given to weekly MDA breakouts and ETF portfolios for the large short-term gains.
VMBreakouts.com
As we see more rotation into value stocks again I trust this will be a profitable contribution to your investment objectives in 2023!
JD Henning, PhD, MBA, CFE, CAMS
References
Amor-Tapia, B. & Tascón, M.T. (2016). Separating winners from losers: Composite indicators based on fundamentals in the European context *. Finance a Uver,66(1), 70-94.
Piotroski, J. D. (2000). Value investing: The use of historical financial statement information to separate winners from losers. Journal of Accounting Research, 38, 1-41.
Graham, B. (1949). The Intelligent Investor: The Definitive Book on Value Investing
Editor's Note: This article discusses one or more securities that do not trade on a major U.S. exchange. Please be aware of the risks associated with these stocks.
If you are looking for a great community to apply proven financial models with picks ranging from short term breakouts to long term value and forensic selections, please consider joining our 1,200+ outstanding members at Value & Momentum Breakouts
- Subscribe now and learn why members are hooked on the Momentum Gauge® signals!
- For the 6th consecutive year the V&M Portfolios beat the S&P 500!!
- The new Active ETF portfolio gained +17.1% beating S&P 500 by over 35%
- Now into our 7th year, we have outperformed the S&P 500 every single year!
See what members are saying now - Click HERE
This article was written by

Welcome! I am a Finance PhD, MBA, investment adviser, fraud examiner and certified anti-money laundering specialist with more than 30 years trading and investing stocks and other securities. I'm the founder of Value & Momentum Breakouts.
***
I'm JD Henning, the founder of Value & Momentum Breakouts. I've spent decades capturing many of the best ways to consistently beat the markets. I've earned degrees researching markets, and even more importantly, I've spent the time myself as a trader and investor. I am one of those unusual multi-millionaire, PhD's in finance, former Coast Guard officer with a bunch of certifications ranging from anti-money laundering specialist, investment adviser, to fraud examiner... who genuinely enjoys helping others do well in the markets. I'm bringing the fruits of my experience and research to this service. I am highly accessible to members to answer questions and give guidance.
***
It's been quite the start of the year for investors. My guess is, after a decade of good times in the market, you’re here looking for some guidance in how to navigate these volatile markets and the uncertainty of the coronavirus and inflationary conditions. You’re in the right place. For the past 7 years I’ve made my trading systems public and helped thousands of my subscribers navigate and profit from every market downturn and breakout. Please be sure to read the reviews of my service from actual members!
***
Value & Momentum Breakouts doesn't stop with the Momentum Gauges® and the Bull/Bear ETF strategy. The service is designed for investors who appreciate having easy access to quick picks from many top quantitative financial models across different types of investing strategies. Portfolios and selections cover all types of investments:
***
Commodity and Volatility fund trading
Cryptocurrency chart analysis
Long term high-dividend growth stocks
Short term high-frequency breakout stocks
Forensic analysis value stocks
Value enhanced long term growth picks
ETF sector and bull/bear combination trades
Dow mega cap breakout picks
Sector and Index Momentum Gauges® for market timing
***
I share my expertise by generating frequent Value & Momentum Breakout stock portfolios from the different financial algorithms across peer-reviewed financial literature.
***
Try a 2-Week FREE trial and see all the value for yourself.
Analyst’s Disclosure: I/we have no stock, option or similar derivative position in any of the companies mentioned, and no plans to initiate any such positions within the next 72 hours. I wrote this article myself, and it expresses my own opinions. I am not receiving compensation for it (other than from Seeking Alpha). I have no business relationship with any company whose stock is mentioned in this article.
I continue to follow the Market Momentum Gauge® and Sector Momentum Gauge® signals. Readers are highly encouraged to consider your own optimal asset allocation strategies to diversify risks and enhance returns. My current trading continues in ETFs and I adjust my exposure ahead of weekends and holidays to minimize the risk from high volatility 3x funds that may not be appropriate investments for your portfolio.
Seeking Alpha's Disclosure: Past performance is no guarantee of future results. No recommendation or advice is being given as to whether any investment is suitable for a particular investor. Any views or opinions expressed above may not reflect those of Seeking Alpha as a whole. Seeking Alpha is not a licensed securities dealer, broker or US investment adviser or investment bank. Our analysts are third party authors that include both professional investors and individual investors who may not be licensed or certified by any institute or regulatory body.