PDD Holdings: More Market Consolidation Expected (Technical Analysis)

Summary
- PDD continues to demonstrate growth potential despite geopolitical and regulatory pressures, with a strategy targeting affordable products to lower-income consumers and lesser-tier cities.
- The simultaneous presence of a head and shoulders pattern and a bear flag hints at an ongoing market consolidation, implying a potential for further price decline.
- A decrease in price will provide investors with an opportunity to augment their positions at lower levels, transforming any drop into a potential buying opportunity.
champc
PDD Holdings Inc. (NASDAQ:PDD), the Chinese e-commerce giant, continues to showcase remarkable growth potential amidst the evolving geopolitical and regulatory landscapes that may exert short-term pressure on its share prices. PDD's strategy of targeting affordable products to lower-income consumers and lesser-tier cities has been instrumental in consistently outperforming rivals like JD.com, Inc. (JD). This article offers a technical analysis of PDD to forecast the future trajectory of the stock. Based on the observed data, the charts for PDD demonstrate bearish market trends, indicating that further market consolidations are likely to happen before the stock ascends to higher levels.
Financial Performance
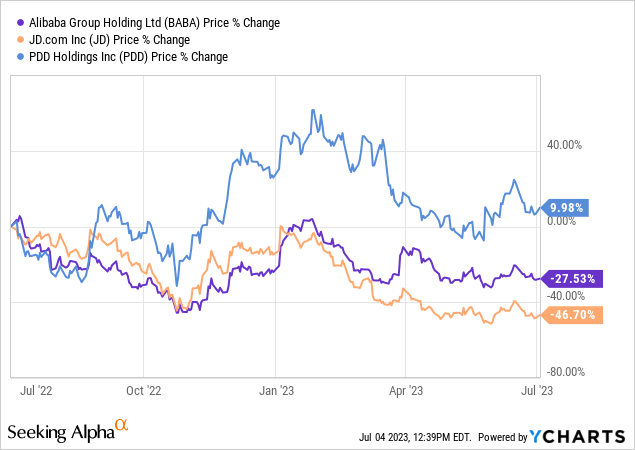
While concerns around the geopolitical landscape and regulatory shifts could put pressure on PDD's share price in the short term, it's important to keep in mind the significant opportunities for growth that this e-commerce giant presents. PDD has consistently outperformed its Chinese competitors Alibaba Group Holding Limited (BABA) and JD in terms of growth, both in its active user base and revenue, by targeting lower-income shoppers and lower-tier cities with affordable products and group-buying strategies. The company has also achieved significant growth in its online agricultural platform, eliminating middlemen to provide fresh produce at lower prices. The percentage change in the price of PDD, JD, and BABA is shown in the chart below.
Furthermore, PDD is betting big on its cross-border e-commerce platform, Temu, which facilitates the sale of Chinese products to overseas markets such as the US and Europe. Despite being in the early stages of development, Temu has already become one of the most downloaded shopping apps in the US. If the platform can successfully navigate regulatory challenges and international tensions, it has the potential to diversify PDD's revenue streams and contribute significantly to its growth. Anticipations of sustained growth for the company remain high, owing to optimistic revenue and net income forecasts from 2022 to 2025. Although the predicted growth rate may be somewhat less vigorous than its track record over the last five years, it continues to eclipse the expected growth of its competitors, BABA and JD.
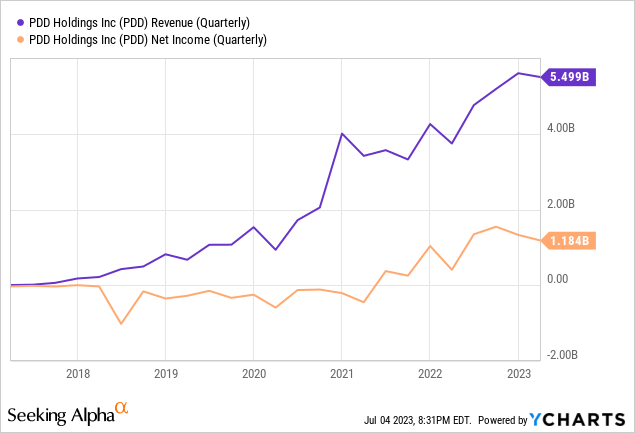
The subsequent graph illustrates a steady upward trajectory in PDD's revenue and net income over the past five years. This trend signifies the company's persistent enhancement of its profitability. Given this consistent rise in profitability, PDD emerges as a promising investment opportunity based on the exhibited financial performance. In the first quarter of 2023, the company disclosed revenue of $5.499 billion and a net income of $1.184 billion. Although these figures suggest a slight dip in profitability for 2023, the overall trend toward strong profitability persists and is forecasted to remain robust.
Decoding PDD's Market Dynamics
A long-term perspective of PDD can be seen in the monthly chart below. This chart highlights a high of $212.60 in 2021, after which the market took a steep dive, reaching a low of $23.21. The impact of this market plunge was significantly severe, effectively obliterating the short-term bullish sentiment. This decline paves the way for further market consolidation, which could potentially drive powerful momentum. The market has, up until now, been consolidating within the $23.21 to $106.80 range. Interestingly, this market consolidation exhibits an upward trend, as marked by the blue trendline. The June candlestick was also notably weak, as depicted below, evidenced by the appearance of a wick on the monthly candlestick. Such price behavior in the monthly chart suggests market consolidation before a potential upward shift.
PDD Monthly Chart (stockcharts.com)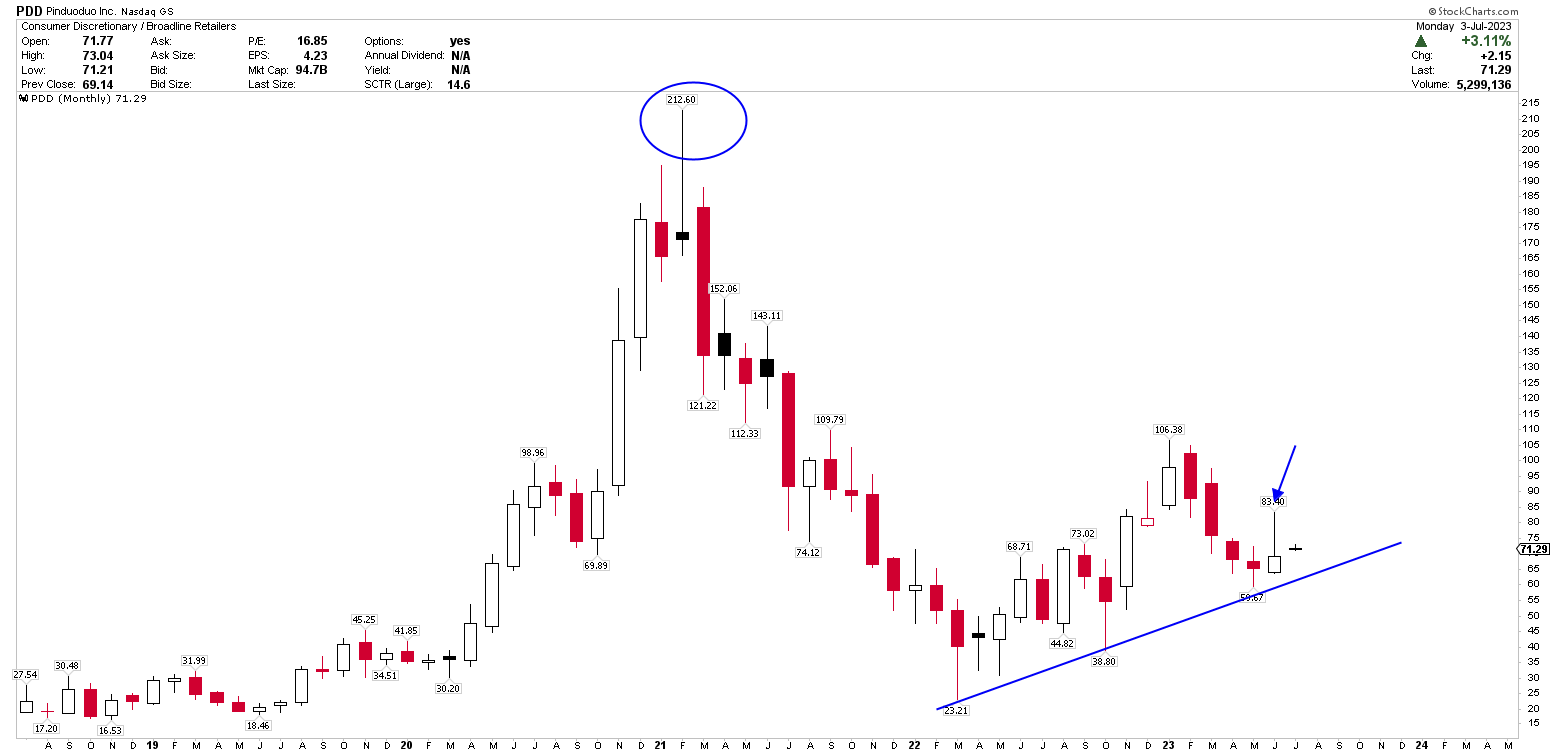
For a more nuanced technical analysis, let's look at the weekly chart for PDD. This chart accentuates the market's bearish momentum, observable through a head-and-shoulders pattern. The pattern's head coincides with the all-time high of $212.60, while its shoulders align with $98.96 and $109.79. The neckline of this pattern is situated around the $77 mark. Post the pattern's breach, the price hit rock bottom at $23.21 and is currently fluctuating within the blue channel. It's noteworthy that the market seems to be shaping another bearish pattern, known as the bear flag. Activation of this pattern will occur only if the price descends below the $59 mark. The emergence of a bear flag following the head-and-shoulders pattern signifies the potential for further price decline, urging investors to exercise caution and wait for a more favorable market opportunity.
PDD Weekly Chart (stockcharts.com)
Interestingly, the daily chart also presents a head-and-shoulders pattern with the head at $106.38 and shoulders at $93.16 and $97.63. The neckline of this pattern lies at $78, which, when breached, instigated a downward price trajectory. Despite rebounding from the red trendline support (also visible in the monthly chart), the price encountered resistance at the neckline once again. The price is now oscillating within this range, awaiting a breakout.
PDD Daily Chart (stockcharts.com)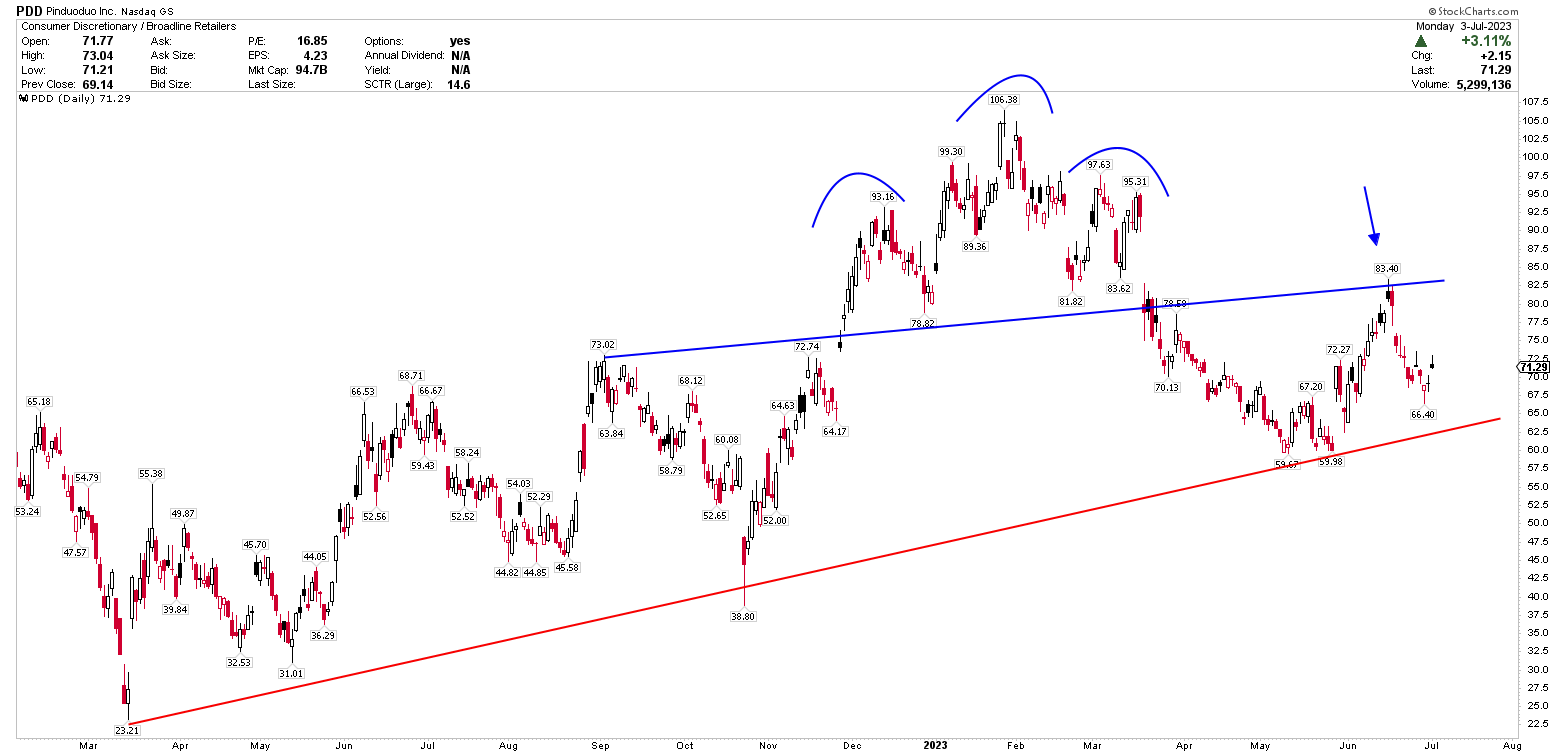
Based on this technical analysis, it is concluded that while PDD's fundamental outlook is robust, the technical outlook suggests more market consolidation. If the price slips below the red trendline, it could dip further. However, any market decline should be perceived as a strong buying opportunity for long-term investors. Currently, the risk of buying the stock at its current level is elevated due to bearish tendencies. It would be prudent for investors to wait for the market to break down before investing in PDD. Conversely, if the market surpasses the $110 mark, it would undermine the bearish perspective and pave the way for an upward surge. A break above $110 would also trigger a powerful buying signal.
Market Risks
PDD operates in China, a country known for its evolving and uncertain regulatory landscape. Chinese authorities have recently taken a harder line on tech giants, leading to increased scrutiny and tougher regulations, especially in the e-commerce sector. While PDD has managed to navigate this environment so far, any sudden regulatory shifts could pose significant risks to PDD's operational freedom and profitability. On the other hand, PDD's global expansion, particularly through its cross-border e-commerce platform Temu, exposes it to geopolitical risks. Rising international tensions, especially between China and Western countries, could negatively impact Temu's growth and success. Any sanctions, trade restrictions, or negative sentiment towards Chinese companies could potentially limit PDD's reach and revenue in overseas markets.
Moreover, PDD has outperformed rivals like BABA and JD by targeting lower-tier cities and lower-income consumers, competition in the Chinese e-commerce market is intense. If PDD's competitors make strategic shifts to target the same demographics or offer similar value propositions, it could erode PDD's competitive advantage and impact its growth. In light of these risks, while PDD has immense growth potential, investors should balance this bullish sentiment with careful consideration of the above-mentioned risks. It would be prudent for investors to monitor these risks and their potential impact on PDD's growth trajectory and stock performance.
Bottom Line
In conclusion, the investment potential of PDD presents a compelling picture of growth opportunities combined with notable risks. Its strategies, including targeting underserved markets and venturing into cross-border e-commerce, have provided it with an edge over competitors, leading to significant growth. Yet, these strides could be tempered by geopolitical and regulatory concerns. The technical analysis underlines a period of market consolidation with the potential for further decline. The appearance of a head and shoulders pattern, in conjunction with a bear flag, indicates a potential for additional declines. The extent of this downward trend can only be ascertained once the price dips below $59. Conversely, if the price surpasses the $110 threshold, it will curtail the bearish trend and initiate an upward swing, thereby unlocking new buying opportunities. Hence, investors should tread carefully at current levels, opting to purchase either when the price falls below $59 or exceeds the $110 benchmark.
This article was written by

Analyst’s Disclosure: I/we have no stock, option or similar derivative position in any of the companies mentioned, and no plans to initiate any such positions within the next 72 hours. I wrote this article myself, and it expresses my own opinions. I am not receiving compensation for it (other than from Seeking Alpha). I have no business relationship with any company whose stock is mentioned in this article.
Seeking Alpha's Disclosure: Past performance is no guarantee of future results. No recommendation or advice is being given as to whether any investment is suitable for a particular investor. Any views or opinions expressed above may not reflect those of Seeking Alpha as a whole. Seeking Alpha is not a licensed securities dealer, broker or US investment adviser or investment bank. Our analysts are third party authors that include both professional investors and individual investors who may not be licensed or certified by any institute or regulatory body.
Recommended For You
Comments (1)
