Stocks Continue To Misprice The Fed's Path To Even Higher Rates

Summary
- The job market data pushed the odds for a July FOMC rate hike to around 90%.
- The path of least resistance for rates on the long end of the curve appears to be higher.
- The Fed minutes showed most members prefer to keep raising rates.
- Looking for a helping hand in the market? Members of Reading The Markets get exclusive ideas and guidance to navigate any climate. Learn More »

Lemon_tm
The latest data suggests that the job market remains tight and that the path of least resistance for interest rates is higher. Meanwhile, stocks continue to misprice interest rate risk, even as interest rates push past key resistance levels. Stocks continue getting more expensive relative to rates, meaning remaining in high-quality names and carrying extra cash is prudent.
Additionally, the latest Fed minutes indicated that many Fed officials would have liked to have continued to raise interest rates in June, but that the calls for a "skip" prevailed.
The dovish case to not raise the overnight rate seemed to hinge on some job indicators suggesting a softening in the labor market. The minutes specifically pointed to weaker trends witnessed in the ADP survey.
The minutes noted that:
Some participants pointed out that payroll gains had remained robust but noted that some other measures of employment—such as those based on the Bureau of Labor Statistics’ household survey, the Quarterly Census of Employment and Wages, or the Board staff’s measure of private employment using data from the payroll processing firm ADP—suggested that job growth may have been weaker than indicated by payroll employment.
Strong Jobs Data Points To Higher Rates
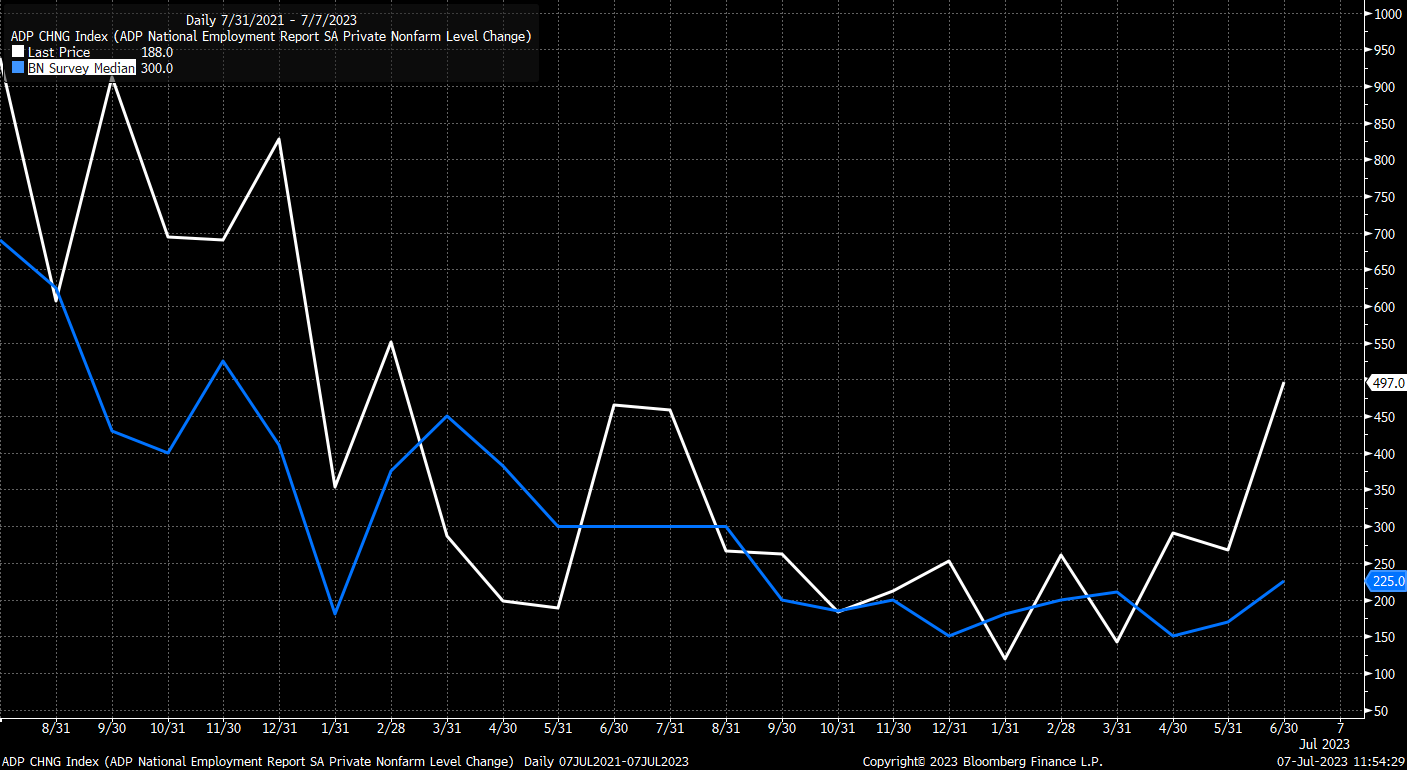
Of course, that whole theory went out the window on Thursday when the ADP data showed robust job gains in June, rising by 497,000 vs. estimates of 225,000. That was the largest one-month gain in employment as measured by ADP in nearly a year.
Bloomberg
Another case to pause in June showed that the average hours worked had declined in recent months. That number also improved in June, rising to 34.4 hours from 34.3 hours in May. Yes, that number is weaker than at the peak in early 2021, but it does seem consistent with values witnessed from 2010 until 2019 before the pandemic.

Bloomberg
Meanwhile, as of May, 1.67 times more job openings remain than the number of unemployed workers. This number remains exceptionally high and well above the 2018 and 2019 highs. This suggests that worker demand remains very high, and the 3.6% unemployment rate coupled with wage growth indicates the tight labor market.

Bloomberg
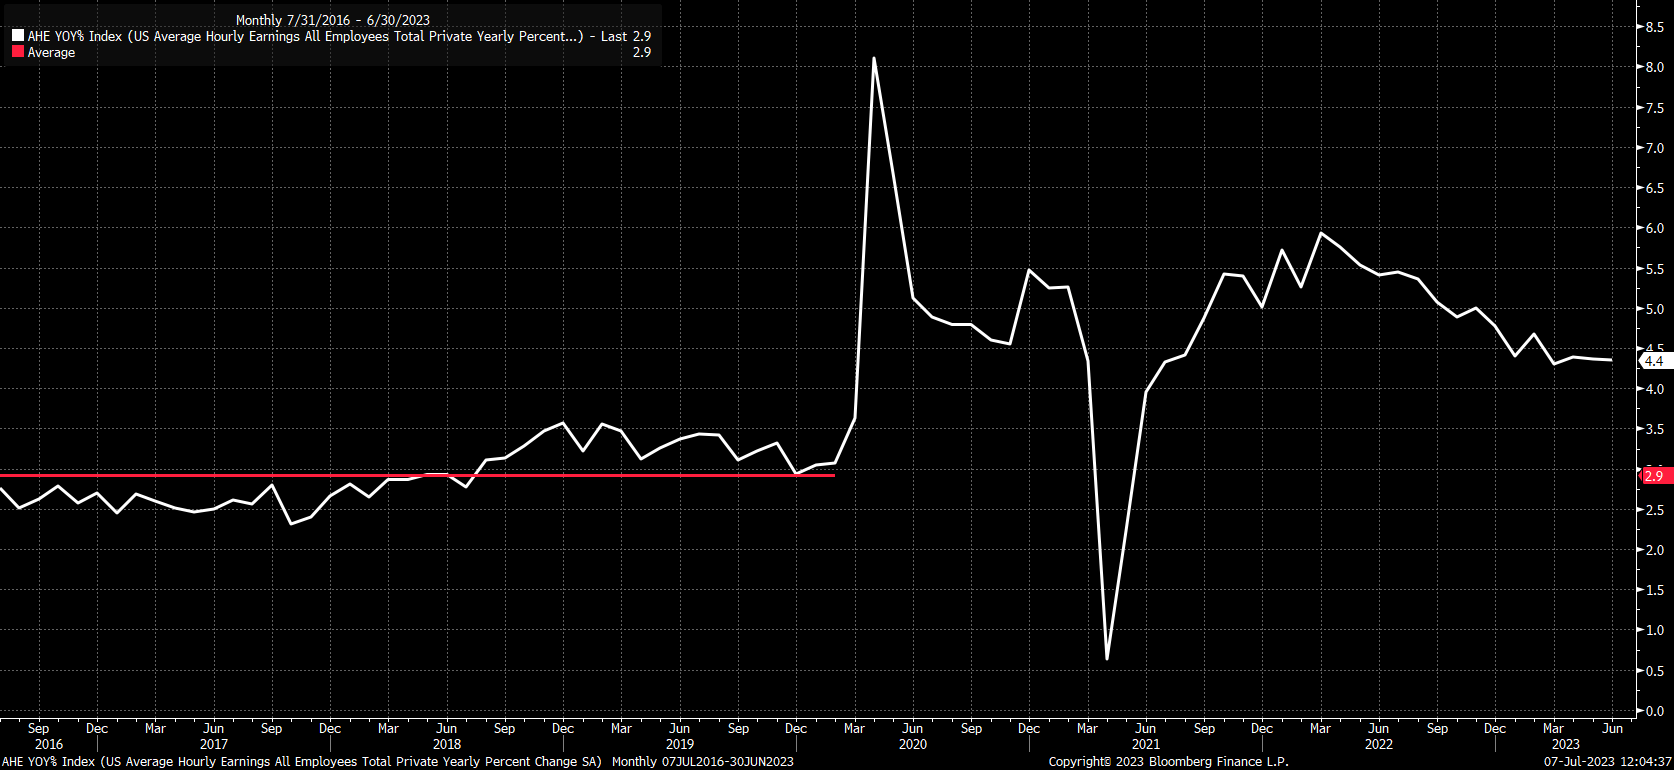
Wage growth on a year-over-year basis has flatlined over the last few months at around 4.4% after peaking at 5.9% in March 2022. The current value of 4.4% also is well above the average of 2.9% from July 2016 until February 2020. Additionally, a 4.4% year-over-year wage increase certainly is not consistent with a 2% inflation rate; assuming a 1% productivity rate, wage growth equates to a roughly 3.5% inflation rate.
Bloomberg
Higher Rates
Unsurprisingly, the market is now pricing in about a 90% chance for a rate hike in July. Especially now, since the principal calls for some members of the Fed calling for a skip at the June meeting didn't seem to play out as expected.
It's also no surprise that the stronger-than-expected employment data has pushed rates on the back of the nominal yield curve sharply higher this week, while real rates rose sharply too. We saw the 10-year and 30-year nominal rate rise above 4% this past week, gaining more than 15 bps.

Bloomberg
Additionally, real yields rose sharply to new cycle highs on the 5-year and 10-year TIP rates. The 5-Year TIP is now trading at 2.1%, while the 10-year TIP rate is now at 1.76%.

Bloomberg
That has helped to push the equity risk premium between the Nasdaq earnings yield and the 10-yr TIP rate to just 1.24%, a new cycle low. It used to be that the spread between the Nasdaq earnings yield and the 10-yr TIP rate averaged a spread of about 3.8% from 2013 until early 2022. That spread has narrowed considerably, suggesting that the growth-oriented Nasdaq 100 is now extremely overvalued vs. its average of the past 10 years.

Bloomberg
But more importantly, it seems that this spread is poised to narrow further unless the equity market begins to pay attention to the warnings of the bond market for higher rates. The 10-year Treasury rate this week rose above a key downtrend that formed in October 2022 while also moving above a resistance level in the channel portion of a cup and handle pattern. This would indicate that the 10-year is likely to rise above 4.1% and even challenge, if not exceed, the highs in October around 4.3%.

Trading View
The same is true of the current 30-year rate, which also is breaking free of its consolidation phase since December. This would suggest the 30-year rate could rise to around 4.3% or even beyond 4.4% in the not too distant future.

Trading View
Higher rates on the long end of the curve also mean higher real yields for the inflation-protected TIPs, and the higher real yields get, the more expensive stocks become relative to those real yields.
The relationship between real rates and stocks was the centerpiece of the past 10 years, and now suddenly, stocks seem to have completely disconnected from that relationship. It's either because something has changed, which has not become material clear yet, or there's a lot of pain coming the equity market's way soon, and there will be a big push below 4,200 on the S&P 500 and potentially lower coming.
It means staying in high-quality defensive names and carrying extra cash remains the prudent decision at this point.

Join Reading The Markets Risk-Free With A Two-Week Trial!
(*The Free Trial offer is not available in the App store)
Reading the Markets helps readers cut through all the noise delivering stock ideas and market updates, and looking for opportunities.
We use a repeated and detailed process of watching the fundamental trends, technical charts, and options trading data. The process helps isolate and determine where a stock, sector, or market may be heading over various time frames.
This article was written by

I am Michael Kramer, the founder of Mott Capital Management and creator of Reading The Markets, an SA Marketplace service. I focus on long-only macro themes and trends, look for long-term thematic growth investments, and use options data to find unusual activity.
I use my over 25 years of experience as a buy-side trader, analyst, and portfolio manager, to explain the twists and turns of the stock market and where it may be heading next. Additionally, I use data from top vendors to formulate my analysis, including sell-side analyst estimates and research, newsfeeds, in-depth options data, and gamma levels.
Analyst’s Disclosure: I/we have no stock, option or similar derivative position in any of the companies mentioned, and no plans to initiate any such positions within the next 72 hours. I wrote this article myself, and it expresses my own opinions. I am not receiving compensation for it (other than from Seeking Alpha). I have no business relationship with any company whose stock is mentioned in this article.
Charts used with the permission of Bloomberg Finance L.P. This report contains independent commentary to be used for informational and educational purposes only. Michael Kramer is a member and investment adviser representative with Mott Capital Management. Mr. Kramer is not affiliated with this company and does not serve on the board of any related company that issued this stock. All opinions and analyses presented by Michael Kramer in this analysis or market report are solely Michael Kramer's views. Readers should not treat any opinion, viewpoint, or prediction expressed by Michael Kramer as a specific solicitation or recommendation to buy or sell a particular security or follow a particular strategy. Michael Kramer's analyses are based upon information and independent research that he considers reliable, but neither Michael Kramer nor Mott Capital Management guarantees its completeness or accuracy, and it should not be relied upon as such. Michael Kramer is not under any obligation to update or correct any information presented in his analyses. Mr. Kramer's statements, guidance, and opinions are subject to change without notice. Past performance is not indicative of future results. Neither Michael Kramer nor Mott Capital Management guarantees any specific outcome or profit. You should be aware of the real risk of loss in following any strategy or investment commentary presented in this analysis. Strategies or investments discussed may fluctuate in price or value. Investments or strategies mentioned in this analysis may not be suitable for you. This material does not consider your particular investment objectives, financial situation, or needs and is not intended as a recommendation appropriate for you. You must make an independent decision regarding investments or strategies in this analysis. Upon request, the advisor will provide a list of all recommendations made during the past twelve months. Before acting on information in this analysis, you should consider whether it is suitable for your circumstances and strongly consider seeking advice from your own financial or investment adviser to determine the suitability of any investment.
Seeking Alpha's Disclosure: Past performance is no guarantee of future results. No recommendation or advice is being given as to whether any investment is suitable for a particular investor. Any views or opinions expressed above may not reflect those of Seeking Alpha as a whole. Seeking Alpha is not a licensed securities dealer, broker or US investment adviser or investment bank. Our analysts are third party authors that include both professional investors and individual investors who may not be licensed or certified by any institute or regulatory body.
Recommended For You
Comments (5)


The Fed cannot go higher than that, and probably won’t need to. This economy has the engine of a Ferrari. Just a little fine tuning from here.
