1st Source: Lackluster Earnings Outlook, Unattractive Valuation

Summary
- Due to the first quarter’s disappointing performance, I’ve reduced my margin estimate and consequently the earnings estimate for 2023.
- I’m now expecting earnings to be flattish this year as loan growth will most probably cancel out the effect of higher expenses.
- The December 2023 target price suggests a small downside from the current market price. Further, SRCE is offering a modest dividend yield.

ugurhan
Earnings of 1st Source Corporation (NASDAQ: NASDAQ:SRCE) will most probably remain flattish this year as loan growth will counter the effect of higher operating and provisioning expenses. I’m expecting the company to report earnings of $4.80 per share for 2023, down by just 1% year-over-year. Compared to my last report, I’ve slightly reduced my earnings estimate because I’ve decreased my net interest margin estimate for the year. The market price is currently above the year-end target price. Based on the total expected return, I’m maintaining a hold rating on 1st Source Corporation.
Fixed-Rate Loan Maturity to Counter Deposit Mix Deterioration
1st Source Corporation’s first quarter results disappointed me as its margin missed my expectations and dipped by nine basis points during the quarter. Like most peer banks, 1st Source Corporation’s deposit mix continued to worsen during the first quarter of 2023, leading to a surge in interest expenses. Depositors expected interest rates to rise in the near term and the up-rate cycle to end this year. The high-interest rates incentivized depositors to shift their funds away from non-interest and low-interest-bearing accounts towards higher-yielding accounts. Further, the rate outlook gave depositors the incentive to lock their funds into time deposits. As shown below, 1st Source Corporation’s time deposit balance surged during the first quarter while the balance of non-interest-bearing deposits dipped.
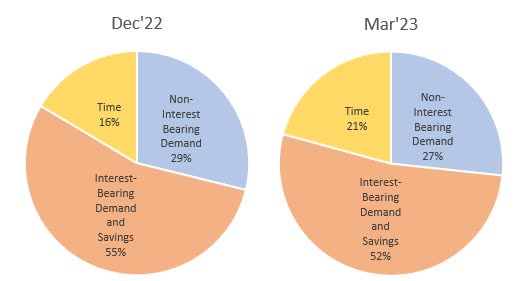
SEC Filings
Fixed-rate loans make up a hefty 65% of total loans. Fortunately, the average remaining life of the fixed-rate portfolio is only 2.78 years, as mentioned in the earnings presentation. Therefore, a sizable portion of the fixed-rate portfolio can be expected to mature this year, allowing the management to roll over the released funds into higher-yielding loans.
The results of the management’s rate-sensitivity analysis given in the earnings presentation showed that a 100-basis points rise in interest rates could increase the net interest income by 2.08% over twelve months.
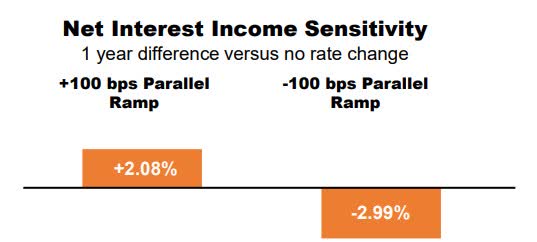
1Q 2023 Presentation
Considering these factors, I’m expecting the margin to remain almost unchanged from the first quarter’s level during the last three quarters of 2023. Compared to my last report on the company, I’ve reduced my margin estimate for the year because the first quarter’s performance missed my expectations.
Loan Growth to the Rescue
As expected, loan growth slowed down during the first quarter of 2023 from an exceptionally high rate last year. For the remainder of this year, I’m expecting loan growth to decline further from the first quarter’s level. My loan growth outlook is based on the outlook for businesses in the country. Around 47% of SRCE's loans are in community banking (mostly businesses) and 53% are in specialty finance (trucks, aircraft, etc.). Therefore, the purchasing managers’ indices for the manufacturing and services industries are appropriate gauges of credit demand. As shown below, the manufacturing PMI has been contractionary (below 50) since last year, while the services PMI is on the border.
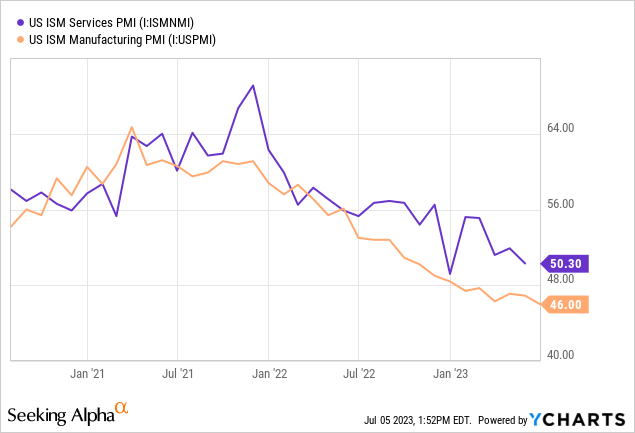
As a result, I’m expecting loan growth to decelerate significantly from last year’s level. Further, I’m expecting loan growth in the last nine months of 2023 to be below the historical 5-year CAGR of 5.8%. After incorporating the first quarter’s above-average growth, I’m estimating a loan growth of 5.6% for 2023. Further, I’m expecting deposits to grow in line with loans. The following table shows my balance sheet estimates.
| Financial Position | FY18 | FY19 | FY20 | FY21 | FY22 | FY23E |
| Net Loans | 4,735 | 4,974 | 5,349 | 5,219 | 5,872 | 6,201 |
| Growth of Net Loans | 6.8% | 5.1% | 7.5% | (2.4)% | 12.5% | 5.6% |
| Other Earning Assets | 1,034 | 1,105 | 1,394 | 2,374 | 1,842 | 1,822 |
| Deposits | 5,122 | 5,357 | 5,946 | 6,679 | 6,928 | 7,060 |
| Borrowings and Sub-Debt | 329 | 276 | 291 | 330 | 321 | 421 |
| Common equity | 762 | 828 | 887 | 916 | 864 | 973 |
| Book Value Per Share ($) | 29.4 | 32.4 | 34.7 | 37.0 | 35.0 | 39.4 |
| Tangible BVPS ($) | 26.1 | 29.1 | 31.5 | 33.6 | 31.6 | 36.0 |
| Source: SEC Filings, Author's Estimates(In USD million unless otherwise specified) | ||||||
Expecting Flattish Earnings
Despite the recent disinflation, inflation is still very high in the country. Therefore, I’m expecting operating expenses, especially salary expenses, to surge this year leading to an increase in the efficiency ratio (calculated as operating expenses divided by revenue). Further, I’m expecting the provisioning for expected loan losses to remain elevated this year due to the prospects of an economic recession.
On the other hand, the anticipated loan growth discussed above will counter the effect of higher operating and provisioning expenses. As a result, the earnings of 1st Source Corporation will likely be flattish this year. The following table shows my income statement estimates.
| Income Statement | FY18 | FY19 | FY20 | FY21 | FY22 | FY23E |
| Net interest income | 214 | 224 | 226 | 237 | 263 | 284 |
| Provision for loan losses | 19 | 16 | 36 | (4) | 13 | 17 |
| Non-interest income | 97 | 101 | 104 | 100 | 91 | 94 |
| Non-interest expense | 186 | 189 | 187 | 186 | 185 | 205 |
| Net income - Common Sh. | 82 | 92 | 81 | 118 | 120 | 119 |
| EPS - Diluted ($) | 3.16 | 3.57 | 3.17 | 4.70 | 4.84 | 4.80 |
| Source: SEC Filings, Author's Estimates(In USD million unless otherwise specified) | ||||||
In my last report, I estimated earnings of $4.94 per share for 2023. I’ve slightly reduced my earnings estimate because I’ve decreased my margin estimate for 2023.
Risk Level Appears Moderate
In my opinion, 1st Source Corporation’s risk level is neither too high nor too low. The company has three main sources of risk, as discussed below.
- The aircraft loan portfolio, which makes up around 17% of total loans, has exposure to Latin America, principally Mexico and Brazil. Therefore, 1st Source Corporation is exposed to exchange rate risk as well as the political risk of other countries.
- Uninsured deposits, excluding public fund deposits, amounted to around $2.0 billion, representing 29.14% of total deposits on March 31, 2023, as mentioned in the 10-Q filing. In comparison, the unutilized available liquidity amounted to $3.2 billion. Therefore, the uninsured deposits appear well covered.
- Unrealized losses on the Available-for-Sale securities portfolio amounted to $167.97 million, which is around a moderate 18% of the total equity balance.
Maintaining a Hold Rating
1st Source Corporation is offering a dividend yield of 3.0% at the current quarterly dividend rate of $0.32 per share. The earnings and dividend estimates suggest a payout ratio of 27% for 2023, which is close to the five-year average of 30%. Therefore, I’m not expecting an increase in the dividend level this year.
I’m using the peer average price-to-tangible book (“P/TB”) and price-to-earnings (“P/E”) multiples to value 1st Source Corporation. Peers are trading at an average P/TB ratio of 1.2 and an average P/E ratio of 7.4, as shown below.
| SRCE | WABC | STBA | SASR | HOPE | NBHC | Peer Average | |
| P/E ("ttm") | 8.6 | 7.5 | 7.4 | 6.0 | 5.2 | 11.0 | 7.4 |
| P/E ("fwd") | 9.6 | 6.9 | 7.8 | 7.3 | 6.9 | 8.0 | 7.4 |
| P/B ("ttm") | 1.2 | 1.6 | 0.9 | 0.7 | 0.5 | 1.0 | 0.9 |
| P/TB ("ttm") | 1.3 | 2.0 | 1.3 | 0.9 | 0.7 | 1.4 | 1.2 |
| Source: Seeking Alpha | |||||||
Multiplying the average P/TB multiple with the forecast tangible book value per share of $36.0 gives a target price of $44.7 for the end of 2023. This price target implies a 4.1% upside from the July 3 closing price. The following table shows the sensitivity of the target price to the P/TB ratio.
| P/TB Multiple | 1.04x | 1.14x | 1.24x | 1.34x | 1.44x |
| TBVPS - Dec 2023 ($) | 36.0 | 36.0 | 36.0 | 36.0 | 36.0 |
| Target Price ($) | 37.5 | 41.1 | 44.7 | 48.3 | 51.9 |
| Market Price ($) | 43.0 | 43.0 | 43.0 | 43.0 | 43.0 |
| Upside/(Downside) | (12.7)% | (4.3)% | 4.1% | 12.4% | 20.8% |
| Source: Author's Estimates |
Multiplying the average P/E multiple with the forecast earnings per share of $4.8 gives a target price of $35.7 for the end of 2023. This price target implies a 17.0% downside from the July 3 closing price. The following table shows the sensitivity of the target price to the P/E ratio.
| P/E Multiple | 5.4x | 6.4x | 7.4x | 8.4x | 9.4x |
| EPS 2023 ($) | 4.80 | 4.80 | 4.80 | 4.80 | 4.80 |
| Target Price ($) | 26.1 | 30.9 | 35.7 | 40.5 | 45.3 |
| Market Price ($) | 43.0 | 43.0 | 43.0 | 43.0 | 43.0 |
| Upside/(Downside) | (39.3)% | (28.2)% | (17.0)% | (5.8)% | 5.3% |
| Source: Author's Estimates |
Equally weighting the target prices from the two valuation methods gives a combined target price of $40.2, which implies a 6.5% downside from the current market price. Adding the forward dividend yield gives a total expected return of negative 3.5%. Hence, I’m maintaining a hold rating on 1st Source Corporation.
This article was written by

Analyst’s Disclosure: I/we have no stock, option or similar derivative position in any of the companies mentioned, and no plans to initiate any such positions within the next 72 hours. I wrote this article myself, and it expresses my own opinions. I am not receiving compensation for it (other than from Seeking Alpha). I have no business relationship with any company whose stock is mentioned in this article.
Disclaimer: This article is not financial advice. Investors are expected to consider their investment objectives and constraints before investing in the stock(s) mentioned in the article.
Seeking Alpha's Disclosure: Past performance is no guarantee of future results. No recommendation or advice is being given as to whether any investment is suitable for a particular investor. Any views or opinions expressed above may not reflect those of Seeking Alpha as a whole. Seeking Alpha is not a licensed securities dealer, broker or US investment adviser or investment bank. Our analysts are third party authors that include both professional investors and individual investors who may not be licensed or certified by any institute or regulatory body.