AT&T: Buyers Are About To Strike

Summary
- AT&T stock has stabilized after rumors of Amazon entering the wireless space, with management's assuring response at a June conference further calming investors' fears.
- I gleaned that T's pessimism likely peaked in June, with dip buyers returning to defend those lows. Buying sentiment has improved further, with sellers probably exhausted.
- AT&T remains on track to post $16B in free cash flow, possibly more. In addition, management seems confident that its execution risks have declined.
- With constructive price action and valuation, I assessed that investors have likely reflected a significant discount on T's recovery in the second half, making its shares attractive.
- Upgrade to Strong Buy.
- Ultimate Growth Investing members get exclusive access to our real-world portfolio. See all our investments here »
Justin Sullivan
AT&T Inc. (NYSE:T) investors have breathed a sigh of relief after seeing T hammered into its early June lows, culminating with the rumor that Amazon (AMZN) intended to enter the wireless space.
I updated investors in my previous article that despite the potential threat then, AT&T investors shouldn't flee. T could be near/at peak pessimism, as the rumor could help "shake off the last of the weak holders."
T's price action over the past month has been constructive, increasing my confidence that its bottoming process is sound and robust. Moreover, management came in strong at a recent June conference, stressing that "there is nothing to the rumors that have been discussed."
As such, it likely helped calm investor nerves about potential disruption rumors that probably saw weak investors bailing out, fearing for the safety of their dividends.
Moreover, AT&T strengthened its thesis with income investors as it declared a quarterly dividend of $0.2775 recently, debunking investors' worries about a potential cut. As such, I believe it has improved investor confidence in the company's ability to navigate the uncertain macroeconomic conditions in the second half, as AT&T maintained its $16B free cash flow or FCF outlook for FY23.
CFO Pascal Desroches provided fresh insights into the company's FCF guidance ahead of its upcoming Q2 earnings release on July 26. Accordingly, AT&T expects to deliver an FCF of between $3.5B to $4B, a significant improvement from its disappointing $1B in FCF for Q1. As such, it implies that Q1's performance was likely a one-off and not expected to be repeated.
Notably, Desroches also articulated that he doesn't anticipate further working capital effects in the second half that could throw up nasty surprises on AT&T FCF projections. In addition, AT&T is optimistic about seasonal boosts in the second half with lower device payments, lifting the company's confidence about achieving an FCF of "$16 billion or better."
Therefore, I believe it likely helped mitigate initial worries about lower new subscriber adds of 300K, markedly below the previous analysts' estimates. As such, I assessed that management commentary suggests that AT&T's growth could inflect in the second half, even though AT&T wasn't keen on guiding this early.
So, I believe investors must assess whether market operators have bought into management's confidence in its FCF projections or if they see higher risks to their dividend payout.
Does it matter? I think it does. Considering that market strategists remain divided in their opinion of a recession, some worried buyers could still be on the sidelines, waiting for the "all-clear" signal first. As such, buying sentiment could remain tepid from momentum investors who aren't sure about investing in companies susceptible to a recession, like AT&T.
In addition, while T last traded at a forward dividend yield of 6.9%, we need to juxtapose it against the 2Y Treasury yield, which last printed at 4.94%. Although it's higher than its 10Y average of 6%, investors should reflect a reasonable margin of safety against the 2Y when pricing in T's valuation, given its debt-laden (net debt: $166.7B) balance sheet. Despite that, with the Fed expected to be much closer to the end of its rate hikes, it's reasonable to expect that T's pessimism could have peaked last month.
The question now is whether it has been reflected in its price action.
T price chart (weekly) (TradingView)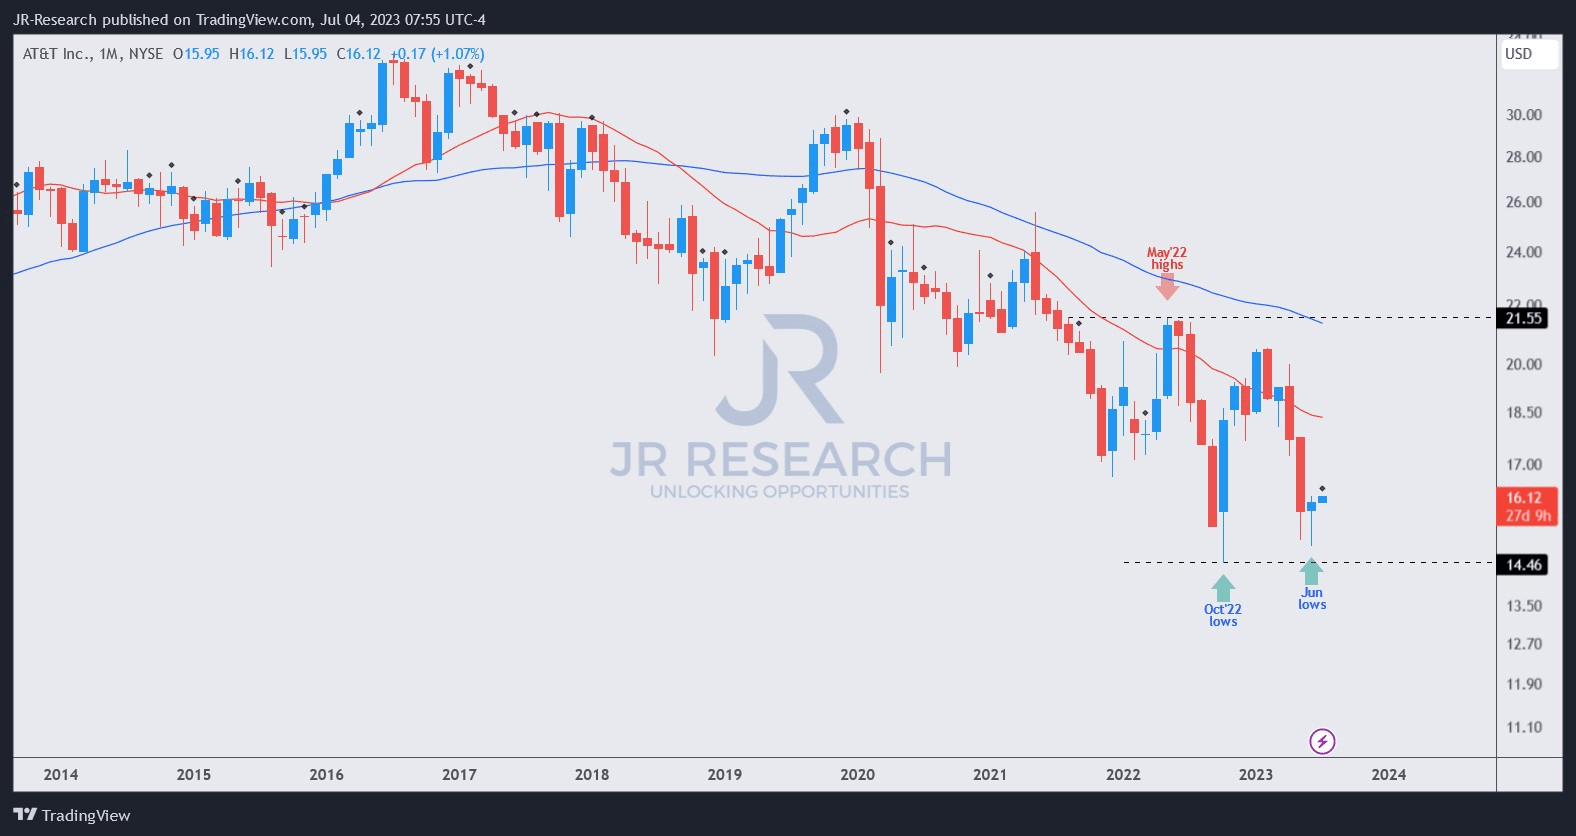
As seen above, T's long-term chart indicates that the bottoming process in June was robust, and July has started positively. Dip buyers returned in June to robustly defend the early month selloff, protecting the lows established in October 2022.
As such, it has increased the possibility of a mean-reversion opportunity for T as it remains well below its critical long-term moving averages. However, with the Fed remaining hawkish, I assessed that investors must be patient if they decide to add more positions now.
Despite that, T's risk/reward profile has improved further, with the $14.50 support zone defended stoutly by dip buyers likely seeing an alluring buy zone. With that in mind, I believe the opportunity for T investors to add more exposure is increasingly attractive.
Rating: Strong Buy (Revised from Buy).
Important note: Investors are reminded to do their own due diligence and not rely on the information provided as financial advice. The rating is also not intended to time a specific entry/exit at the point of writing unless otherwise specified.
We Want To Hear From You
Have additional commentary to improve our thesis? Spotted a critical gap in our thesis? Saw something important that we didn't? Agree or disagree? Comment below and let us know why, and help everyone in the community to learn better!
This article was written by

Ultimate Growth Investing, led by founder JR Research, helps investors better understand a range of investment sectors with a focus on technology. JR specializes in growth investments, utilizing a price action-based approach backed by actionable fundamental analysis. With a powerful toolkit, JR also provides insights into market sentiments, generating actionable market-leading indicators. In addition to tech and growth, JR also offers general stock analysis across a wide range of sectors and industries, with short- to medium-term stock analysis that includes a combination of long and short setups. Join the community today to improve your investment strategy and start experiencing the quality of our service.
Seeking Alpha features JR Research as one of its Top Analysts to Follow for the Technology, Software, and the Internet category, as well as for the Growth and GARP categories.
JR Research was featured as one of Seeking Alpha's leading contributors in 2022.
About JR: He was previously an Executive Director with a global financial services corporation and led company-wide, award-winning wealth management teams consistently ranked among the best in the company. He graduated with an Economics Degree from Asia's top-ranked National University of Singapore (NUS). NUS is also ranked among the top ten universities globally. I currently hold the rank of Major as a Commissioned Officer (Reservist) with the Singapore Armed Forces.
Analyst’s Disclosure: I/we have a beneficial long position in the shares of AMZN either through stock ownership, options, or other derivatives. I wrote this article myself, and it expresses my own opinions. I am not receiving compensation for it (other than from Seeking Alpha). I have no business relationship with any company whose stock is mentioned in this article.
I may consider initiating a beneficial long position in T over the next 72 hours.
Seeking Alpha's Disclosure: Past performance is no guarantee of future results. No recommendation or advice is being given as to whether any investment is suitable for a particular investor. Any views or opinions expressed above may not reflect those of Seeking Alpha as a whole. Seeking Alpha is not a licensed securities dealer, broker or US investment adviser or investment bank. Our analysts are third party authors that include both professional investors and individual investors who may not be licensed or certified by any institute or regulatory body.
Recommended For You
Comments (19)
Deal $'s represent equity used in acquisitions (assumption of debt the typical arrangement).1997 Starting Point - SBC $40B market cap
1997 - Buys Pacific Bell $17B
1998 - Buys SNET $4B
2000 - Buys Ameritrch $81B
2004 - Buys AT&T Wireless $24B (60%)
2005 - Buys AT&T $16B
2006 - Buys Bell South $67B
2015 - Buys DTV $49B
2016 - Buys Warner $85BTotal counting starting point - $383B
Less Warner Spin. -($43B)
Net: $340BMarket Cap after Warner spin $115B
Equity Shrinkage $225B gone!


