Labor Market Preview: Underneath All That Glitz - It's Getting Ugly

Summary
- The labor and stock markets appear strong, but leading indicators suggest a recessionary state.
- The labor market is expected to weaken following negative fixed investment data. The unemployment rate increased from 3.4% to 3.7% in May, and jobless claims have been rising since October 2022, suggesting the beginning of a recession.
- Despite the economy entering a recession, the Fed is expected to continue tightening monetary policy. This could extend and worsen the recession in.

peterschreiber.media
Beautiful, yet ugly, contradictory, but it's funny how,
things could look so beautiful, but underneath all that glitz,
they're ugly. MacroT
The lyrics above reflect the current situation in the labor market, as well as the stock market. On the surface, the labor market is very strong, but the leading indicators such as the claims for employment are, in what historically has been, a recessionary state. Similarly, the tech-heavy NASDAQ 100 (QQQ) has the best H1 performance ever, while the cyclically-heavy Dow Jones (DJI) is essentially flat for the year.
The context
The Fed has been tightening monetary policy since March 2022 - for 18 months now, and it has been one of the most aggressive tightening campaigns ever.
During this process, the Fed inverted the yield curve 10Y-3mo yield curve spread by the record amount - and this signals a very deep recession. Currently we are waiting for the effects of this monetary policy tightening, which come with lags. This is one of the key expected monetary policy tightening transmission mechanisms:
- The inverted yield curve causes credit tightness, or limits the external capital to firms.
- Thus, firms, and particularly risky/overleveraged firms, decrease their investment, and reduce employment.
- The resulting spike in unemployment causes a recession.
The employment situation
Well, the recent GDP report shows that the real gross private investment decreased by 3.1% in Q1 23 from Q4 22, and decreased by 8.1% YOY from Q1 22. That's the effect on monetary policy tightening on fixed investment - we are entering a recession based on this data.
The next shoe to drop is higher unemployment. On the surface, the labor market is still very tight, but it's expected to follow the negative fixed investment data and significantly weaken. However, these are the current two headline labor market metrices:
- Unemployment rate: 3.4% in April, but spiked to 3.7% in May - expected to fall back to 3.6% in June. This really reflects a full employment situation.
- Payrolls: there were 339K non-farm new jobs created, based on the Establishment Survey in May, and this is expected to decrease to 225K in June. So, some moderation is expected.
Key point to watch
- As previously mentioned, the unemployment rate increased from 3.4% to 3.7% in May, and the number of employed people decreased by 310K in May, which implies that 310K jobs were lost.
- In contrast, the Establishment Survey shows that there were 339K jobs added in May. So, this is conflicting data.
- Thus, it's interesting to see if there are revisions to both surveys for June, and which trend the new data confirms - job losses or job gains. Is the unemployment rate already starting to reflect the lagged effects of monetary policy tightening?
The leading labor market indicators
The leading labor market indicators are suggesting that the labor market is significantly weakening, which is consistent with the beginning of a recession. Note, the unemployment rate and the payrolls are both lagging indicators, and both turn negative as the recession is well underway.
Claims for unemployment
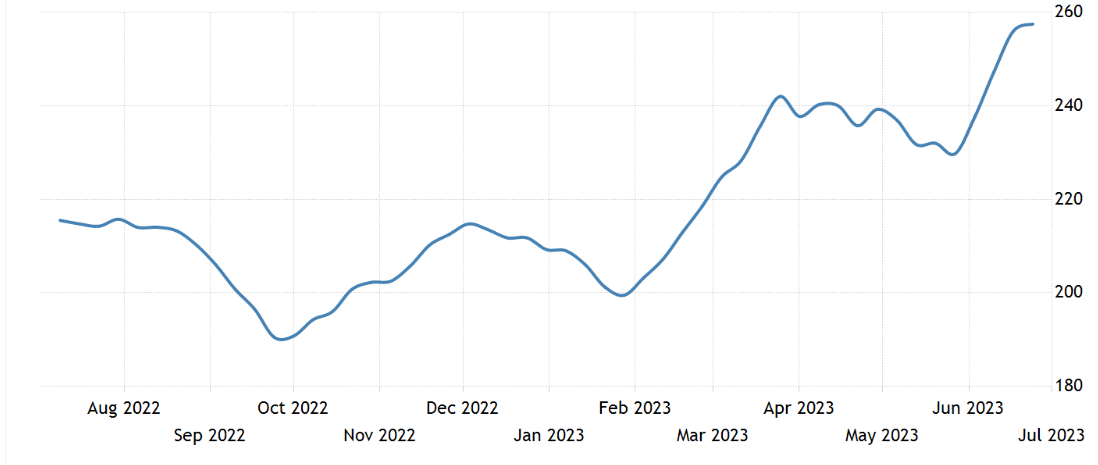
Here is the 4-week average of the initial claims for unemployment - the trend has been gradually rising since October 2022.
FRED
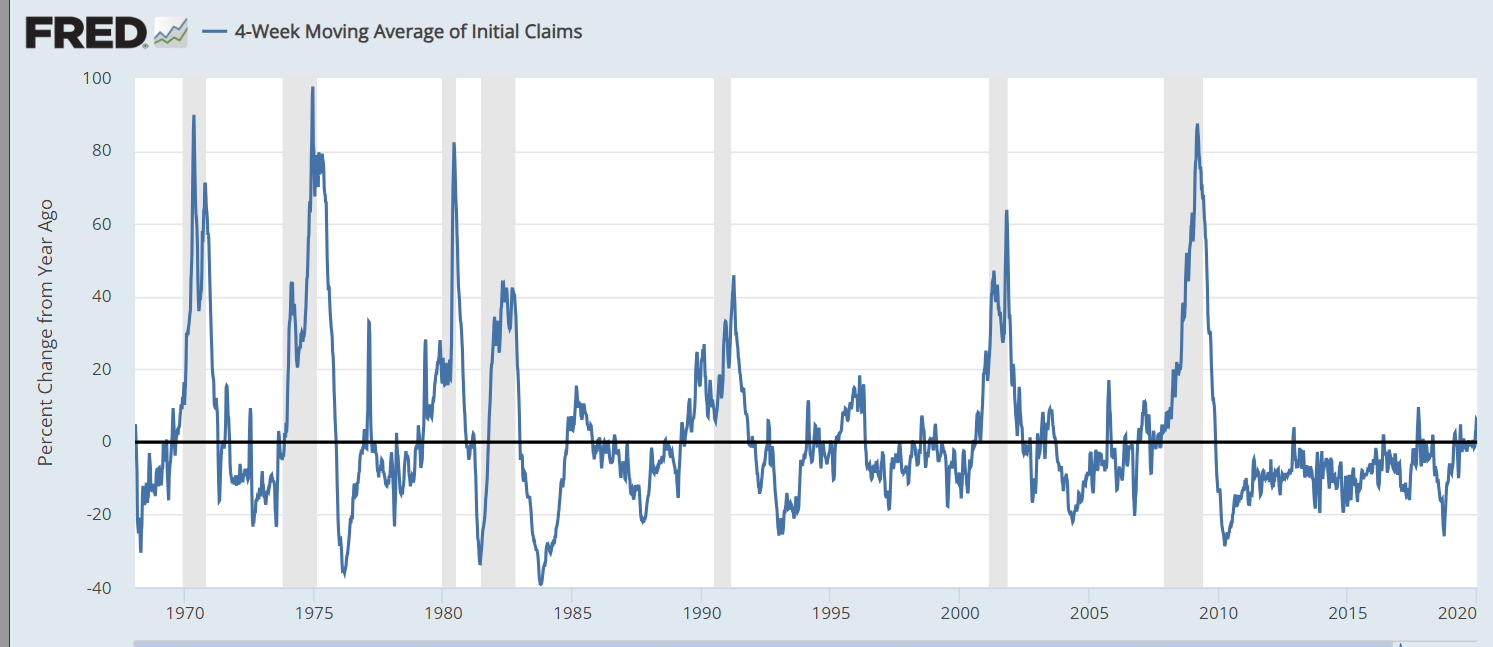
More importantly, the number (for the claims) last week was 20% higher than the number last year. To put this in perspective, a 20% spike YOY in claims has historically only happened in recessions. Here is the chart that goes up to 2020, it does not show the current period because the covid period distorted the picture.
FRED
The fact that the initial claims are spiking 20% YOY is validating the monetary policy tightening transmission mechanism as described above - the employment data is weakening.
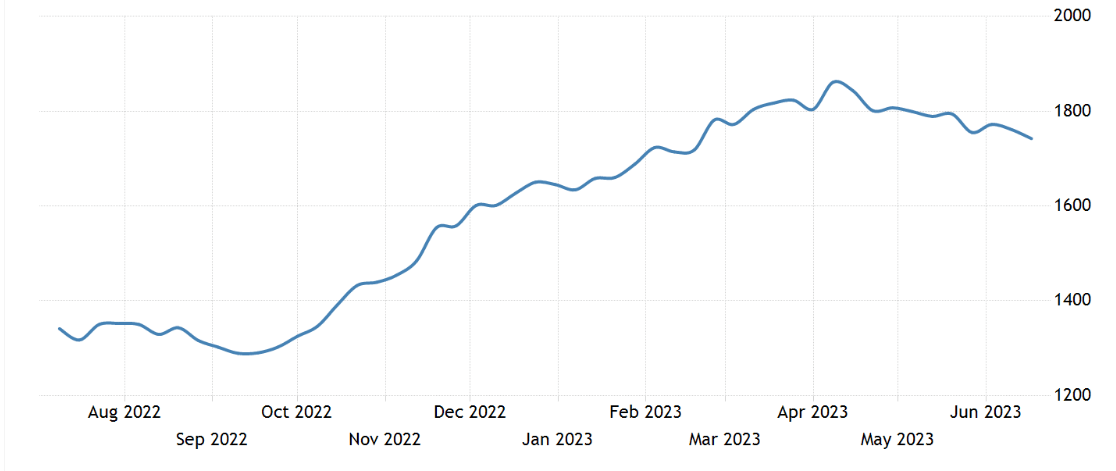
Let's look at the continued jobless claims - the trend has also been higher since October 2022. In fact, the current number is 30% higher compared to the same period last year.
Trading Economics
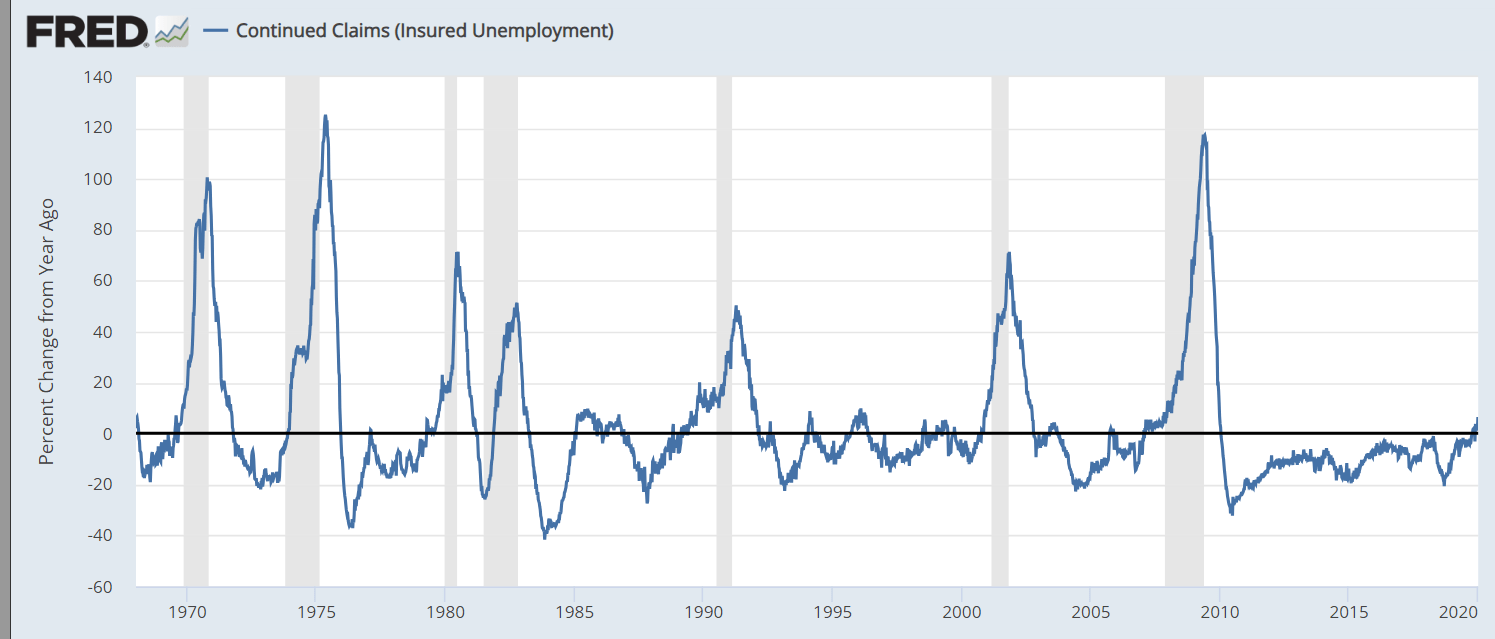
Here is the long-term chart that also goes to 2020 (does not show the current period), which clearly indicates that a 30% increase in the continued claims YOY is only associated with recessions.
FRED
Combined, the claims data shows that a lot more people have been losing their jobs, and it's taking much longer to find a new job. This is consistent with the beginning of a recession.
The jobless claims data is released on Thursday, and the expectation is that the initial claims will rise to 245K from 239K last week. But, last week there was a significant drop from 262K to 239K, so it's also important to see if there are any revisions.
The weekly hours worked
The weekly hours worked is another leading indicator, as the chart below shows, the number has been falling from 35hr/week to currently 34.3hr/week, which points to a weakening labor market. The hypothesis is that companies first reduce the number of hours worked, before reducing the headcount. The expectation is that the number of hours worked with stay constant at 34.3 in June.
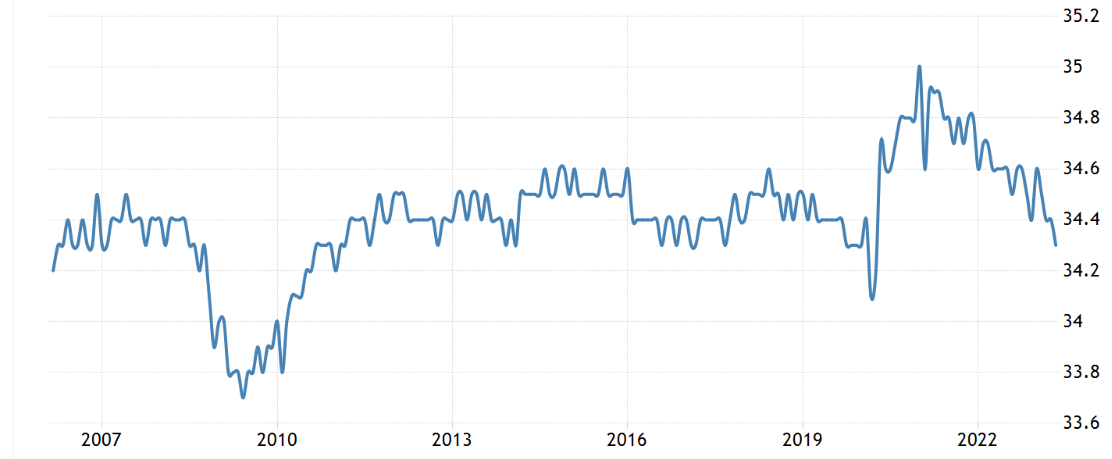
Trading Economics
What about the labor shortage?
In addition to a low unemployment rate, there are still about 10 million job openings, which indicates a strong labor market, and also a serious labor shortage.
However, the job opening also decreased by about 20% since last year, and this is also indicative of a weakening labor market.
At the same time, about 40% of all job openings are in the area of health care and education. These are not cyclical jobs, and they have not decreased much since the peak. Due to demographics and social trends, the shortage of health workers and teachers will likely persist.
The cyclical jobs related to manufacturing and construction are the ones decreasing the most - and these are consistent with the tightening monetary policy.
The JOTLs data will be released in Thursday, and it's expected to show a modest decline in June to 9.9mil.
The major implication of the job shortage is rising wages, which keeps the labor-intensive core inflation sticky and increases the risk of the wage-price inflationary spiral. The average wage hourly earnings are expected to dip to 4.2% in June from 4.3% in May, which is still well above the 3.5% wage growth consistent with the 2% target inflation.
Thus, the Fed is still expected to continue tightening monetary policy, hiking at least an additional 50bpt in 2023, and possibly more, despite the fact that the economy is already entering a recession. Not only are we waiting for the lagged effects of the prior monetary policy tightening, but we need to consider the effects of future monetary policy tightening. This implies that the current early stages of a recession will likely extend and worsen in 2024.
Investment implications
Just like the labor market, the stock market has been on the surface very strong in 2023, with S&P500 (SP500) up by over 16% ytd. However, under the surface, the stock market is still in the bear market that started in Jan 2022. Specifically, the Dow Jones Industrials is up only by 3% ytd.
The ETF that tracks Dow Jones (NYSEARCA:DIA) is heavily exposed to cyclical sector, about 55% of DIA is cyclical. Specifically, about 20% of index are Financials (sensitive to higher interest rates, inverted yield curve and recession), about 20% are Industrials, Materials, and Energy (all sensitive to business investment), and about 14% are Consumer Cyclical companies (sensitive to labor market). Any gains in DIA in 2023 were likely due to about 19% exposure to Technology.
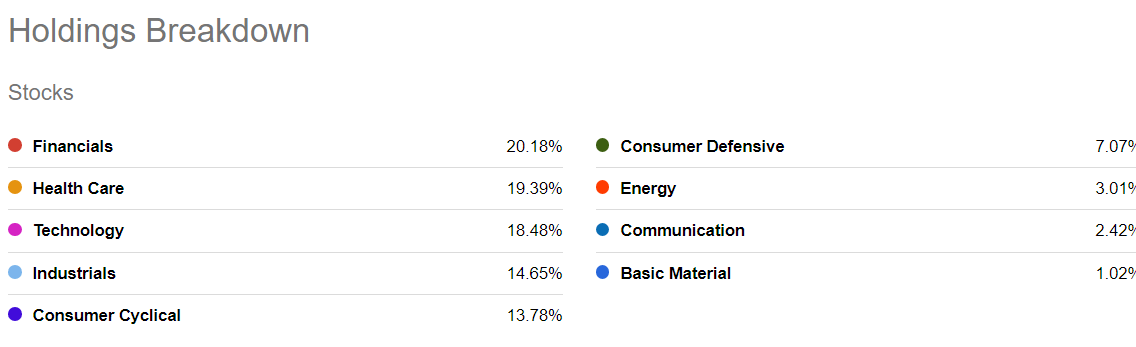
Seeking Alpha
The major bullish thesis is the catch up trade - meaning the weak parts of the market, such as DIA will catch up with the strong parts of the market, which will extend the "new bull market".
This is very unlikely to happen, given that the leading indicators are pointing to a weakening labor market, and we are essentially just entering a recession. On top of that, the Fed is still likely to continue to tighten monetary policy. The catch down trade is more likely.
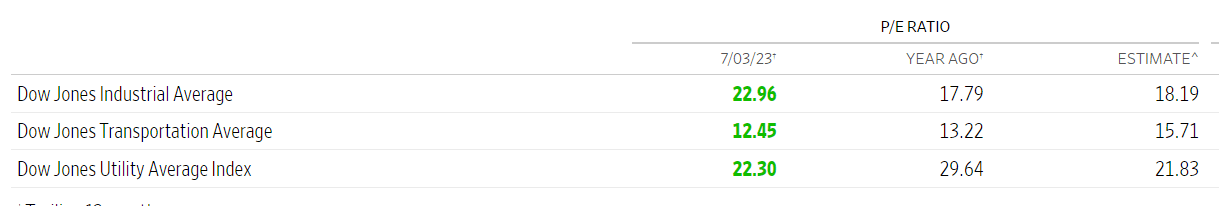
Wall Street Journal
With respect to DIA, the valuation is high, given the fact that we are waiting for the acceleration of the downturn as the lagged effects of the monetary policy tightening start to get stronger. The current ttm PE ratio for DIA is almost 23, and it was 17 last year. So, the cyclical DIA index is also significantly overvalued. For this reason, the current strength in the market is the opportunity to get out.
This article was written by

Analyst’s Disclosure: I/we have a beneficial short position in the shares of SPX either through stock ownership, options, or other derivatives. I wrote this article myself, and it expresses my own opinions. I am not receiving compensation for it (other than from Seeking Alpha). I have no business relationship with any company whose stock is mentioned in this article.
Seeking Alpha's Disclosure: Past performance is no guarantee of future results. No recommendation or advice is being given as to whether any investment is suitable for a particular investor. Any views or opinions expressed above may not reflect those of Seeking Alpha as a whole. Seeking Alpha is not a licensed securities dealer, broker or US investment adviser or investment bank. Our analysts are third party authors that include both professional investors and individual investors who may not be licensed or certified by any institute or regulatory body.
Recommended For You
Comments (4)

