GUSH: More Than Double The Pain

Summary
- The Direxion Daily S&P Oil & Gas Exp. & Prod. Bull 2X Shares ETF is a leveraged ETF that aims to seek 2x the daily performance of the S&P Oil & Gas Exploration & Production Select Industry Index.
- GUSH has an annualized volatility of about 80%, which is twice as much as XOP and more than four times that of SPY, and it is likely to underperform the index unless it achieves significant returns.
- The ETF is not recommended for long-term investment due to its high volatility and vulnerability to downside risk, but it can provide a good 2x exposure to the underlying index for investors seeking such an opportunity.
Everyday better to do everything you love
The energy sector has recently been under pressure since the European crisis, shortly followed by the Ukraine-Russia war which pushes oil prices to extreme volatility. For anyone seeking for more volatility in an already highly volatile sector, Direxion Daily S&P Oil & Gas Exp. & Prod. Bull 2X Shares ETF (NYSEARCA:GUSH) may just be what you're looking for. Just before that, this article is what you need to walk through some of the key quantitative risks you may not be aware of.
GUSH is a leveraged ETF aiming to seek 2x the daily performance of S&P Oil & Gas Exploration & Production Select Industry Index. There are already 2 major caveats just with the fund objective alone. Firstly, 2x daily performance is not at all equivalent to 2x returns over the long-term (even just beyond 1 day horizon) due to the compounding effects. You may read more from the Seeking Alpha's introduction to Leveraged ETF to understand the dynamics better. Secondly, GUSH actually does not fully replicate the index as it has certain minimum market cap ($300-$500 million) & liquidity ratio criteria, and all invested companies are only US-based. This means that the ETF would exclude smaller cap companies or companies with insufficient liquidity ratio, even though the index is dominated by large cap names with a median market cap of $4.3 billion.
As of Q1 2023, the fund holds a large proportion of Treasuries for liquidity purpose when trading derivatives to achieve leveraged outcome, while some of its top holdings seem misaligned with the index top holdings. The fund may be achieving exposure on some companies through derivatives.
Author, Yahoo Finance Direxion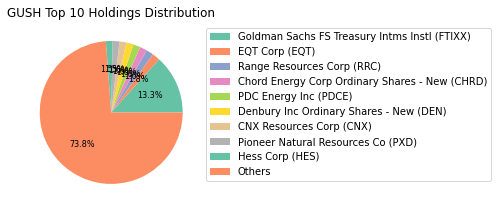

Performance & Risk Analysis
Since 2021, GUSH has outperformed all of its peers including the XOP which tracks the underlying index for GUSH. The 150% cumulative return was mostly driven by the energy rally in 2022, making the returns of S&P 500 (SPY) negligible throughout this period.
Author, Yahoo Finance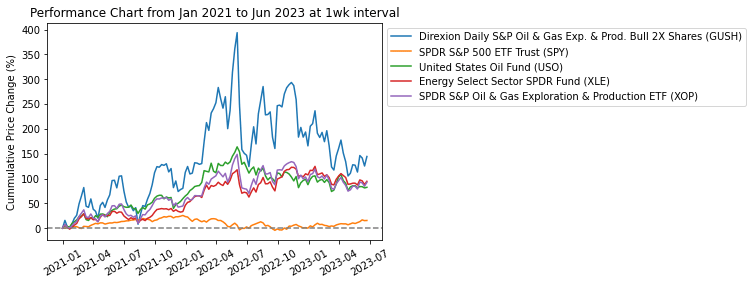
However, if you've bought the ETF since pre-Covid, you would have lost almost all of your money when oil prices sank during April 2020 to record low levels. The chart below clearly illustrates the main disadvantage of GUSH as large losses cannot be simply offset with returns in the future due to the outsized effect in losing capital base. As a comparison, the XOP which dropped more than 50% by April 2020 has now recovered to be gaining ~30%.
Author, Yahoo Finance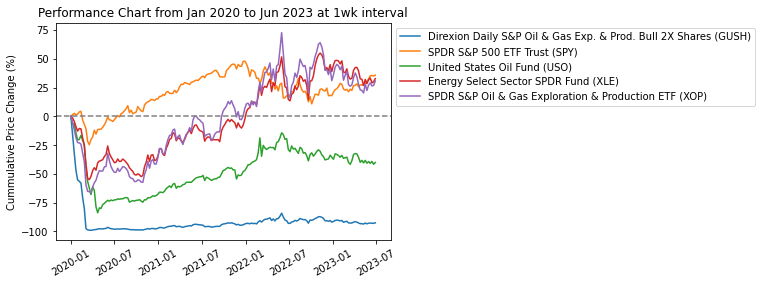
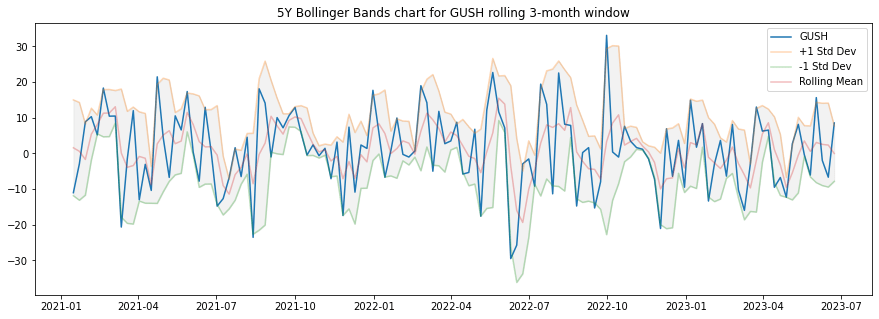
Another bombshell to drop: GUSH has an overwhelming ~80% annualized volatility which is about twice as much as XOP and more than 4 times of SPY. Looking at the Bollinger Bands chart, the fund has frequently exceeded its standard deviation, demonstrating the high volatility in play.
Author, Yahoo Finance Author, Yahoo Finance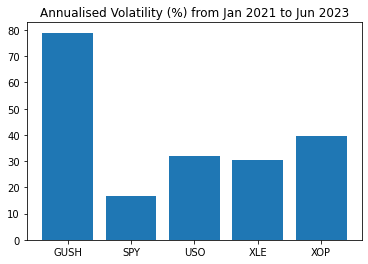
With such a high volatility, the fund is almost guaranteed to underperform even just the index itself (without leverage) unless significant return is achieved (>60%, which was what happened during 2022).
For instance, if the Index's annualized volatility is 100%, the Fund would be expected to lose 63.2% of its value, even if the cumulative Index return for the year was 0%." - Extracted from the Fund's Prospectus
Direction - GUSH's Prospectus
On the other hand, the fund has mostly been doing what it is supposed to do with rolling Beta (to XOP) closely navigating around 2 since 2021 - which basically means GUSH moves by 2 whenever XOP moves by 1, hence achieving the 2x leverage effect.
Author, Yahoo Finance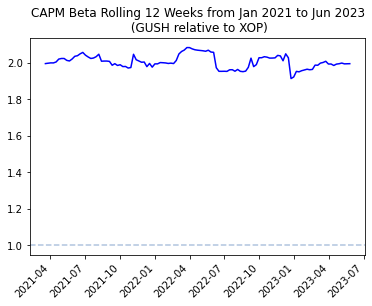
The tight correlation between GUSH and XOP (staying very close to 1) also indicates the close proximity and ability of the ETF to effectively track exposure of its underlying index.
Author, Yahoo Finance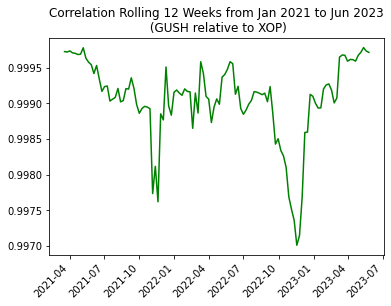
Besides, there have been several occasions where rolling Alpha levels fluctuate significantly, while it has been mostly negative since the start of 2023.
Author, Yahoo Finance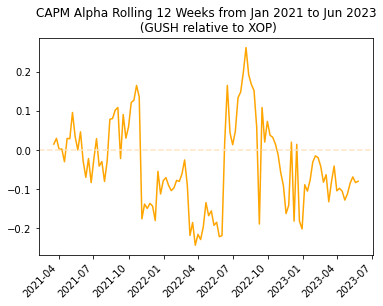
Fundamental Deep Dives
Looking across the fundamentals of top holdings within GUSH, they are mostly trading at cheap valuations with PE ratio ranging between 2.3x and 20.4x, with PB ratio as low as 0.8x. For context, S&P 500 is currently trading at around 22x P/E, while XOP trades lower at 4x P/E and XLE at 7.2x.
Author, Yahoo Finance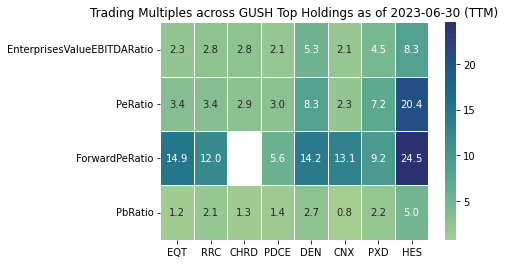
With most of these companies being energy producers which benefited hugely from the energy rally last year, the profitability metrics look phenomenal with return on equity as high as 86.5%. This is expected to come down to average levels as the energy market cools down with revenues estimated to drop.
Author, Yahoo Finance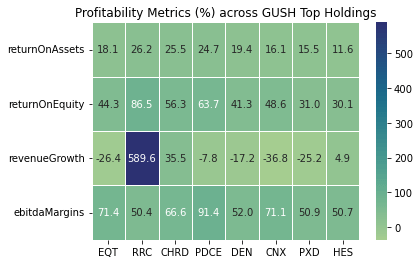
Even though most of its top holdings have relatively low levels of debt, their quick ratios are often below 1 (meaning current assets + inventory is lower than current liabilities). This may be perceived as unhealthy although it is quite a norm for the oil & gas industry.
Author, Yahoo Finance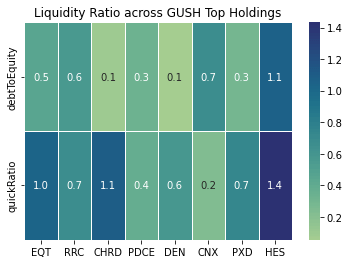
Conclusion
Similar to other leveraged ETF, GUSH is not designed to be held for long-term investment due to the extreme levels of volatility and high vulnerability towards downside risk. However, the fund does maintain a good 2x exposure with close proximity to the underlying index for any investor seeking for such opportunity.
This article was written by

Analyst’s Disclosure: I/we have no stock, option or similar derivative position in any of the companies mentioned, and no plans to initiate any such positions within the next 72 hours. I wrote this article myself, and it expresses my own opinions. I am not receiving compensation for it (other than from Seeking Alpha). I have no business relationship with any company whose stock is mentioned in this article.
Seeking Alpha's Disclosure: Past performance is no guarantee of future results. No recommendation or advice is being given as to whether any investment is suitable for a particular investor. Any views or opinions expressed above may not reflect those of Seeking Alpha as a whole. Seeking Alpha is not a licensed securities dealer, broker or US investment adviser or investment bank. Our analysts are third party authors that include both professional investors and individual investors who may not be licensed or certified by any institute or regulatory body.