This Week's Sentiment Review: Is This Mini-Bull Market Finally Over?

Summary
- While bullishness is rising, it's still not yet reached the extreme levels that usually precede a major market correction. But it is getting close.
- The current sentiment readings of many indicators suggest that stock prices will continue to rise for a while longer.
- The article explains why a price target of 4,800 on the S&P 500 is still the most likely.

H-Gall/E+ via Getty Images
Sentiment is the tool that will tell you when this mini-bull market is over. Since over 50% of the stock market can be driven by emotion alone, we carefully measure what investors are thinking and doing to gain insight into this part of investing.
The Master Sentiment Indicators
We have two master sentiment indicators made by combining other sentiment indicators into one. One is short term, the other long term.
This first chart is the long term master sentiment indicator called the MSI and is a composite of nine indicators.
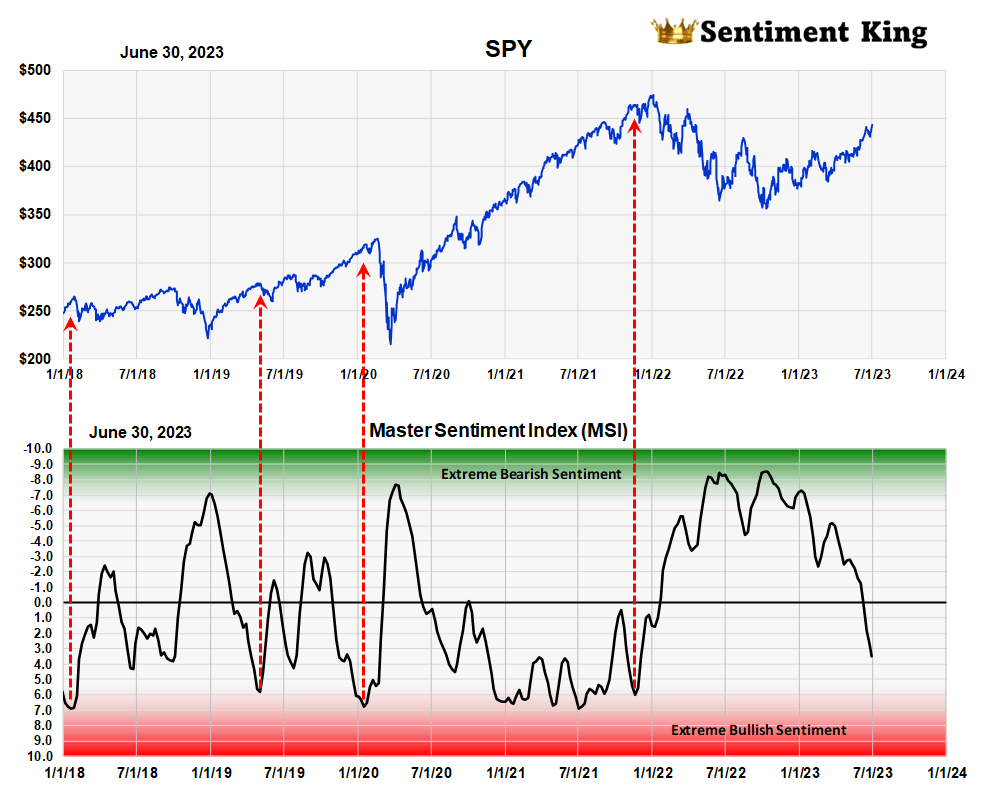
Master Sentiment Indicator (Sentiment King)
The chart highlights the well-established fact that major lows don’t occur until you first get extreme levels of bearish sentiment (green zone) like last summer.
Once the market begins to move up, major tops don’t occur until after the majority have turned extremely bullish (red zone). We’ve indicated key moments of red zone readings in the past.
This becomes a very useful guide. The rule is: don’t look for a market top until sentiment first reaches a red zone reading. You can have a red zone reading without a market top but we've never seen a significant decline begin without sentiment becoming extreme bullish.
As you can see from the chart, since last year's buy signal, sentiment has been getting closer to the red zone - but it isn't there yet.
The short term master sentiment indicator, which is the chart below, confirms this conclusion.
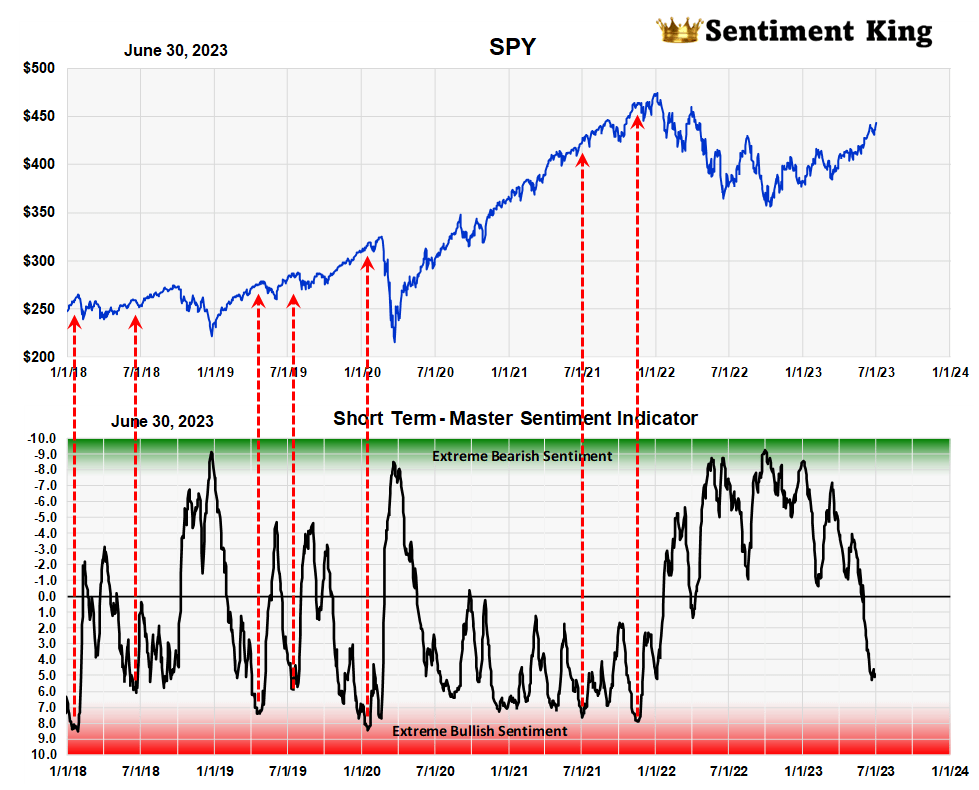
Short Term - Mater Sentiment Indicator (Sentiment King)
No major decline of any importance has started without sentiment first moving into the red zone. What this ultimately means is that major declines will not start until investors have first become universally bullish on the market. We don't have that condition yet.
As we forecast in this February 5th article, we don’t expect red zone readings until the market has first reached last year’s high of 4,800 on the S&P 500.
Investor Surveys
Five investment surveys are important components to our master sentiment indicators. The surveys are shown in the table below.
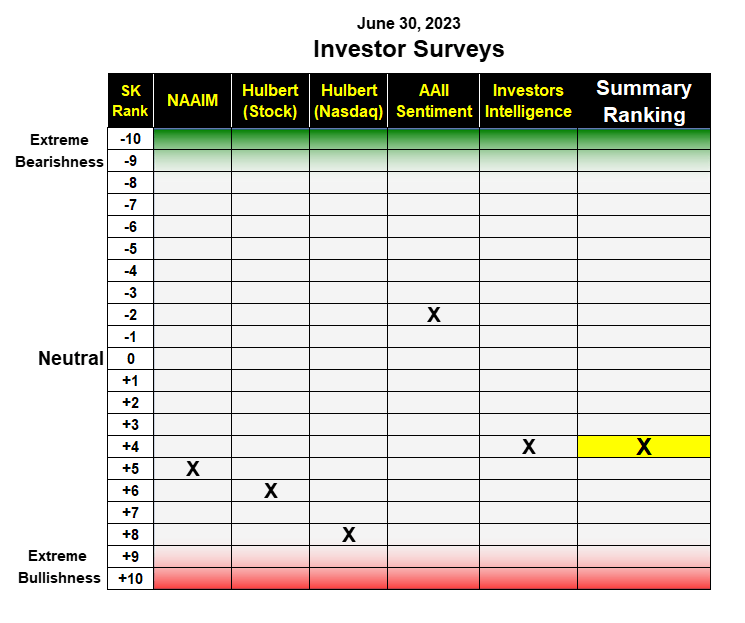
Table of Inventor Sentiment Surveys (Sentiment King)
The AAII Member Sentiment Survey – Forty two percent of members last week were bullish while only 27% were bearish. Our moving average of these weekly readings is -2, which is just above neutral.
Investors Intelligence Newsletter Survey – This survey of newsletter writers, which goes back to 1963, has 50% of writers bullish, while 18% are bearish. Thirty one percent are expecting a market correction. Our ranking of this survey is currently +4, which is still far from the red zone.
NAAIM Exposure Index - The American Association of Active Investment Managers (NAAIM) has an average investment position of 76%, which is +5 on our scale. This too is far from the red zone.
Hulbert Stock Survey - The Hulbert stock market survey of newsletter writers has a ranking of +6, which represents increased bullish expectations.
Hulbert Nasdaq Survey - The Hulbert Nasdaq survey, at +7, is just shy of a red zone reading. This reflects the strong price gains from this sector of the market. If prices move higher, we expect this sentiment indicator to finally give a red zone reading.
Summary Ranking - The summary of all five surveys, indicated by the yellow X, is now +4. This is far from being "too bullish" and is a positive sign that stock prices are headed higher.
Investor Activity
We also analyze what investors are buying and selling to gain insight into what they expect the stock market to do. We look at six measures of investor activity. Five of them are calculated every day.
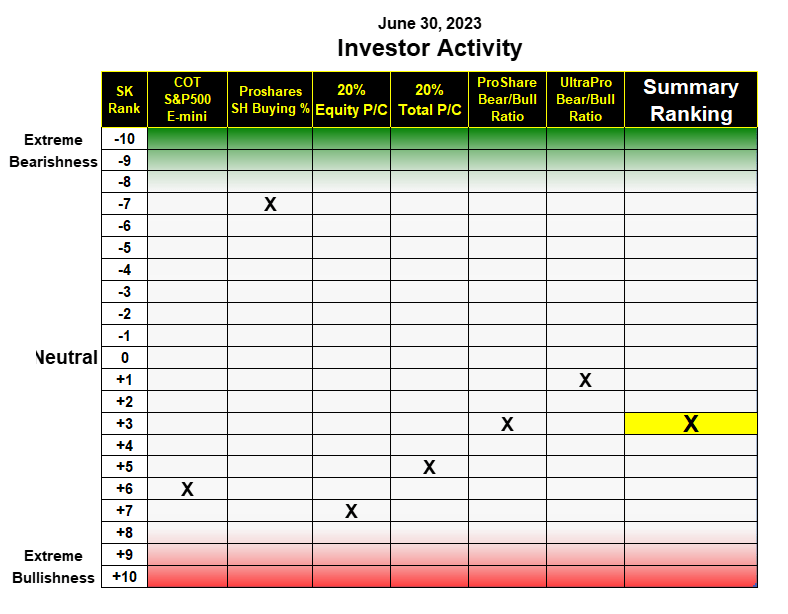
Table of Investor Sentiment Activity (Sentiment King)
Puts and Calls Ratio – Our moving average of the equity "puts to calls" ratio is .6, while the ratio of total options, including index options, is .91. This located the equity P/C ratio at +7 on our scale, while the total P/C ratio is +5. As you can see, of all investor activity indicators, the equity "puts to calls" ratio is nearest the red zone.
S&P 500 E-mini COT – The low short position of asset managers in the E-mini S&P futures puts this indicator at +6 on the ranking scale. If the market continues higher, as we expect, we can see this indicator moving to +8 very soon.
ProShares Short S&P 500 fund (SH) – Investor buying of this short fund, at an average rate of 12% of assets a day, continues to be historically high. This is why this one indicator still remains near the green zone. We can't see the rally over and a major decline started until buying of the short fund drops significantly.
ProShare Bear/Bull Ratio - The ratio of investors buying ProShares short funds versus long funds was unchanged at +3 on the ranking scale. This means there is still too much money going into short funds, which is a positive indicator for higher prices.
ProShare Ultra Pro Bear/Bull Ratio – The ratio of the money going into the six largest Ultra Pro long and short funds is +1 on the ranking scale. Neither of these two ProShare indicators are near the red zone.
Summary Ranking - The summary ranking of all six metrics of investor activity rose one to +3. This is still far from being "too bullish" and another positive sign for higher stock prices.
Conclusion
While bullish sentiment continues to increase, the current readings are short of the extreme readings that normally occur before prices begin a major correction. We follow the principle that a major decline won't occur until after sentiment indicators have first reached red zone readings.
This article was written by

Analyst’s Disclosure: I/we have no stock, option or similar derivative position in any of the companies mentioned, and no plans to initiate any such positions within the next 72 hours. I wrote this article myself, and it expresses my own opinions. I am not receiving compensation for it (other than from Seeking Alpha). I have no business relationship with any company whose stock is mentioned in this article.
Seeking Alpha's Disclosure: Past performance is no guarantee of future results. No recommendation or advice is being given as to whether any investment is suitable for a particular investor. Any views or opinions expressed above may not reflect those of Seeking Alpha as a whole. Seeking Alpha is not a licensed securities dealer, broker or US investment adviser or investment bank. Our analysts are third party authors that include both professional investors and individual investors who may not be licensed or certified by any institute or regulatory body.