DIV Vs. SPHD - Battle Of The High-Yielding Low-Vol Space

Summary
- DIV and SPHD focus on US-based high-yielders that have a relatively low volatility quotient.
- DIV is broader in its reach, but its predilection towards small and micro-caps has so far worked against it.
- DIV offers a better yield profile, is cheaper to own, and offers better earnings potential.
Zeferli
Introduction
Investors who are seeking US-based equity portfolios which exhibit high-yield and low volatility may consider looking at either the Global X Super Dividend US ETF (NYSEARCA:DIV) or the Invesco S&P 500 High Dividend Low Volatility ETF (NYSEARCA:SPHD). Although we are ambivalent about both offerings, we will highlight some of the major differences between these two products; investors may then go with whatever floats their boat.
Screening Differentiation
Although both portfolios are on the lookout for high-yielders exhibiting low volatility, there are quite a few differences in the manner in which they perceive volatility and how they go about setting up their respective portfolios.
Firstly, SPHD's universe is limited to only the top tier of US stocks, aka, the constituents of the S&P 500; whereas DIV, has a broader reach, focusing on stocks beyond the benchmark, so long as they have a minimum market cap of $500m and 6m average daily turnover of at least $1m.
The other crucial differentiator to note is that DIV uses the beta of a security as a proxy to determine volatility (essentially it is looking for stocks with a beta of less than 0.85x vs. the S&P 500). Also, it uses the beta to weed out stocks in the first stage before proceeding to the yield screening.
With SPHD, volatility is based on the traditional measure of realized volatility or the degree of up/down movements of the stock over the past 12 months. Here SPHD looks at the volatility quotient of stocks in isolation, regardless of how they behave relative to the benchmark. Also, SPHD only uses the volatility screener in the second stage, after it has first identified the top 75 stocks from the S&P 500 that have exhibited the highest dividend yields over the past 12 months.
Whilst SPHD is happy to just go with the dividend yield screener, DIV is not content with that and also requires its constituents to have paid dividends for two years, with a >=50% YoY growth in the latest year's dividends. We are not entirely convinced the 50% YoY requirement makes a world of difference in determining sustainable quality, as that parameter could likely have produced quite a few names that would have doled out special dividends that run the risk of not being sustained.
ETF prospectuses, Author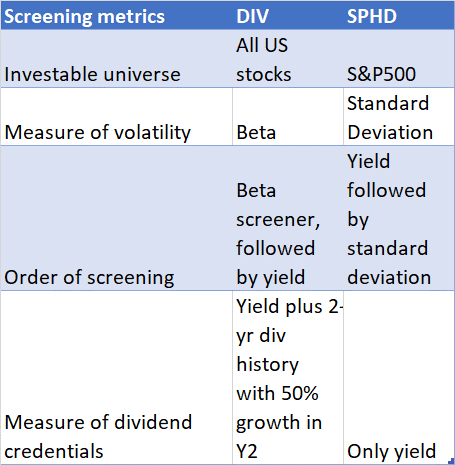
Dividend Qualities
The dividend specs may likely be the key attraction point of both these products and there are quite a few differences to highlight here as well. Firstly, note that DIV distributes dividends on a monthly basis (SPHD follows a quarterly distribution calendar), and this can be quite useful if you have alternate higher-yielding avenues where the dividends can be frequently reinvested.
In recent periods the quantum of distributions has been quite poor relative to what was seen in the past with DIV's short and long-term growth rates seeing more of a slump. On a 5-year basis, SPHD's dividends have still grown.
However, when it comes to the yield angle, clearly there's only one winner with DIV not only offering a far superior yield differential of 325bps, but its current yield is also marginally better than what you usually get (7.25%). That is not the case with SPHD.
Seeking Alpha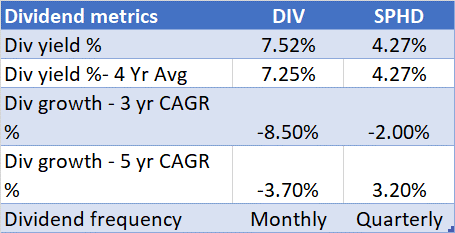
Structure
The difference between the two listing dates of both these products is less than 6x months, but look how popular the S&P 500-focused SPHD is. Its AUM is currently over 5x greater than DIV's and the average dollar volume it generates on a daily basis is 10x that of its peer.
That is relatively ironic when you consider that DIV is more cost-efficient (a 15bps difference in the respective expense ratios), and is also a portfolio that is susceptible to a lower degree of churn (portfolio turnover of 39% vs 60% for SPHD).
Seeking Alpha, ETF.com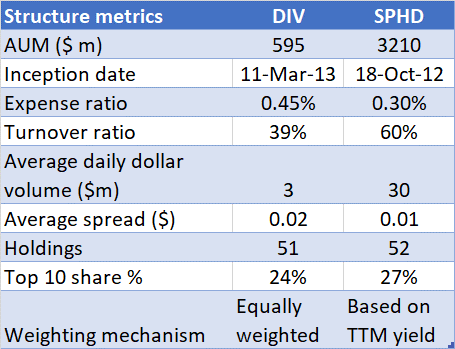
Both portfolios are not vast in their reach, offering a similar number of shares for consideration (around 50). The portfolios are also not overly exposed to any particular sector on account of cap sector weights. Besides both portfolios are also not top-heavy with the top-10 stocks only accounting for 24-27%, even though there are some weighting differences between these two products. DIV follows an equally weighted set-up, whereas SPHD follows a TTM (trailing twelve-month) div-yielding weightage system, with the highest yielders receiving a larger share.
Track Record of Returns And Managing Risk
Despite offering a higher yield differential, a more stable portfolio (in terms of churn), and better cost-efficiency, DIV's AUM progression has significantly lagged that of SPHD's; we would put the relative lack of popularity down to the quality of stock-picking on offer.
Firstly, note that SPHD has managed to deliver positive returns for its shareholders since DIV's listing date. DIV, on the other hand, has been a source of wealth destruction, losing 34% of its market cap since listing.
YCharts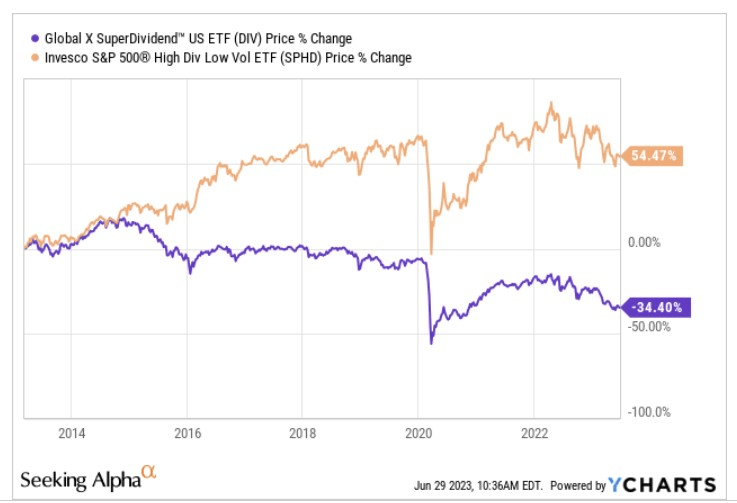
Since these are products that are supposed to be low volatility in nature, it would also pay to understand how they have fared in the face of harmful volatility or downside deviations. To get a sense of this, consider the respective Sortino ratios of both products on a short-term and long-term basis.
Over the long-term, both portfolios haven't done a good job in delivering excess returns (over the risk-free rate) in the face of downside deviation (with figures of less than 1x) but SPHD's figure is still over 3x better. Crucially over the last three years, SPHD has done well in the face of harmful volatility delivering a Sortino ratio of over 1x, even as DIV has fallen short yet again.
YCharts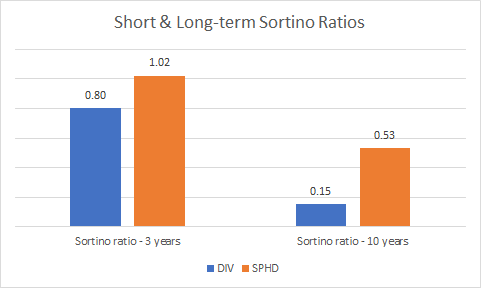
We believe the significant differentials of these two products during periods of downside deviation may be explained by the respective pockets of the market they dabble in. The image below highlights how DIV is overly exposed to the high-risk and volatile small-cap segment (within the small-cap segment also consider that 44% of the portfolio consists of micro-caps). Whereas when it comes to SPHD, as it focuses on the S&P 500, 98% of its portfolio is oriented towards large and mid-caps which have traditionally demonstrated greater resilience in the face of harmful volatility.
Morningstar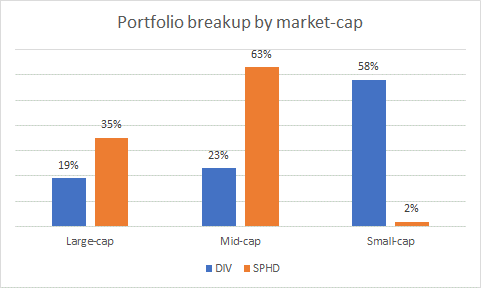
Closing Thoughts - Relative Strength And Valuations
DIV may not have fared particularly well relative to its S&P 500-focused peer, but YCharts suggests that going forward, investors are likely to get more bang for the buck (in terms of earnings growth) from the former.
For context, DIV is currently priced at only 9.4x forward P/E, a 26% discount to SPHD's corresponding multiple. At that multiple one will likely also get far superior 5-year forward earnings growth of 14% (as you would expect from a small-cap focused portfolio), almost 3x the growth potential of SPHD.
YCharts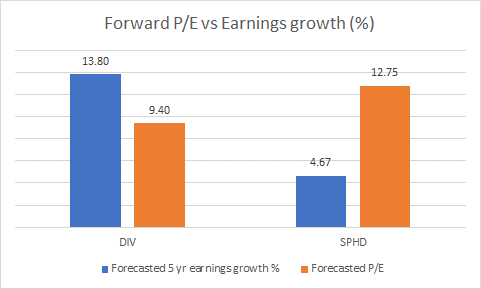
Also, if one looks at the relative strength of the two products over time, it is quite clear that DIV has been losing clout relative to SPHD. However, interestingly enough, note that the ratio has now dropped to the 0.4 levels which were last seen during the 2020 pandemic crash; a level from where DIV was quicker to recover. Could we see similar trends play out again?
YCharts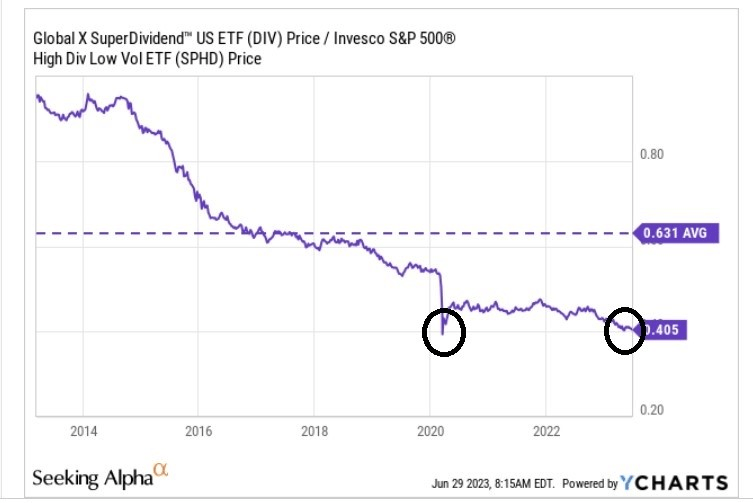
This article was written by

Analyst’s Disclosure: I/we have no stock, option or similar derivative position in any of the companies mentioned, and no plans to initiate any such positions within the next 72 hours. I wrote this article myself, and it expresses my own opinions. I am not receiving compensation for it (other than from Seeking Alpha). I have no business relationship with any company whose stock is mentioned in this article.
Seeking Alpha's Disclosure: Past performance is no guarantee of future results. No recommendation or advice is being given as to whether any investment is suitable for a particular investor. Any views or opinions expressed above may not reflect those of Seeking Alpha as a whole. Seeking Alpha is not a licensed securities dealer, broker or US investment adviser or investment bank. Our analysts are third party authors that include both professional investors and individual investors who may not be licensed or certified by any institute or regulatory body.
Recommended For You
Comments (1)
