HLAL Vs. VOO: Another Shariah ETF Beating An Unrestricted Large-Cap ETF

Summary
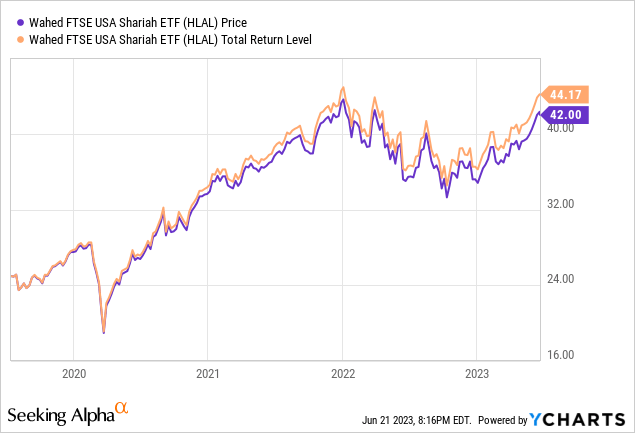
- The Wahed FTSE USA Shariah ETF has outperformed the Vanguard S&P 500 ETF over its four-year history, providing higher returns and a higher Beta.
- HLAL has $260m in AUM and a 50bps fee, while VOO has $315b in AUM and a 3bps fee; HLAL's TTM Yield is 0.95% compared to VOO's 1.5%.
- Both ETFs' results are driven by a fraction of the stocks held, with the top 20 stocks accounting for 63% of HLAL's portfolio and 40% of VOO's.
- Investors enticed by HLAL's high technology weight would do better owning ETFs that focus on those stocks.
- Looking for more investing ideas like this one? Get them exclusively at Hoya Capital Income Builder. Learn More »
Abu Hanifah/iStock via Getty Images
(This article was co-produced with Hoya Capital Real Estate)
Introduction
While there are investors who want at least some of their portfolio reflecting their values, such as ESG funds, ideally such alternatives can be done without loss of the return as compared to those achieved by non-restricted funds. For the followers of Islam, funds that screen based on Shariah law were developed and there is a growing list to consider. Here, I examine how the Wahed FTSE USA Shariah ETF (NASDAQ:HLAL) has done against the Vanguard S&P 500 ETF (NYSEARCA:VOO). Over its almost four years of history, HLAL has provided a higher return, accompanied by a higher Beta but less income for investors.
Vanguard S&P 500 ETF review
Seeking Alpha describes this ETF as:
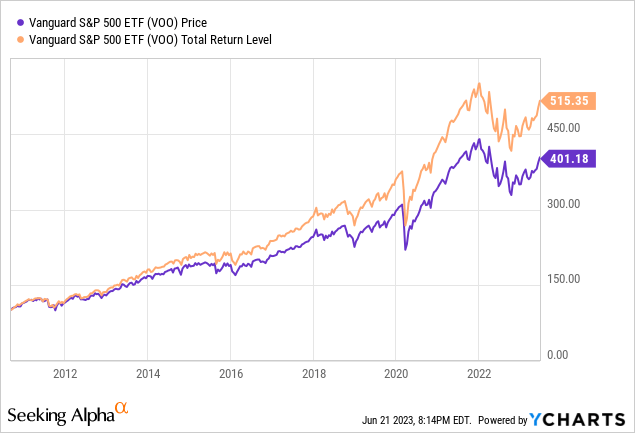
The investment seeks to track the performance of the Standard & Poor's 500 Index that measures the investment return of large-capitalization stocks. VOO started in 2010.
Source: seekingalpha.com VOO
VOO has $315b in AUM and has only 3bps in fees, 6bps less than its leading competitor. The TTM Yield is 1.5%.
Index review
S&P describes their index as:
The S&P 500® is widely regarded as the best single gauge of large-cap U.S. equities. According to our Annual Survey of Assets, an estimated USD 15.6 trillion is indexed or benchmarked to the index, with indexed assets comprising approximately USD 7.1 trillion of this total (as of Dec. 31, 2021). The index includes 500 leading companies and covers approximately 80% of available market capitalization.
Source: spglobal.com S&P 500 Index
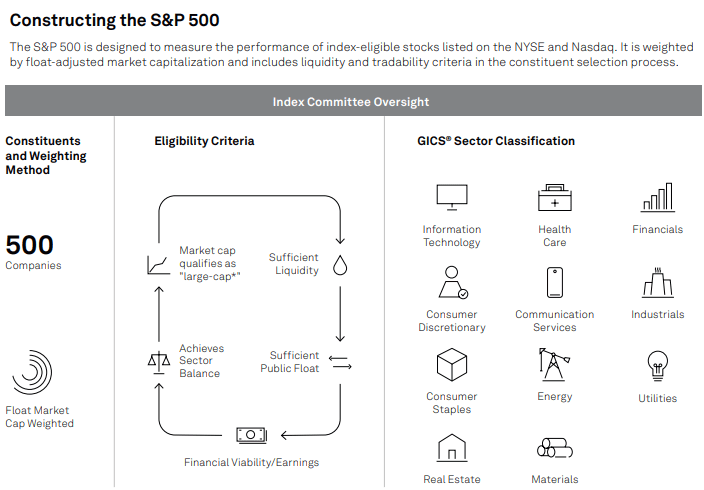
spglobal.com Index
Important characteristics of the current index include the following:
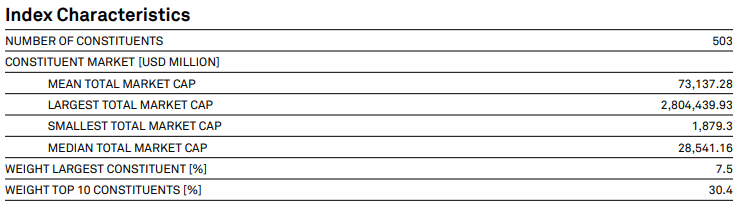
spglobal.com S&P 500 Index
S&P provided the next chart that shows the importance of the stocks included in the index.
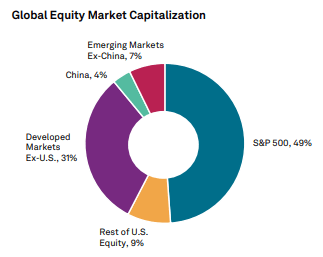
spglobal.com Index
VOO holdings review
The ETF, as expected, holds mostly Large-Cap stocks, with almost no exposure to stocks below Medium in size.
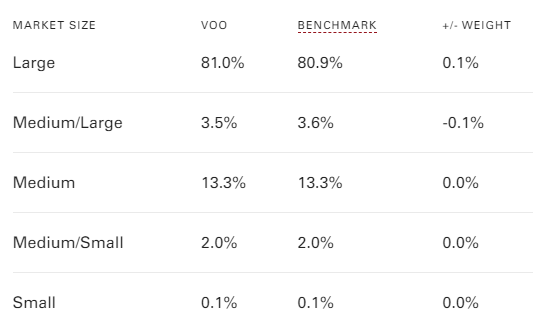
advisors.vanguard.com size
Being S&P 500 based, VOO's top sector is Technology stocks.
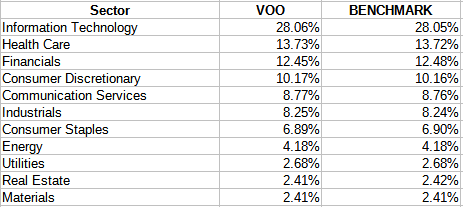
advisors.vanguard.com
About 64% of the allocation is in the Top 4 sectors. The Top 20 stocks account for 40% of the portfolio, the last 250 only 11% of the weight.
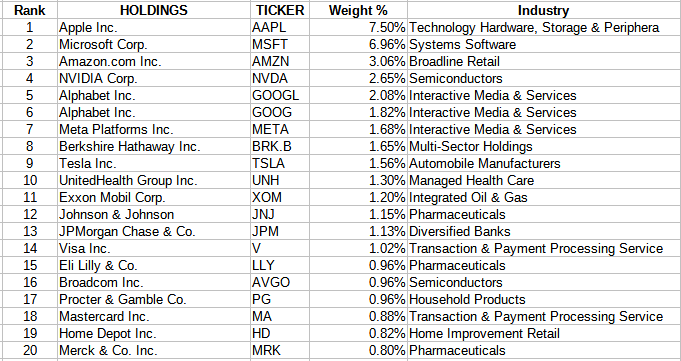
advisors.vanguard.com
VOO distributions review
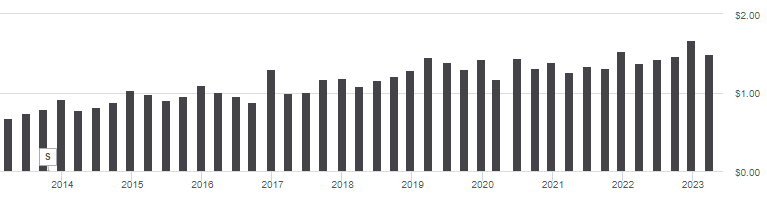
seekingalpha.com VOO DVDs
Over the past decade, dividends are grown at a 7.52% rate, helping VOO earn a "B" grade from Seeking Alpha for this factor.
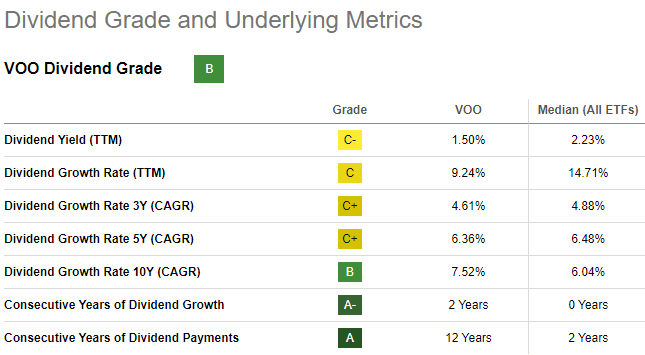
seekingalpha.com VOO scorecard
Wahed FTSE USA Shariah ETF review
Seeking Alpha describes this ET as:
The investment seeks to track the total return performance, before fees and expenses, of the FTSE Shariah USA Index. The index is composed of common stocks of large- and mid-capitalization U.S. companies the characteristics of which meet the requirements of Shariah and are consistent with Islamic principles as interpreted by subject-matter experts. HLAL started in 2019.
Source: seekingalpha.com HLAL
HLAL has $260m in AUM and starts off with a big fee disadvantage to VOO: 50bps. The TTM Yield is .95%.
Index review
FTSE describes how their various Shariah indices are developed:
The FTSE Global Equity Shariah Index Series is based on the FTSE Global Equity Index Series universe. Screening is undertaken by Shariah consultants, Yasaar Limited, against a set of guiding principles. The series has been fully certified as Shariah-compliant through the issue of a Fatwa (Islamic legal opinion) by Yasaar's principals. The screening approach is briefly as follows:
Business Activity Screening
Initially, companies involved in any of the following activities will be filtered out as non-Shariah compliant:
- Conventional finance (non-Islamic banking, finance, and insurance, etc.)
- Alcohol
- Pork related products and non-halal food production, packaging and processing or any other activity related to pork and non-halal food
- Entertainment (casinos, gambling, and pornography)
- Tobacco, weapons, arms, and defence manufacturing.
Financial Ratios Screening
The remaining companies are then screened on a financial basis. The following financial ratios must be met for companies to be considered Shariah-compliant:
- Debt is less than 33.333% of total assets
- Cash and interest bearing items are less than 33.333% of total assets
- Accounts receivable and cash are less than 50% of total assets
- Total interest and non-compliant activities income should not exceed 5% of total revenue.
Source: ftserussell.com
HLAL holdings review
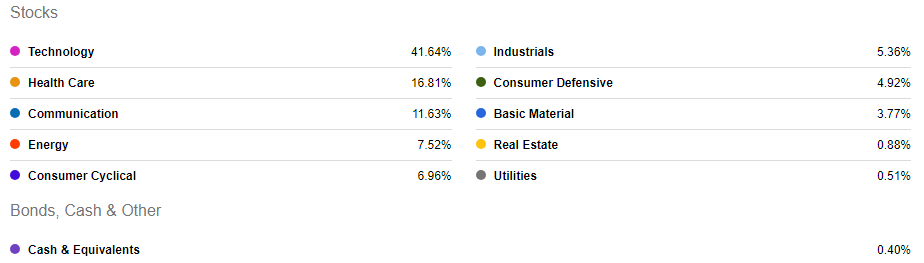
seekingalpha.com HLAL sectors
More on sectors is provided in the ETF comparing section of this article. With only 225 stocks, the Top 20 account for 63% of the portfolio, the lower half here is just 8.5%. For either ETF, the results will be driven by a fraction of the stocks held.
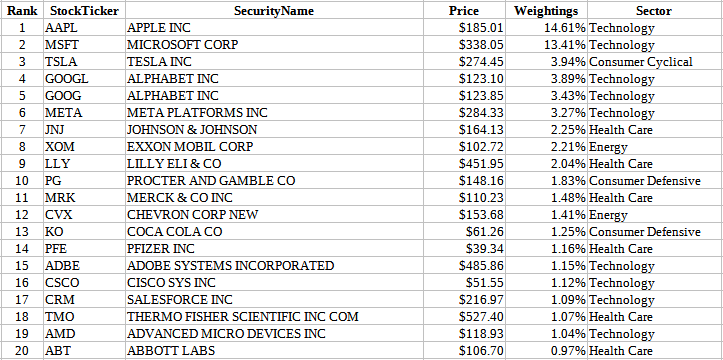
www.wahed.com/hlal
HLAL distributions review
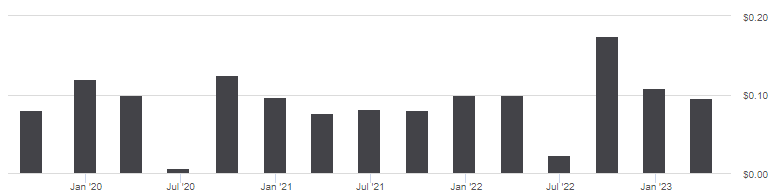
seekingalpha.com HLAL DVDs
HLAL shows more variations than VOO in the quarterly payouts but at under 1%, this isn't an ETF to own for income. HLAL earned a "B-" grade.
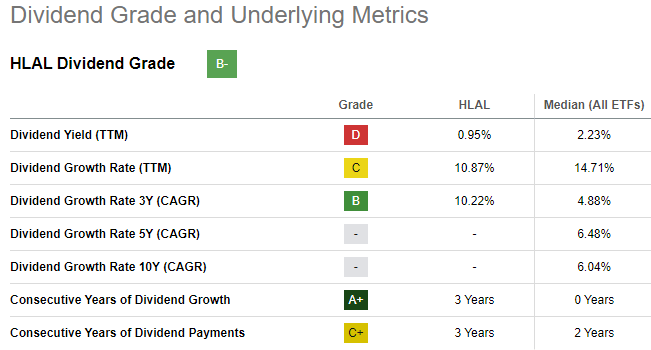
seekingalpha.com HLAL
Comparing ETFs
Using Vanguard's Style boxes, we see that HLAL has less Blended and more Growth allocation than VOO; market size shows little difference.
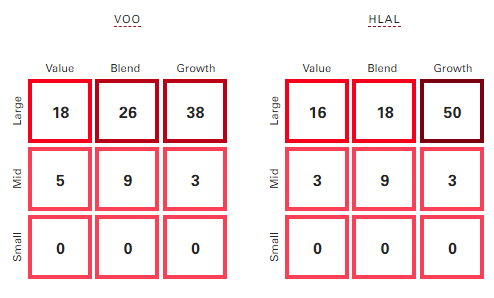
advisors.vanguard.com
Looking at how the ETFs overlap, we see HLAL owns stocks outside of the S&P 500 Index used by VOO, which is not a surprise since their index is provided by FTSE.
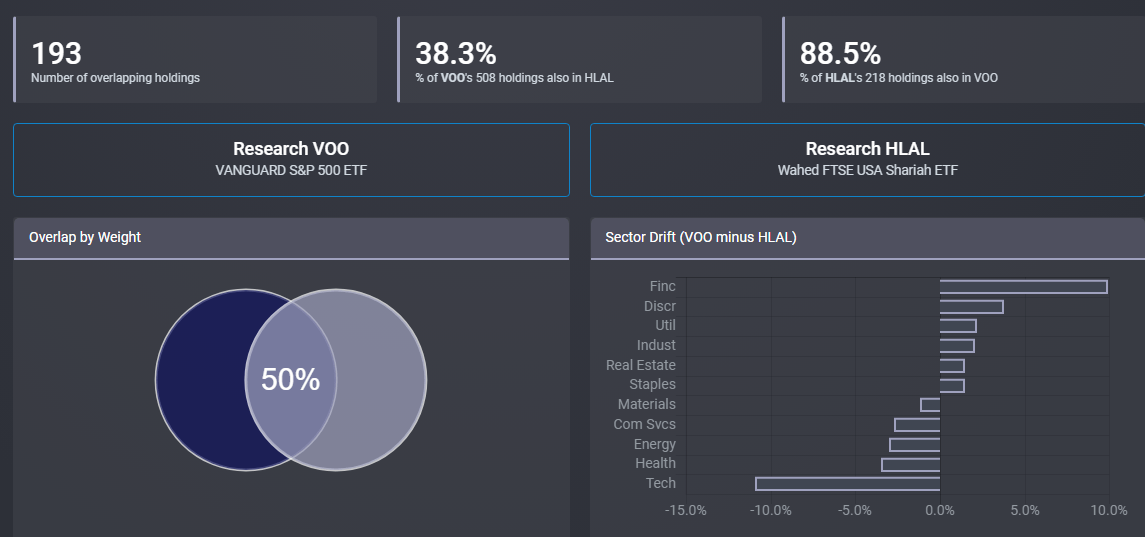
ETFRC.com
The two major sector shifts match what I have seen in other Shariah/non-Shariah comparisons: a shift toward Tech stocks, the total elimination of Financial stocks. Unlike the SP Funds S&P 500 Sharia Industry Exclusions ETF (SPUS), HLAL has some exposure to the Real Estate sector.
Using data from Morningstar, here is how the two ETFs matchup using equity factors.
| Factor | VOO ETF | HLAL ETF |
| Price/Earnings | 18.83 | 20.43 |
| Price/Book | 3.47 | 4.34 |
| Price/Sales | 2.11 | 2.41 |
| Price/Cash Flow | 11.91 | 11.76 |
| LT Earnings Growth | 10.84% | 11.11 |
| Sales Growth | 11.44% | 16.56% |
| Cash Flow Growth | 8.07% | 16.00% |
| Book Value Growth | 4.64% | 9.53% |
Most of the Value metrics favor VOO, while the Growth ones favor HLAL. With the understanding that the above data only reflects the current portfolios, here is what the return and risk results have been since HLAL started in the summer of 2019.
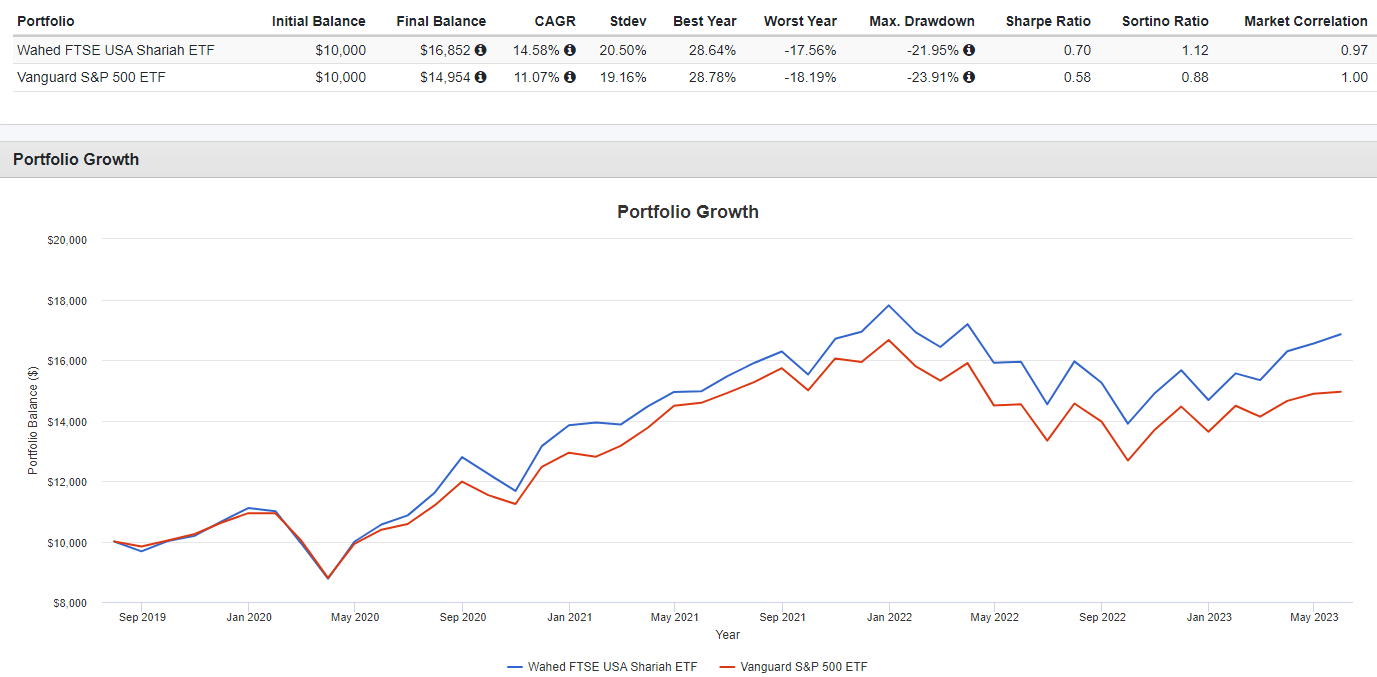
PortfolioVisualizer.com
Even with a slightly higher Beta, the higher CAGR results in superior risk ratios for HLAL compared to VOO. Both SA Analysts and Quant Rankings favor HLAL.
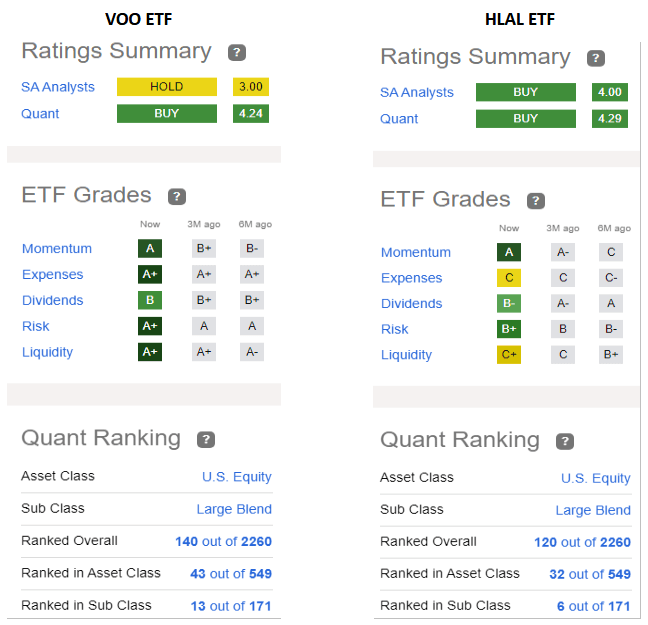
seekingalpha.com Home pages
Portfolio strategy
As shown in my SPUS Vs. SPY: Sharia Screens Benefit Investors article, sometimes an ethical focus on Large-Cap stocks also comes with better results, as we see here too. This does not always happen, even with Sharia ETFs, as my article on reviewing the ETFB Green SRI REITs ETF (RITA) revealed. For those who want/need to screen to align their investing with their faith, that doesn't matter.
For investors drawn to the high Technology sector weighting, comparing HLAL to either the Invesco QQQ ETF (QQQ) or the Technology Select Sector SPDR ETF (XLK) makes more sense than S&P 500 Index ETFs. Here we see both ETFs providing better results than HLAL.
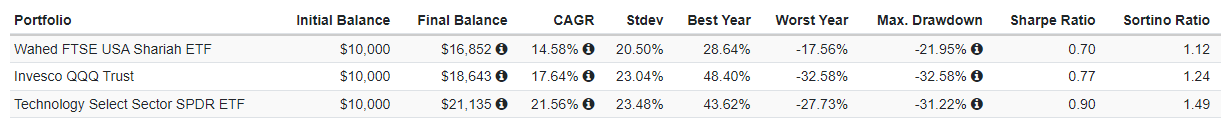
PortfolioVisualizer.com
Final thoughts
Islamic investors are not the only ones with target funds; many ETFs follow various Social Responsible Investing screens based on restrictions other faiths, mainly Christian, managers believe there is a desire for in the market. There are over 200 Socially Responsible ETFs having total AUM of $95.88B currently trading in the US markets.
This article was written by

I have both a BS and MBA in Finance. I have been individual investor since the early 1980s and have a seven-figure portfolio. I was a data analyst for a pension manager for thirty years until I retired July of 2019. My initial articles related to my experience in prepping for and being in retirement. Now I will comment on our holdings in our various accounts. Most holdings are in CEFs, ETFs, some BDCs and a few REITs. I write Put options for income generation. Contributing author for Hoya Capital Income Builder.
Analyst’s Disclosure: I/we have no stock, option or similar derivative position in any of the companies mentioned, and no plans to initiate any such positions within the next 72 hours. I wrote this article myself, and it expresses my own opinions. I am not receiving compensation for it (other than from Seeking Alpha). I have no business relationship with any company whose stock is mentioned in this article.
Seeking Alpha's Disclosure: Past performance is no guarantee of future results. No recommendation or advice is being given as to whether any investment is suitable for a particular investor. Any views or opinions expressed above may not reflect those of Seeking Alpha as a whole. Seeking Alpha is not a licensed securities dealer, broker or US investment adviser or investment bank. Our analysts are third party authors that include both professional investors and individual investors who may not be licensed or certified by any institute or regulatory body.