The Magnificent 7 As A Group Are Approaching Price Exhaustion

Summary
- The Magnificent 7 (MAG 7) index, created by Jim Cramer, comprises seven of the largest technology-centered growth stocks active in AI: Nvidia, Facebook, Tesla, Amazon, Google, Microsoft, and Apple.
- After a 92% gain since December, we believe the MAG 7 index is approaching price exhaustion, with evidence suggesting a correction will start soon.
- The current index is 4.5% below the all-time high made in December 2021. The index is unlikely to make new highs before a correction begins.
- Investors should consider lightening their positions in stages if the index reaches its previous peak, selling in increments to account for the fan formation top that typically characterizes major price tops.
Christopher Polk/Getty Images Entertainment
The PE ratio of the Magnificent 7 is nearing all-time highs
Jim Cramer has created a new price index composed of seven of the largest technology centered growth stocks that are also active in AI. It's called the Magnificent 7. In this article we shorten the name to MAG 7. These are the seven stocks:
- Nvidia (NVDA)
- Meta Platforms (META)
- Tesla (TSLA)
- Amazon (AMZN)
- Google (GOOG), (GOOGL)
- Microsoft (MSFT)
- Apple (AAPL)
The MAG 7 is really just the new FAANG with seven stocks instead of five. It deletes Netflix and adds Microsoft, Nvidia and Tesla - then gives it a new name.
CNBC presents updates of an equal weighted price index of these seven stocks and we've graphed it below along with its historic PE ratio. The current PE ratio of the MAG 7 is 45.7, which is 16% below its highest ratio of 54.0 set back in 2020. The all-time low is 20. This shows that current valuations are near their historic highs.
The Magnificent Seven price chart and PE ratio (Sentiment King)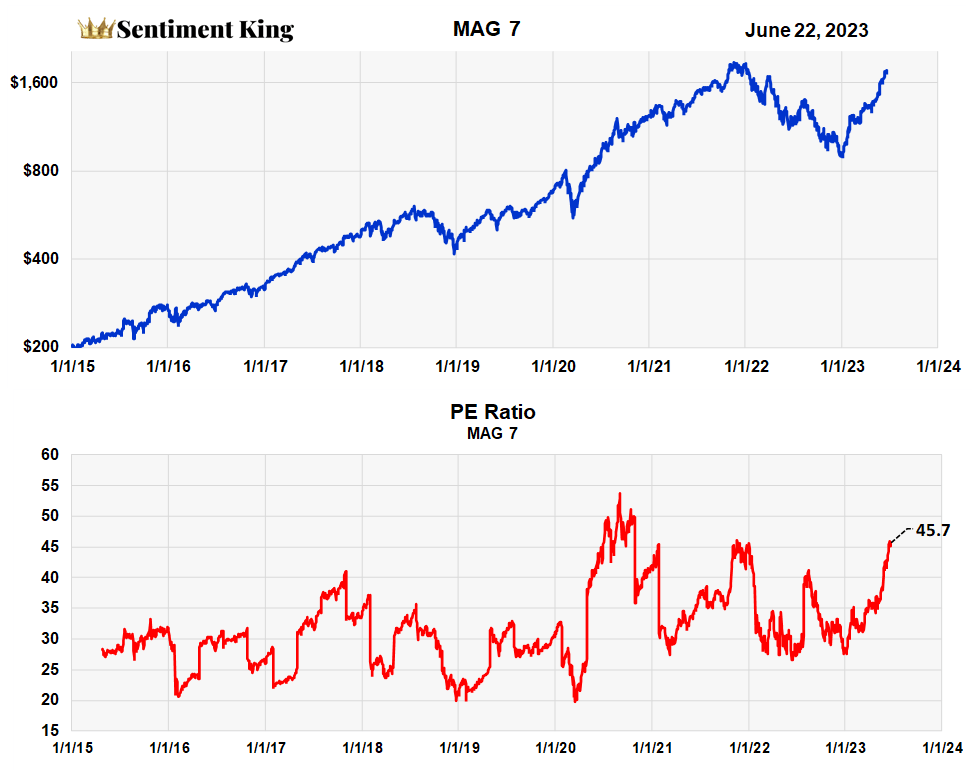
While the MAG 7 are seven distinct stocks that should be analyzed individually, in this article we treat them like analysts do the Dow 30 and analyze them as a group. For individual analysis of each stock, there are an ample number of articles at SA for that purpose.
These seven stocks have a huge weighting in the major indices. The MAG 7 represent 25% of the weighting of the S&P 500 and 51% of the weighting of the NASDAQ 100. They also account for the lion's share of the current high PE ratios of both major indices.
The PE ratio of NASDAQ 100 is currently 30. These seven stocks have a PE ratio of 45 and since they account for 51% of the index, the 93 other stocks probably have a combined ratio closer to 23 or 24.
The same is true of the S&P 500. The current PE ratio of the S&P 500 is 22.2. If you take out the seven, the remaining 493 stocks have a ratio around 19 or 20. This is easily seen since the equal weighted S&P 500 has a current PE ratio of 18.5.
The Magnificent 7 index is reaching price exhaustion
We believe there is evidence that the combined price action of the magnificent seven is reaching exhaustion, which can be seen in the chart below. It graphs the magnificent 7 price index against the magnificent 7 relative strength index, called the RSI.
It also compares the current price of $1,760 against the peak price of $1,840 made a year and a half ago (dash line). The current price is only 4.5% below the peak.
The Magnificent Seven and its RSI (Sentiment King)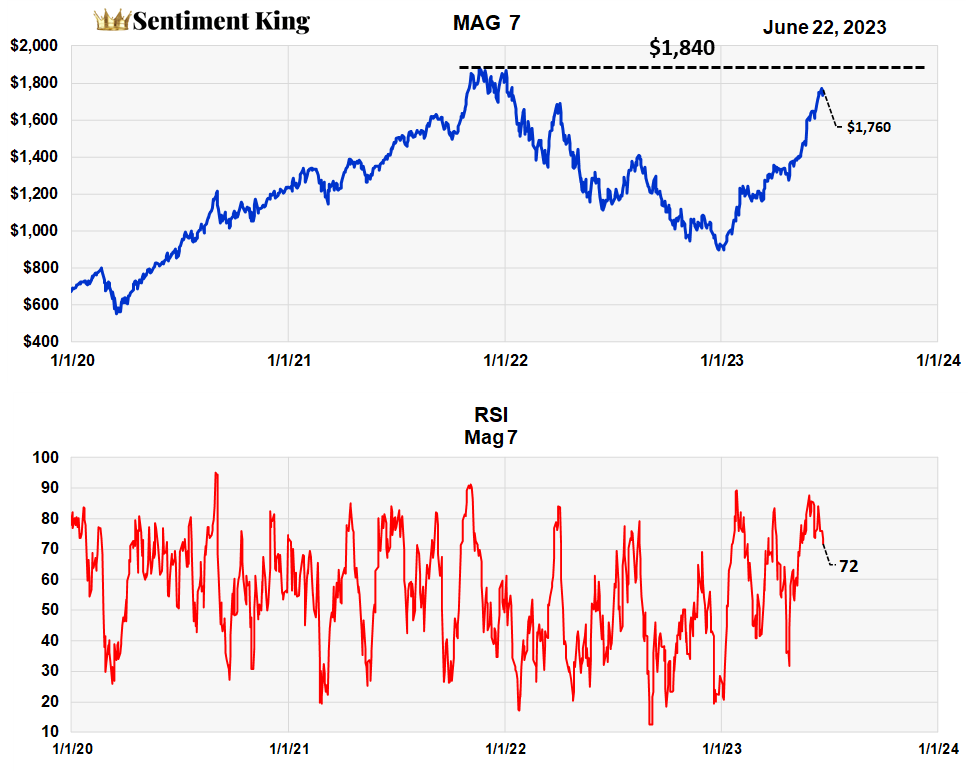
Since the beginning of this year, the MAG 7 index has advanced from $914 to $1,760. This is a gain of 92.5% in just over 5.5 months. During this advance it experienced minimal price corrections.
During this period relative strength surged above 80 on the RSI scale three times, with two of the surges almost reaching 90. This shows the advance taking place in three distinct waves. It is normal after that to expect a correction.
We believe these charts suggest it's time these seven stocks took a combined rest and experienced some type of correction. If prices do continue higher, we can't see the index advancing more than 4.5% to the previous highs before a correction takes place.
Option Buying of the Magnificent 7 stocks
We believe analyzing option data provides insight into what investors are thinking. We smooth the option data over 20 days to take away short term noise and to measure intermediate term sentiment trends.
The graph below is the "puts to calls" ratio of total premiums of the seven stocks that make up the MAG 7. When combing the activity of multiple stocks, it's best to use option "dollars" then option "numbers" in the ratio. As you can see, maximum "put to call" buying occurred at the very bottom of the index at the start of the year.
The ratio has now dropped below 1.0. It's rapidly approaching .5, which historically has indicated excess optimism.
"Puts to Calls" ratio of the magnificent seven (Sentiment King)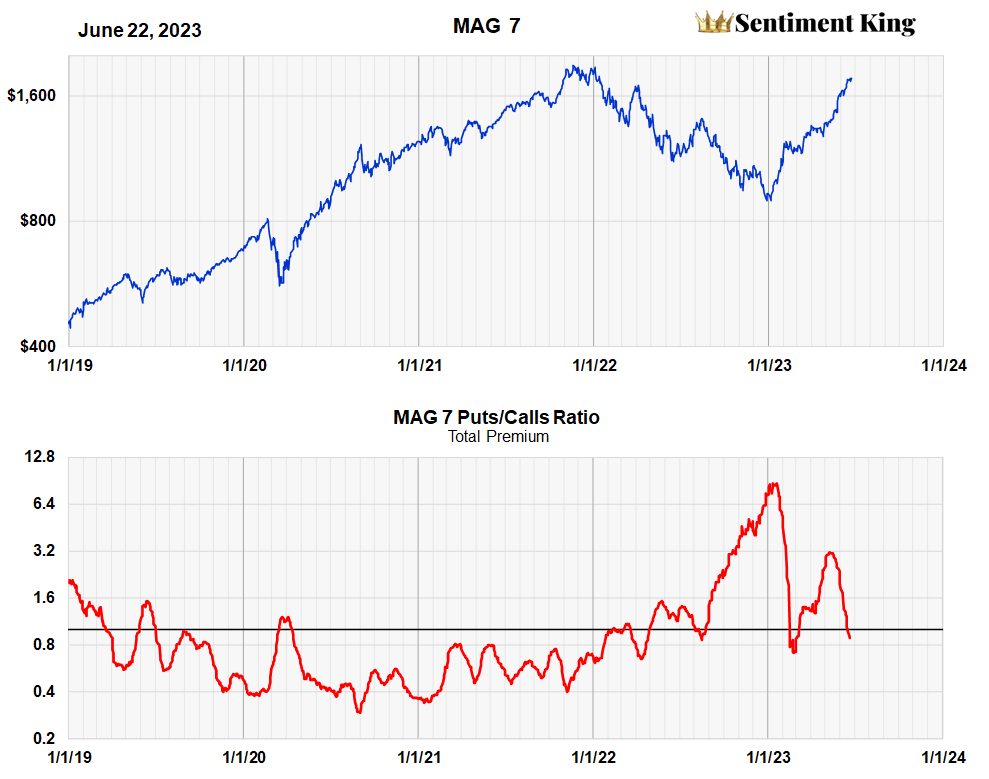
This next chart shows the ratios of the number of "put" trades to "call" trades. Instead of comparing dollars it compares the number of people interested in "puts" versus "calls" and so provides another window into the minds of investors in these seven stocks. We tend to like it better than the premium ratio since it's "more regular" and less volatile.
Ratio of "Puts to Call" Trades of the Magnificent Seven (Sentiment King)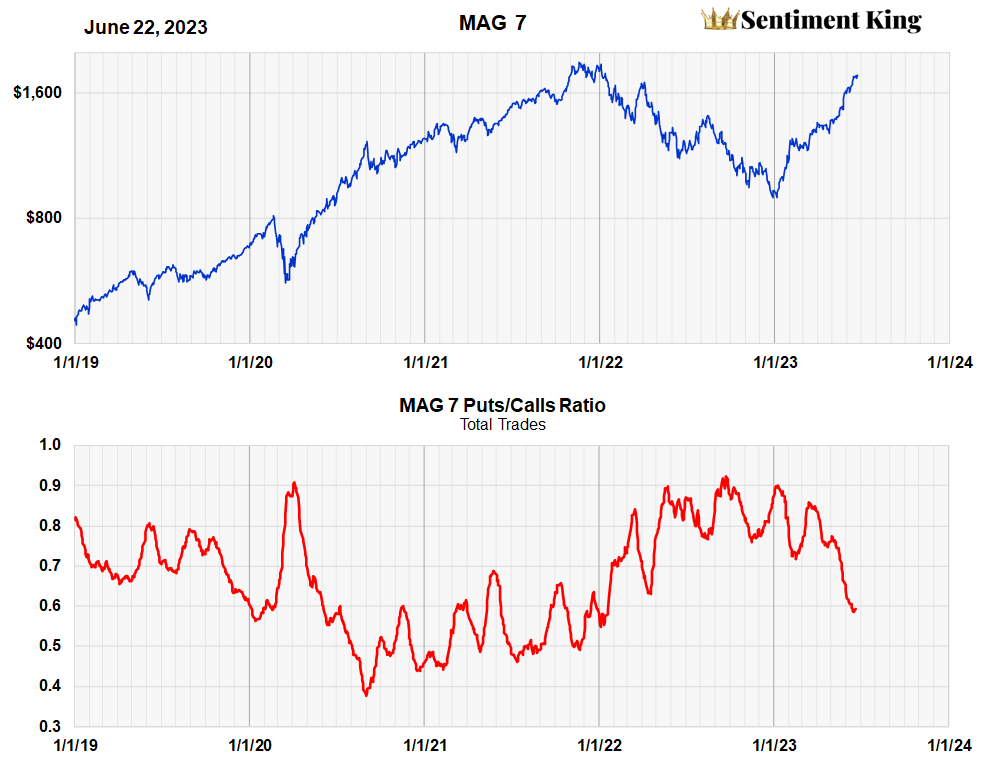
It shows the relative higher number of put buyers that occurred in these stocks from June of last year until February of this year. This highlights the overall bearish attitude that investors had for these key stocks during that period.
The ratio is currently just under .6. History shows that one should get worried about a top in these growth stocks when the ratio gets just below .5. We could get there in the next month or two.
Magnificent 7 VIX
To be complete we've included in the chart below the implied VIX for the MAG 7 for those readers who like to follow volatility. We find it better than the VXN or VIX since it seems to be a little smoother and less jittery than the major volatility measures.
The chart shows that the implied volatility of the MAG 7 is coming down from highs of .5 and is reaching levels under .3, a level that has occurred at previous peaks in the Index.
Magnificent Seven Implied Volatility VIX (Sentiment King)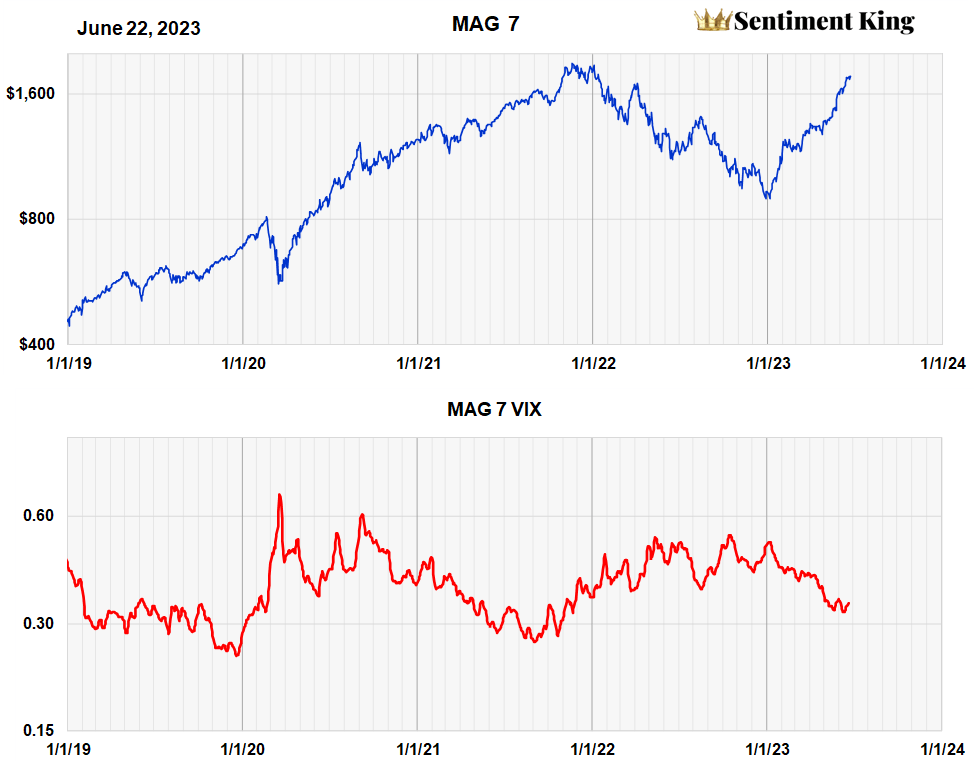
No Sudden reversal - expect a distribution top (fan pattern)
Major price tops are different than major lows; they look different in price charts. Turn a price chart upside down and you can usually tell it's upside down.
Major bear market lows usually occur on one day, sometimes two days. If over two days, the two days are usually not more than three months apart.
Major price tops, however, are usually spread out over time and make fan formations often termed "distribution tops." A major tops usually takes from three months to one year to complete. Different groups will top at different times over the topping cycle. This is what forms the multi-top fan formation in the major indices.
Because of these different time characteristics of major tops and bottoms, buying and selling should be different. Selling should be done in three or four stages; buying should occur in one or two steps. This allows for the inherent difficulties of timing markets and for timing errors.
We thing investors in the MAG 7 stocks should consider lightening their positions in stages if the Index reaches its previous peak. Maybe sell 25% and wait. Have confidence that if the index does sell off 5% or 10%, it will most likely rally again to the previous high. If it does wait this time to see if it punches through. If it does punch through wait and sell another 25% on a move to new highs. If it sells off, sell another 25% on the sell off.
This method of expecting a fan formation top will allow you to participate in a possible "blow off" ending which might occur with these stocks under current conditions.
Summary
We believe these factors are pointing to the end of the massive, six month, 92% rally of the Magnificent 7 and the beginning of the first meaningful correction for the composite of seven stocks.
1) A near record PE ratio of 45.7 for the MAG 7 showing valuations near historic highs.
2) The current price index is only 4.5% below the all-time high made 18 months ago.
3) The three surges of the MAG 7 RSI index to over 80 since the start of the year.
4) Two "puts to calls" ratios of the MAG 7 are approaching levels that occurred near previous tops.
This article was written by

Analyst’s Disclosure: I/we have no stock, option or similar derivative position in any of the companies mentioned, and no plans to initiate any such positions within the next 72 hours. I wrote this article myself, and it expresses my own opinions. I am not receiving compensation for it (other than from Seeking Alpha). I have no business relationship with any company whose stock is mentioned in this article.
Seeking Alpha's Disclosure: Past performance is no guarantee of future results. No recommendation or advice is being given as to whether any investment is suitable for a particular investor. Any views or opinions expressed above may not reflect those of Seeking Alpha as a whole. Seeking Alpha is not a licensed securities dealer, broker or US investment adviser or investment bank. Our analysts are third party authors that include both professional investors and individual investors who may not be licensed or certified by any institute or regulatory body.