Picking A Winner In Apartment REITs

Summary
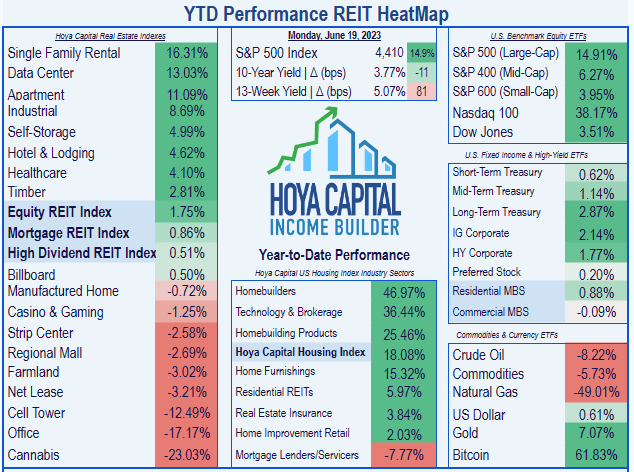
- Apartment REITs have been the third-best performing REIT sector this year, outperforming the S&P 400 and 600 indexes and the Dow.
- Apartment supply concerns lie at the root of market pessimism, but job growth in markets with the largest supply growth is even stronger, indicating demand may outstrip supply.
- This article examines liquidity, revenue growth, size, volatility, dividend yield, dividend growth, and pricing considerations for 16 Apartment REITs, to single out one company.
- Looking for a portfolio of ideas like this one? Members of Hoya Capital Income Builder get exclusive access to our subscriber-only portfolios. Learn More »

FG Trade Latin/E+ via Getty Images
Apartment REITs as a whole have been the third-best performing REIT sector this year, outperforming the S&P 400 and 600 indexes, as well as the Dow.
Hoya Capital Income Builder
Hoya Capital's most recent sector report on Apartment REITs reads in part:
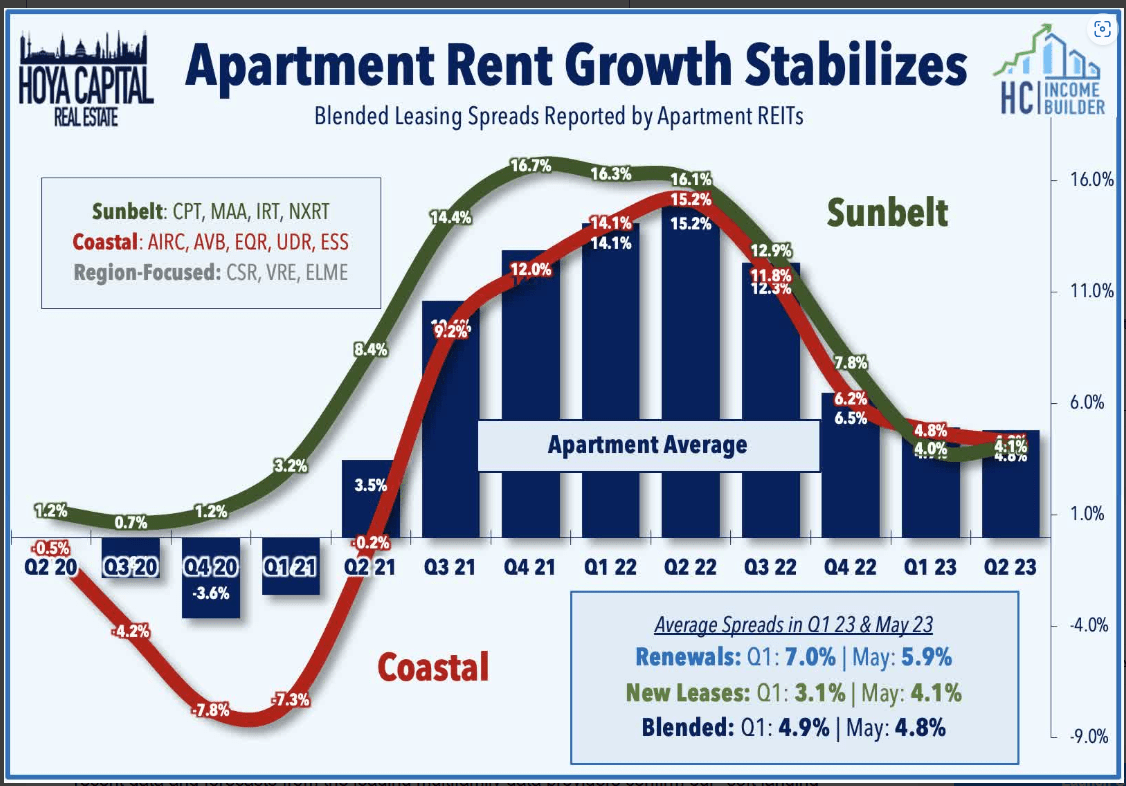
Supply concerns remain the root of ... market pessimism as soaring rents sparked a wave of new development that will come to market over the next 18 months, but elongated development timelines make some often-cited pipeline metrics showing historic levels of under-construction units look more menacing than reality. . .
While rent growth on new leases has cooled to around 3.5% thus far in 2023, renewal spreads remained firm at above 6%. Buoyed by these firm renewal spreads, Apartment REITs expect average same-store NOI growth of nearly 7% and FFO growth of roughly 4% in 2023 - among the highest in the REIT sector.
Hoya Capital Income Builder
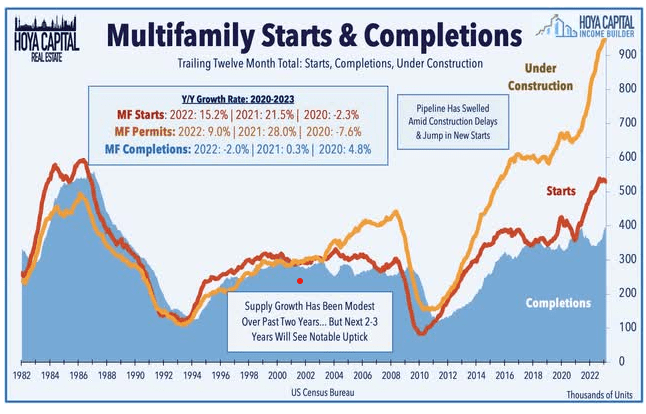
Soaring rents coming out of the pandemic sparked a wave of new development that will come to market over the next 18 months, but that new supply was offset almost completely by a matching decline in single-family supply. Thanks to longer completion timeframes created by labor and material shortages, this increased supply will likely have a more muted effect on rents.
Hoya Capital Income Builder
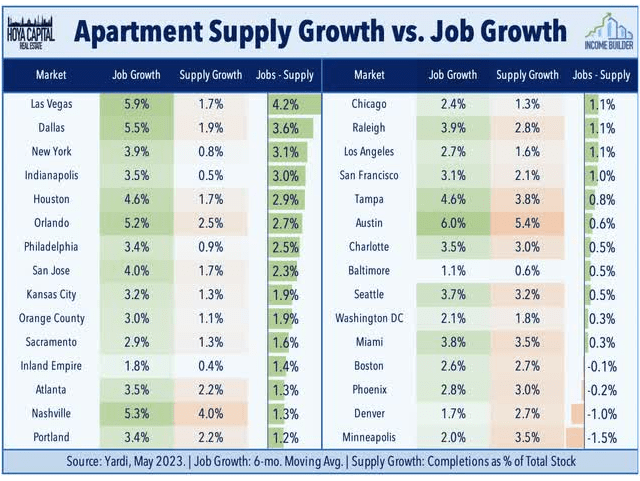
Looking more closely at the markets in which supply growth is largest, we see that for the most part, job growth in those markets is even stronger. Since job growth is the best predictor of apartment demand, it would appear that supply is being outstripped by demand.
Hoya Capital Income Builder
Meanwhile, Freddie Mac estimates that the U.S. housing market is still more than 3 million housing units short of what's needed to meet the country's demand.
For investors interested in increasing their exposure to the Apartment REIT sector, this article examines liquidity, revenue growth, size, volatility, dividend yield, dividend growth, and pricing considerations for 16 Apartment REITs, to single out the one company best poised to deliver outperformance over the next 2 to 5 years.
What the numbers say
My FROG-hunting approach to REIT investing relies on just 7 numbers:
- Liquidity ratio (Assets/Liabilities)
- Growth in Funds From Operations (FFO)
- Growth in Total Cash From Operations (TCFO)
- Growth in Dividends
- Market Cap
- Growth in share price
- Volatility
Hey, what is a FROG anyway?
FROG stands for Fast Rate of Growth. FROG REITs are significant, because they usually outperform the market in total return (Gain + Yield). The criteria for identifying a FROG are as follows:
- Positive price gain over the past 3 years
- Liquidity Ratio >= 1.66 (preferably >=2.00)
- FFO and TCFO Growth rate >= 10% (preferably >=20%)
- Market cap of at least $1.4 billion.
- Modeled Return greater than the return posted by the Vanguard Real Estate ETF (VNQ) over the past 3 years.
Modeled Return is my own Rube Goldberg invention that combines price gain, dividend yield, dividend growth rate, and volatility to arrive at one number, for comparison to VNQ.
The opposite of a FROG is a COW (Cash Only Wanted), which is a company notable for its prodigious stream of cash dividends and plodding or mediocre revenue growth.
How do the candidates stack up?
There are 16Apartment REITs on my radar. The candidates are as follows:
- AvalonBay Communities (AVB)
- Equity Residential (EQR)
- Mid-America Apartment Communities (MAA)
- Essex Property Trust (ESS)
- UDR, Inc. (UDR)
- Camden Property Trust (CPT)
- Apartment Income REIT Corp. (AIRC)
- Independence Realty Trust (IRT)
- Veris Residential (VRE)
- Elme Communities (ELME)
- NexPoint Residential Trust (NXRT)
- Apartment Investment and Management (AIV)
- Centerspace (CSR)
- BSR Real Estate Investment Trust (OTCPK:BSRTF)
- BRT Apartments (BRT)
- Clipper Realty (CLPR)
First, we screen on Liquidity, FFO growth rate per share, TCFO growth rate, and Market Cap, using the criteria above.
| Ticker | Liq. Ratio | FFO Growth | TCFO Growth | Mkt Cap |
| AVB | 2.24 | 4.0 | 2.46 | 27.3 |
| EQR | 2.24 | 2.5 | (-0.1) | 25.3 |
| MAA | 2.20 | 13.3 | 10.65 | 18.1 |
| ESS | 1.84 | 3.7 | 2.03 | 15.2 |
| UDR | 1.56 | 6.6 | 9.13 | 14.3 |
| CPT | 2.13 | 12.1 | 10.25 | 12.1 |
| AIRC | 1.46 | 7.0 | 21.97 | 5.5 |
| IRT | 2.22 | 16.9 | 49.29 | 4.2 |
| VRE | 1.47 | -- | (-24.86) | 1.6 |
| ELME | 3.05 | -- | (-17.71) | 1.4 |
| NXRT | 1.29 | 19.3 | 15.71 | 1.2 |
| AIV | 1.32 | 5.0 | (-18.29) | 1.2 |
| CSR | 1.65 | 5.2 | 9.54 | 0.9 |
| BSRTF | 1.87 | 19.5 | 16.45 | 0.5 |
| BRT | 1.51 | 20.3 | 18.56 | 0.4 |
| CLPR | 1.01 | 40.5 | (-5.90) | 0.1 |
Source: TD Ameritrade and Hoya Capital Income Builder
* denotes total FFO, not per share
(In all tables in this article, growth rates are 3-year CAGR, unless otherwise specified).
First, we check for companies with Liquidity Ratio less than 1.66. This eliminates UDR, AIRC, VRE, NXRT, AIV, CSR, BRT, and CLPR. This does not mean those companies are not good investments. In fact, some of them have performed extremely well in the past, despite Liquidity Ratios well below our cut-off. However, we are looking for the creme de la creme, the one company most likely to outperform in the next 2 to 5 years.
Next, we check for FFO growth or TCFO growth less than 10.0%. That eliminates classic COWs like AVB, EQR, and ESS, along with the alarmingly faltering VRE, ELME, AIV, and CLPR. We are left with just 4 remaining candidates: IRT, CPT, MAA, and BSRTF.
Next, we eliminate any company with a market cap under $1.4B. Definitive research by Hoya Capital has established that small-cap REITs are swimming upstream, until they reach $1.4B in market cap. These companies can be good investments with small allocations, but again, we are looking for the best of the best. That eliminates BSRTF, which qualifies on every other FROG criterion so far. I call this type of company a Tadpole. BSRTF has a significant amount of growing to do, before it can be considered a FROG.
Hoya Capital's research also indicates there is a market cap sweet spot. Companies with market cap between $4B-$10B tend to outperform both smaller REITs and larger REITs. That puts IRT clearly in first place. It is better to be above the sweet spot than below, so our second-tier candidates will be CPT and MAA, in that order.
Round 2: Modeled Return
We are already down to just three contenders. The last FROG criterion is Modeled Return. Here are the ingredients and the result:
| Ticker | Price Gain | Div. Yield | Div. Growth | Div. Score | Volatility | Modeled Return |
| IRT | 16.3 | 3.80% | 10.1% | 5.07 | 31.9 | 19.99 |
| CPT | 5.3 | 3.54% | 6.4% | 4.26 | 25.3 | 9.61 |
| MAA | 13.2 | 3.61% | 11.6% | 5.02 | 25.7 | 18.19 |
| VNQ | 0.46 | 4.07% | 17.0% | 6.52 | -- | 6.98 |
Source: Hoya Capital Income Builder, MarketWatch.com, and author calculations
Note: Modeled Return is not an attempt to predict total return for the coming year, but rather a measuring stick to identify companies that will outperform. The wider the margin by which a company's Modeled Return exceeds that of the VNQ, the better its chances of outperforming in the coming year.
With the best Modeled Return of our 3 candidates, IRT widens its lead, and MAA moves into a comfortable second place, ahead of CPT.
On to the finals: Future Growth
So far, our growth metrics have been backward-looking. Now we sort our candidates by projected FFO growth for 2023 and 2024. These analyst consensus figures (a.k.a. educated guesses) are based mostly on company guidance. Since next year's FFO is much easier to predict than two years down the road, I give double the weight to expected growth rate for 2023 versus the projected rate for 2024.
| Ticker | FFO '22 | FFO '23* | % incr | FFO '24* | % incr | Incr score |
IRT | $1.08 | $1.15 | 6.5 | $1.22 | 6.1 | 6.37 |
| MAA | $8.50 | $9.17 | 7.9 | $9.39 | 2.4 | 6.07 |
| CPT | $6.59 | $6.88 | 4.4 | $7.17 | 4.2 | 4.33 |
Source: Hoya Capital Income Builder
* analyst consensus guesstimate
IRT ranks first in this respect also, widening its lead slightly at the finish line.
May I have the envelope, please?
By now, it's a foregone conclusion. From a FROG-hunter's perspective, with the strongest growth rates, both past and future, among the Apartment REITs with the strongest balance sheets, and with the highest Modeled Return, sitting right in the market cap sweet spot, the company most likely to outperform over the next 2 - 5 years is . . .

Independence Realty Trust
As always, however, the opinion that matters most is yours.
Whether your focus is High Yield or Dividend Growth, we’ve got you covered with actionable investment research focusing on real income-producing asset classes that offer potential diversification, monthly income, capital appreciation, and inflation hedging. Start A Free 2-Week Trial Today!

This article was written by

Analyst’s Disclosure: I/we have a beneficial long position in the shares of CPT either through stock ownership, options, or other derivatives. I wrote this article myself, and it expresses my own opinions. I am not receiving compensation for it (other than from Seeking Alpha). I have no business relationship with any company whose stock is mentioned in this article.
A Buy, Sell, or Hold rating in this article does not constitute a Buy, Sell, or Hold recommendation. All investors should exercise their own due diligence, before investing in any stock.
Seeking Alpha's Disclosure: Past performance is no guarantee of future results. No recommendation or advice is being given as to whether any investment is suitable for a particular investor. Any views or opinions expressed above may not reflect those of Seeking Alpha as a whole. Seeking Alpha is not a licensed securities dealer, broker or US investment adviser or investment bank. Our analysts are third party authors that include both professional investors and individual investors who may not be licensed or certified by any institute or regulatory body.
