Banc of California: Reducing The Earnings Estimate Due To The Top Line

Summary
- I’ve reduced my earnings estimate as I’ve slashed both my loan balance and margin estimates following the first quarter’s poor performance.
- The risk level appears moderate because of BANC’s location. The uninsured deposits are well covered, and the unrealized losses are low.
- I’m maintaining a hold rating as the price upside is low, and the dividend yield is moderate.
David McNew
Earnings of Banc of California, Inc. (NYSE:BANC) will most probably decline this year due to a lower average loan balance following several quarters of a downtrend. I’m expecting the company to report earnings of $1.41 per share for 2023, down 26% year-over-year. Compared to my last report on the company, I’ve reduced my earnings estimate as I’ve decreased both my loan balance and margin estimates. The year-end target price suggests a small upside from the current market price. Therefore, I’m maintaining a hold rating on Banc of California.
Declining Loan Trend Likely to Reverse Soon
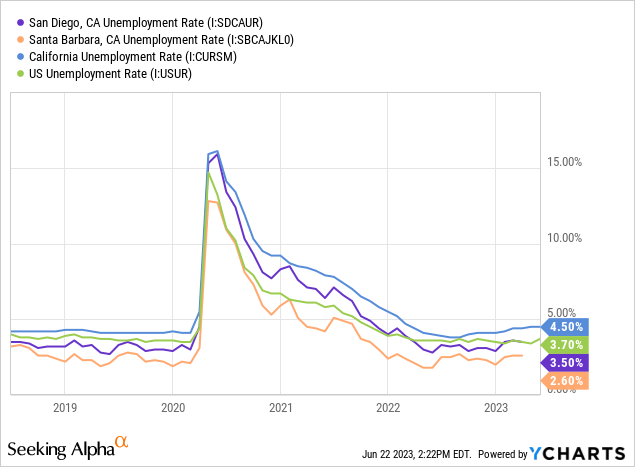
During the first quarter of 2023, Banc of California’s loan portfolio declined for a fourth straight quarter. Fortunately, the rate of decline decreased, which gives me hope that the trend will bottom out soon. Further, the strength of local economies will support a trend reversal. Banc of California operates throughout California with a concentration in the southern part of the state from San Diego to Santa Barbara. As shown below, despite a recent uptrend, the unemployment rates in Banc of California’s local markets are still very low.
The management mentioned in the conference call that “ultimately we expect to be a net beneficiary of the current turmoil in the banking industry, both in terms of adding new clients and banking talent as well.” This is hard to believe considering the deposit book declined by a substantial 2.4% (9.5% annualized) during the first quarter of the year. Banc of California does not seem to have been much successful in capturing the depositors fleeing from other banks in the state. To recall, two banks operating in California, SVB Financial (OTCPK:SIVBQ) and First Republic Bank (OTCPK:FRCB) suffered from deposit runs in March.
Further, the rising interest-rate environment is bound to curb credit demand. I’m expecting the Fed funds rate to increase by 50 basis points in the second half of 2023.
Overall, I’m expecting the loan portfolio to increase by 0.5% in each of the last three quarters of 2023, leading to full-year loan growth of 0.7%. In my last report, I estimated loan growth of 4% for this year. I’ve reduced my estimate because the first quarter’s performance missed my expectation. Further, the regional unemployment rate has risen by more than I previously anticipated. The following table shows my balance sheet estimates.
| Financial Position | FY18 | FY19 | FY20 | FY21 | FY22 | FY23E |
| Net Loans | 7,639 | 5,894 | 5,817 | 7,159 | 7,029 | 7,075 |
| Growth of Net Loans | 15.6% | (22.8)% | (1.3)% | 23.1% | (1.8)% | 0.7% |
| Other Earning Assets | 2,370 | 1,280 | 1,415 | 1,502 | 1,378 | 2,295 |
| Deposits | 7,917 | 5,427 | 6,086 | 7,439 | 7,121 | 7,057 |
| Borrowings and Sub-Debt | 1,696 | 1,398 | 822 | 820 | 1,002 | 2,038 |
| Common equity | 714 | 717 | 712 | 970 | 960 | 1,004 |
| Book Value Per Share ($) | 14.2 | 14.3 | 14.3 | 16.0 | 16.1 | 17.1 |
| Tangible BVPS ($) | 13.3 | 13.5 | 13.5 | 14.3 | 14.0 | 15.0 |
| Source: SEC Filings, Author's Estimates (In USD million unless otherwise specified) | ||||||
Margin Likely to be Rangebound in the Year Ahead
Banc of California significantly increased its cash and cash equivalents during the first quarter, from $181 million at the end of December 2022 to $974 million at the end of March 2023. While on the one hand, this measure will buffer against the risks from the bank runs in BANC’s markets, on the other hand, it will lead to cash drag. As a result, this risk-reducing step will pressurize the margin in the near term.
Meanwhile, rising interest rates will have a small positive effect on the margin. Around 54% of loans are variable or hybrid, as mentioned in the earnings presentation. However, due to the large balance of securities, total rate-sensitive assets are just 37% of total assets. Further, the large balance of interest-bearing transaction deposits will muffle the impact of rate hikes on the margin.
Fortunately, loan additions will help the margin as Banc of California has been originating new loans at much higher rates than the average rates on the total loan portfolio.
1Q 2023 Earnings Presentation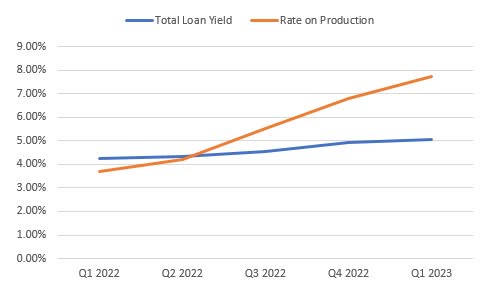
The results of the management’s rate-sensitivity analysis given in the 10-Q filing show that a 200-basis points hike in rates could increase the net interest income by just 0.5% over twelve months.
1Q 2023 10-Q Filing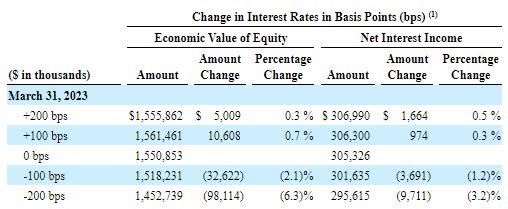
Considering these factors, I'm expecting the margin to barely change in the last three quarters of 2023. Compared to my last report on the company, I’ve reduced my margin estimate for this year partly because the margin declined by more than I’d expected in the first quarter. Further, my outlook isn’t as positive as before.
Reducing my Earnings Estimate
As I’ve decided to reduce both my margin and loan balance estimates, I’ve decreased my earnings estimate for 2023. I’m now expecting Banc of California to report earnings of $1.41 per share for 2023, compared to my previous estimate of $1.70 per share.
Compared to last year, earnings of the company will likely be lower this year because of the loan portfolio’s declining trend in the recent past, which will result in a lower average loan balance for this year. Further, I’m expecting the provisioning for loan losses to return to a normal level this year after excessive provision reversals last year. The following table shows my income statement estimates.
| Income Statement | FY18 | FY19 | FY20 | FY21 | FY22 | FY23E |
| Net interest income | 286 | 248 | 225 | 254 | 314 | 304 |
| Provision for loan losses | 30 | 36 | 30 | 7 | (32) | 13 |
| Non-interest income | 24 | 12 | 19 | 19 | 17 | 32 |
| Non-interest expense | 233 | 196 | 199 | 183 | 194 | 208 |
| Net income - Class A | 23 | 3 | (1) | 50 | 115 | 83 |
| EPS - Diluted -Class A ($) | 0.45 | 0.05 | -0.02 | 0.95 | 1.89 | 1.41 |
| Source: SEC Filings, Earnings Releases, Author's Estimates (In USD million unless otherwise specified) | ||||||
Risk Level Appears Moderate
In my opinion, the biggest source of risk for Banc of California is its location. The two recent deposit runs on banks took place in California, namely SVB Financial and First Republic Bank.
Apart from the location, the risk level is low.
Uninsured and uncollateralized deposits were 27% of total deposits at the end of March 2023. Although the proportion of uninsured/uncollateralized deposits in total deposits is high, I’m not worried because these deposits are well covered. Banc of California had total available liquidity of $4.0 billion, including $1.0 billion of cash, as mentioned in the earnings presentation. This liquidity was 2.2 times the uninsured and uncollateralized deposits.
Further, although Banc of California has a large securities portfolio, the unrealized mark-to-market losses on the portfolio are quite low. These unrealized losses amounted to $47 million on the Available-for-Sale portfolio, which is just 5% of the equity book value.
Maintaining a Hold Rating
Banc of California is offering a dividend yield of 3.5% at the current quarterly dividend rate of $0.10 per share. The earnings and dividend estimates suggest a payout ratio of 28% for 2023, which is easily sustainable. Therefore, the dividend appears secure.
I’m using the peer average price-to-tangible book (“P/TB”) and price-to-earnings (“P/E”) multiples to value Banc of California. Peers are trading at an average P/TB ratio of 0.9 and an average P/E ratio of 7.4, as shown below.
| BANC | BY | DCOM | QCRH | EGBN | CTBI | Peer Average | |
| P/E ("ttm") | 7.5 | 7.6 | 4.6 | 6.9 | 5.7 | 8.0 | 6.6 |
| P/E ("fwd") | 8.8 | 7.5 | 6.4 | 7.2 | 7.3 | 8.6 | 7.4 |
| P/B ("ttm") | 0.7 | 0.9 | 0.6 | 0.9 | 0.5 | 1.0 | 0.8 |
| P/TB ("ttm") | 0.8 | 1.1 | 0.8 | 1.1 | 0.6 | 1.1 | 0.9 |
| Source: Seeking Alpha | |||||||
Multiplying the average P/TB multiple with the forecast tangible book value per share of $15.0 gives a target price of $13.8 for the end of 2023. This price target implies an 18% upside from the June 23 closing price. The following table shows the sensitivity of the target price to the P/TB ratio.
| P/TB Multiple | 0.72x | 0.82x | 0.92x | 1.02x | 1.12x |
| TBVPS - Dec 2023 ($) | 15.0 | 15.0 | 15.0 | 15.0 | 15.0 |
| Target Price ($) | 10.8 | 12.3 | 13.8 | 15.3 | 16.8 |
| Market Price ($) | 11.7 | 11.7 | 11.7 | 11.7 | 11.7 |
| Upside/(Downside) | (7.8)% | 5.1% | 18.0% | 30.9% | 43.7% |
| Source: Author's Estimates |
Multiplying the average P/E multiple with the forecast earnings per share of $1.41 gives a target price of $10.4 for the end of 2023. This price target implies a 10.7% downside from the June 23 closing price. The following table shows the sensitivity of the target price to the P/E ratio.
| P/E Multiple | 5.4x | 6.4x | 7.4x | 8.4x | 9.4x |
| EPS 2023 ($) | 1.41 | 1.41 | 1.41 | 1.41 | 1.41 |
| Target Price ($) | 7.6 | 9.0 | 10.4 | 11.8 | 13.2 |
| Market Price ($) | 11.7 | 11.7 | 11.7 | 11.7 | 11.7 |
| Upside/(Downside) | (34.8)% | (22.7)% | (10.7)% | 1.4% | 13.5% |
| Source: Author's Estimates |
Equally weighting the target prices from the two valuation methods gives a combined target price of $12.1, which implies a 3.7% upside from the current market price. Adding the forward dividend yield gives a total expected return of 7.1%. Hence, I’m maintaining a hold rating on Banc of California.
This article was written by

Analyst’s Disclosure: I/we have no stock, option or similar derivative position in any of the companies mentioned, and no plans to initiate any such positions within the next 72 hours. I wrote this article myself, and it expresses my own opinions. I am not receiving compensation for it (other than from Seeking Alpha). I have no business relationship with any company whose stock is mentioned in this article.
Disclaimer: This article is not financial advice. Investors are expected to consider their investment objectives and constraints before investing in the stock(s) mentioned in the article.
Seeking Alpha's Disclosure: Past performance is no guarantee of future results. No recommendation or advice is being given as to whether any investment is suitable for a particular investor. Any views or opinions expressed above may not reflect those of Seeking Alpha as a whole. Seeking Alpha is not a licensed securities dealer, broker or US investment adviser or investment bank. Our analysts are third party authors that include both professional investors and individual investors who may not be licensed or certified by any institute or regulatory body.