Ventas: Blowout Performance From SHOP

Summary
- Ventas had a solid Q1-2023, with SHOP NOI expanding by 17%.
- The FFO though declined, and we explain why.
- We think SHOP will do well over the next 12 months as occupancies rise.
- But there are major headwinds for price appreciation.
- I do much more than just articles at Conservative Income Portfolio: Members get access to model portfolios, regular updates, a chat room, and more. Learn More »
YvanDube
When we last covered Ventas, Inc. (NYSE:VTR), we brought attention to the fact that the REIT had its work cut out for it. Despite having a portfolio that was rebounding from COVID-19 stresses, VTR had a few good years till it cleared the problems. The REIT has gone sideways since then and struggled to gain any traction.
Seeking Alpha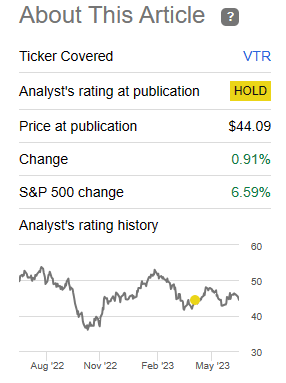
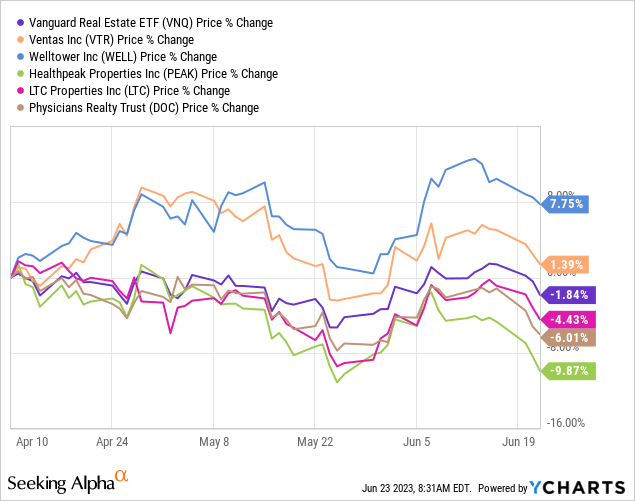
But it has outperformed the REIT sector and the majority of its peers by a decent margin, including beating Healthpeak Properties, Inc. (PEAK) by over 11%.
We look at the Q1-2023 results and the updated guidance and see if the portfolio turnaround is proceeding as planned.
Q1-2023
VTR reported a solid Q1-2023 and did the usual beat on revenues and funds from operations. (FFO). There was some information in the first few slides which might have confused investors. While normalized FFO was down year over year, to the tune of just around 6% or $0.05 per share, this number was in stark contrast to the net operating income (NOI) performance.
Q1-2023 VTR Supplemental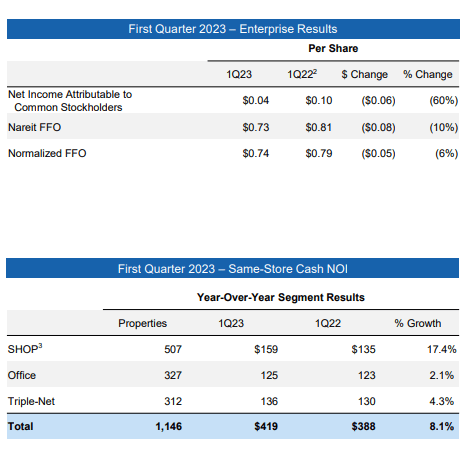
The latter category was up a scintillating 8.1% year over year. Now, this can happen as a result of interest expense changes. Interest expense is further down the line after NOI and you can have rising NOI and falling FFO, although it would be rare after such a huge NOI increase. In the case of VTR, that was definitely not what happened. The reason here had to do with some peculiarities of their largest segment.
As of the first quarter, senior housing operating portfolio, also known as SHOP, was the biggest segment and one which VTR talked the most about.
Q1-2023 VTR Supplemental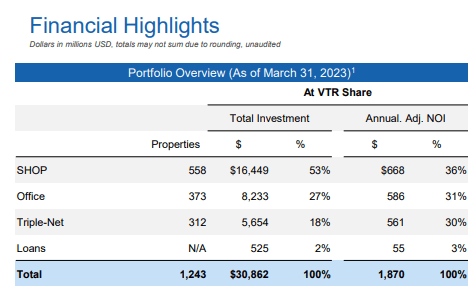
It also showed the biggest NOI improvement year over year, and this amounted to 17.4%. But one has to note the adjustments here in the figure below. There was a total of $32.82 million in HHS grants related to COVID-19 in Q1-2022. The comparison was made after removing this number. That is of course fair. But that also explains in large part why the FFO is down while SHOP is firing on all cylinders.
Q1-2023 VTR Supplemental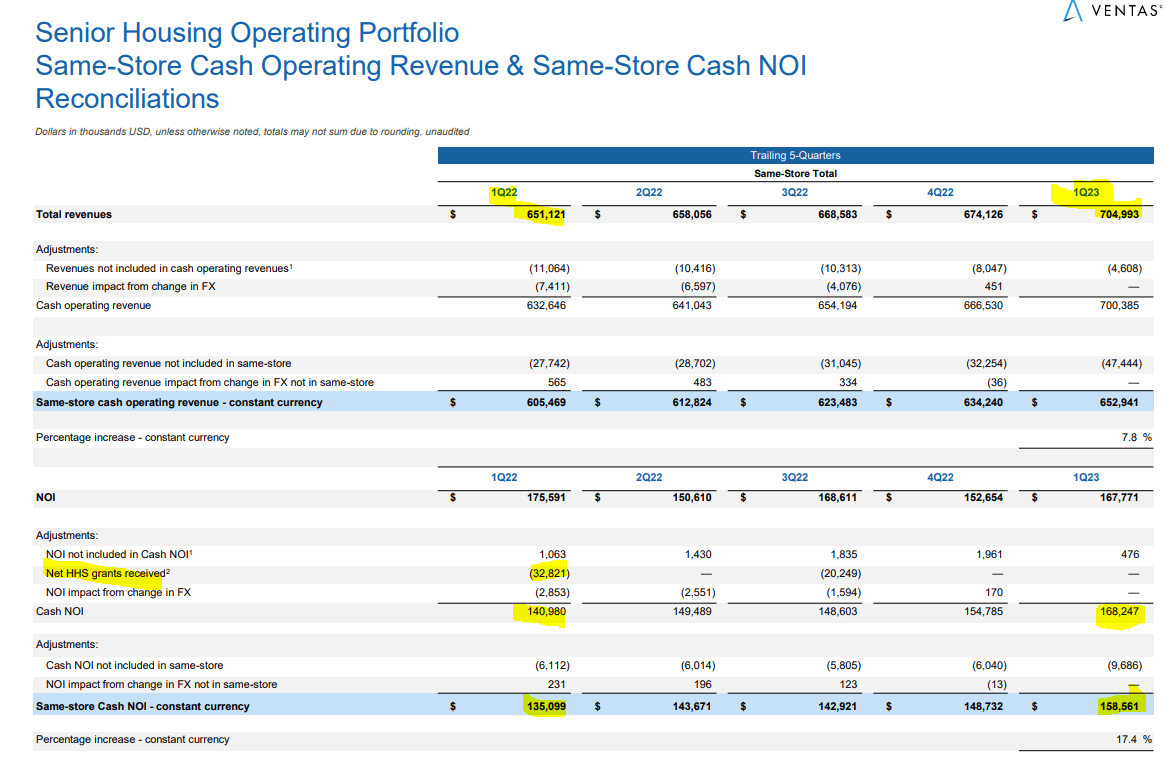
This segment is the most important for VTR as it is the one that can really make or break the REIT's performance. While the office and triple net segments generally are bastions of stability, on the SHOP side is where VTR acts as an operator. It is exposed to occupancy levels, inflation pressures, and the whole margin cycle. It is also the least "REIT-like" segment and will determine VTR's performance over the next five years.
Next, we looked at the medical office portfolio or MOB, where VTR had a far milder performance. Revenues increased in line with rent escalators of around 3% and as expenses rose even faster, NOI was up just 2.1%.
Q1-2023 VTR Supplemental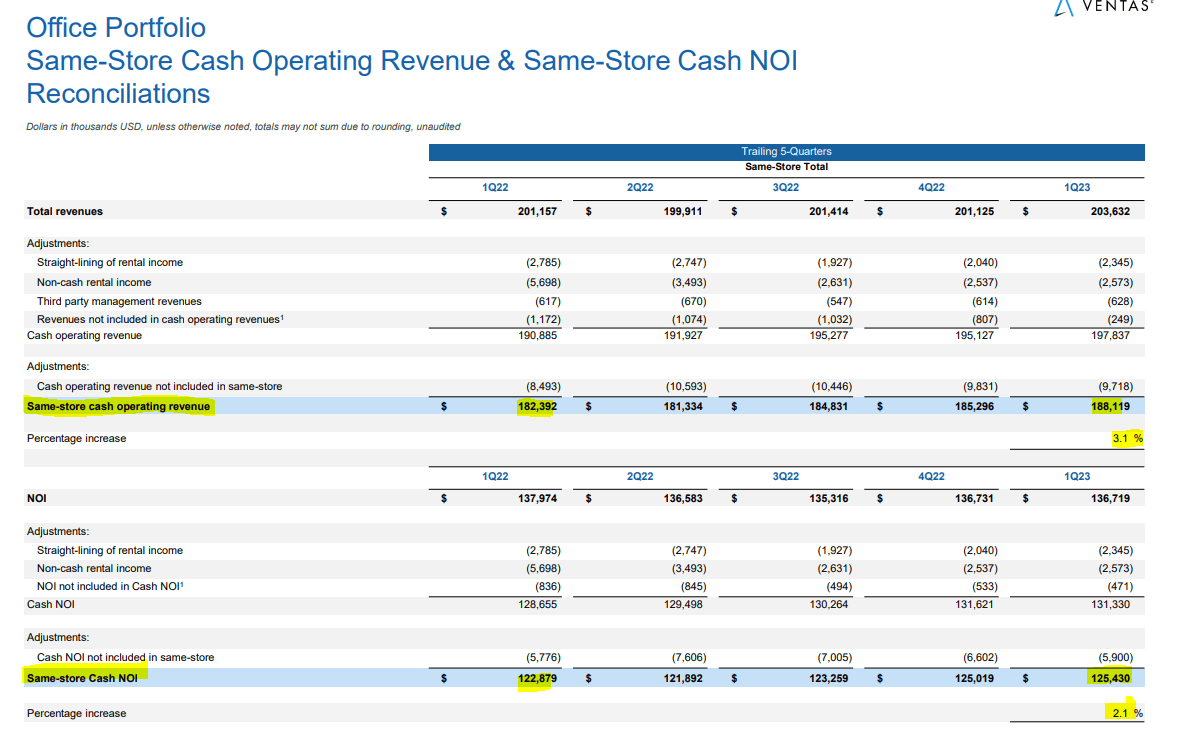
The triple net segment was in between these two and showed an NOI improvement of 4.1%. One area we want to stress on here is that the cash flow coverage (which means the tenant's ability to make rent) remains incredibly weak on the senior housing triple net side. You can see below that as occupancy has gone up, cash flow coverage has hung around the 1.1X mark.
Q1-2023 VTR Supplemental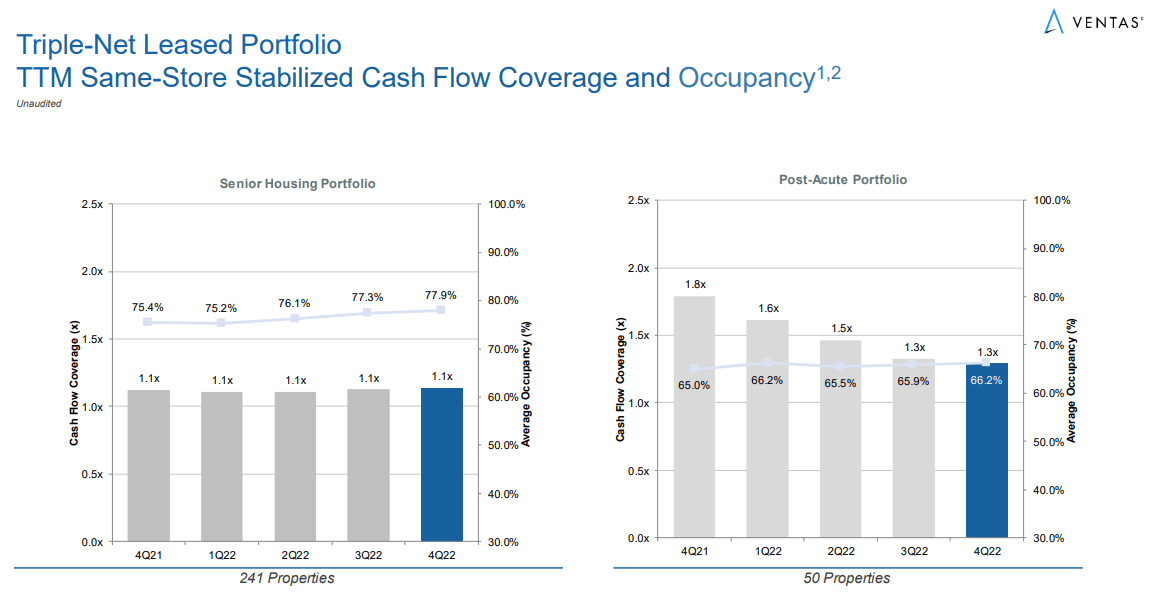
There are two sources of pressure here. The first being that even the tenants did receive grants related to COVID-19 in 2022. These are now absent in Q1-2023. The second is that wage inflation has been a serious problem for these tenants. The tight labor markets have played havoc with their net margins, and hence, rent coverage has stayed remarkably low. While VTR tenants have generally looked really bad by this metric, it has never really been high. Even in far simpler times, like 2015-2016, this metric was just at 1.3X.
Q3-2016 VTR Supplemental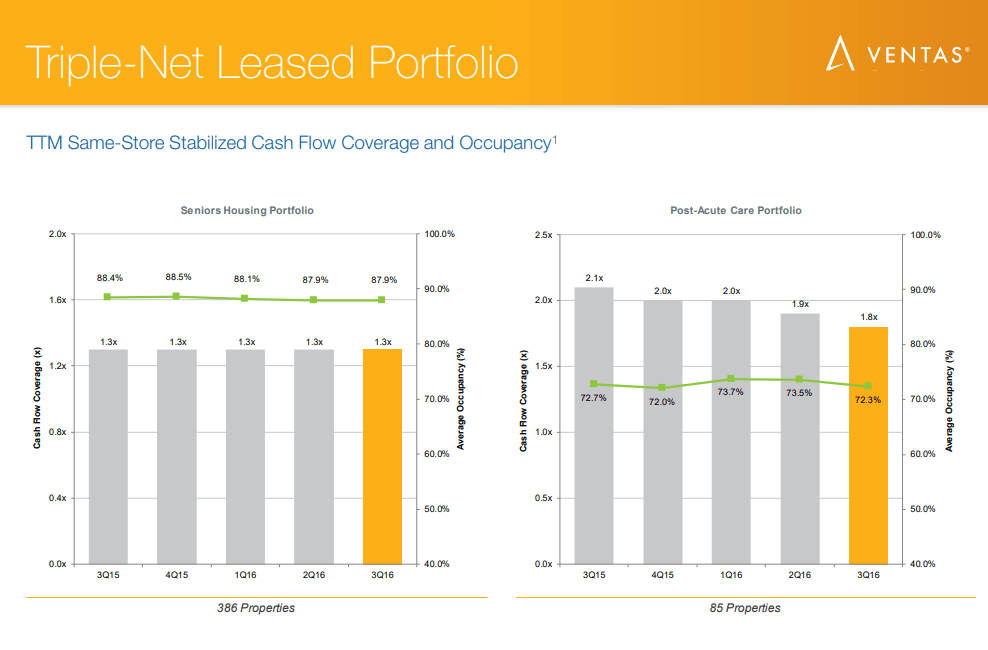
Do note that the Post-acute care segment's rent coverage used to be quite impressive back then. This is a long-term headwind as many tenants will likely get rent relief at some point.
Guidance & Outlook
VTR guided for about $2.97 in FFO for 2023 and that would be about flat compared to 2022.
Q1-2023 VTR Supplemental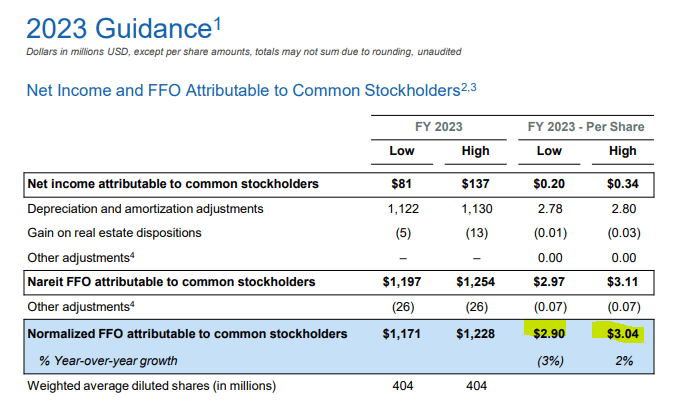
Looking ahead, Wall Street expects solid growth in 2024 and 2025 as the impact of COVID-19 grants fades from comparatives.
Seeking Alpha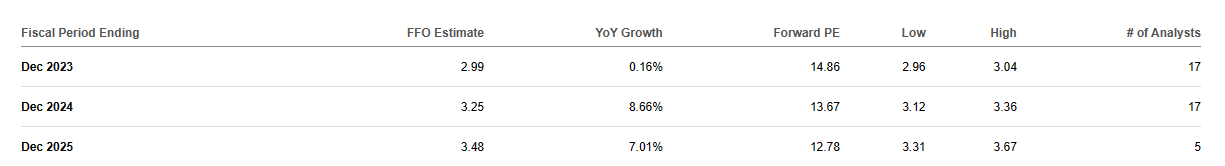
Our take is that these estimates remain optimistic. While we think SHOP could have another banner year in 2024, VTR will be dealing with its debt load. So far it has been a net seller of properties to get its numbers back under control.
Q1-2023 VTR Supplemental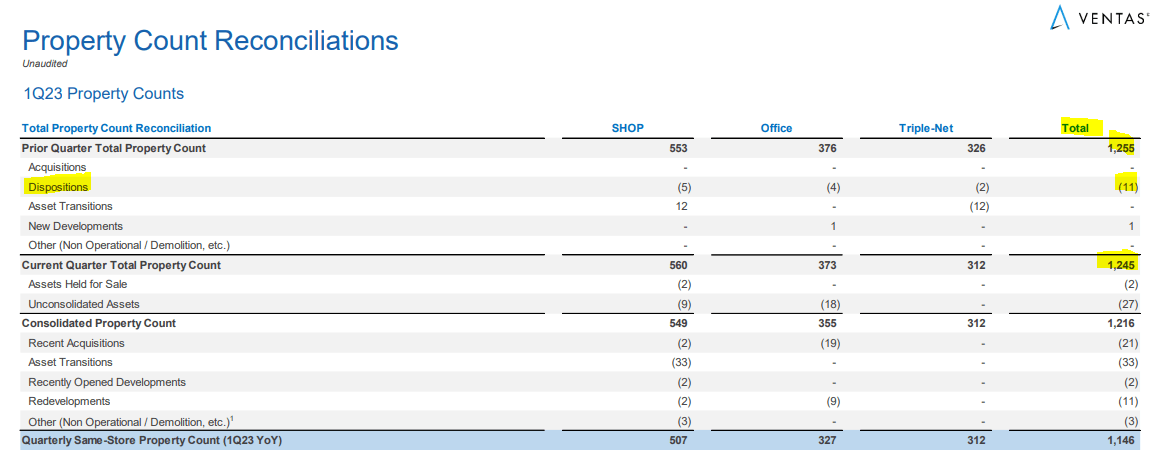
We think this will continue and even perhaps accelerate in 2023 and 2024. There is a huge debt wall here, and the numbers for 2024 and 2025 are particularly daunting.
Q1-2023 VTR Supplemental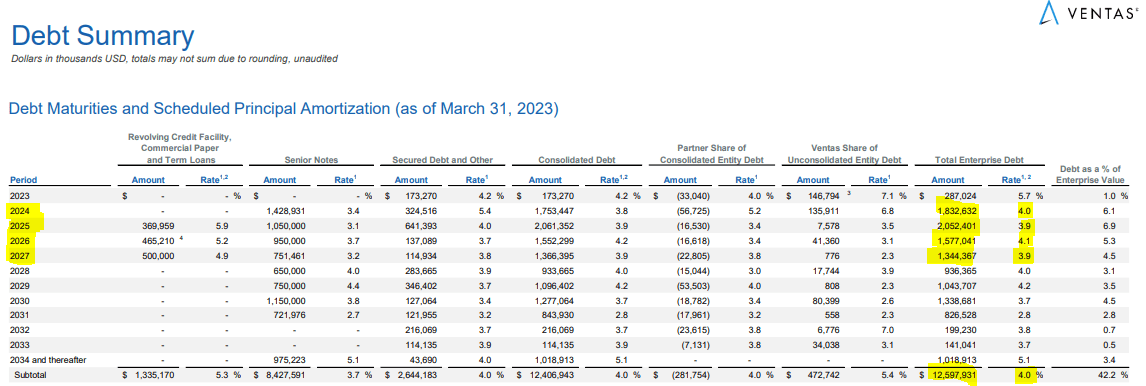
We would note the interest rates on the debt structure, which are currently near 4% as a whole. Well, VTR's shorter-term bonds currently yield over 6%.
Interactive Brokers June 23, 2023
That above is a 6.29% yield to maturity. The company's yield curve has a bit of a double hump, with mid-level maturities yielding 5.5% (November 2030 bonds) and the longer-dated ones back near 6% (February 2045 bonds). Though, all are far higher than what VTR's rolling-off debt is paying today. Equally important, investment grade credit spreads are very well-behaved today, and that won't necessarily be the case in a recession. VTR will get ahead of this by reducing debt to EBITDA levels. Those levels are at 6.9X, what we would call really dangerous territory when your SHOP segment is so huge.
Verdict
VTR had a very solid quarter and the annual guidance is good. The company has used the sanguine credit market conditions to roll over a decent amount of its debt. But lots of work remains on that front. Asset sales will form an important part of that deleveraging process. Overall, we think that FFO comes in under where the analysts are projecting. FFO also disregards capex, which is on VTR's shoulders. Fund's available for distribution, or FAD, is a metric that VTR discloses. But VTR does not run the per share numbers for you. Running them for Q1-2023, we see that FAD was near 63 cents a share.
Q1-2023 VTR Supplemental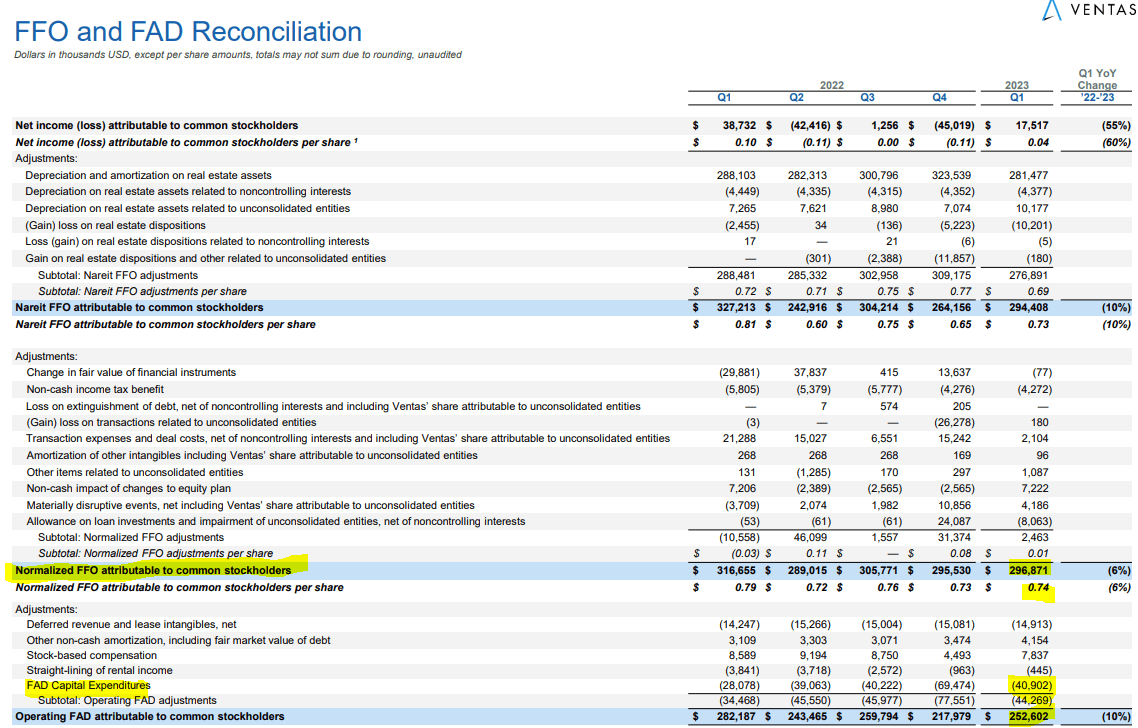
For the year you would expect about $2.50 of FAD and that gives VTR a FAD multiple of 17.75X. We think that is still on the high side in a market with 5% risk-free rates. Despite strong results, we would look for the low $30's as the best buy point for this REIT. In this sector, it is hard to make a strong case for any of the healthcare REITs, but we do like the National Health Investors, Inc. (NHI) bonds which we highlighted recently.
Please note that this is not financial advice. It may seem like it, sound like it, but surprisingly, it is not. Investors are expected to do their own due diligence and consult with a professional who knows their objectives and constraints.
Are you looking for Real Yields which reduce portfolio volatility? Conservative Income Portfolio targets the best value stocks with the highest margins of safety. The volatility of these investments is further lowered using the best priced options. Our Enhanced Equity Income Solutions Portfolio is designed to reduce volatility while generating 7-9% yields.
Give us a try and as a bonus check out our Fixed Income Portfolios.
Explore our method & why options may be right for your retirement goals.

This article was written by

Conservative Income Portfolio is designed for investors who want reliable income with the lowest volatility.
High Valuations have distorted the investing landscape and investors are poised for exceptionally low forward returns. Using cash secured puts and covered calls to harvest income off value income stocks is the best way forward. We "lock-in" high yields when volatility is high and capture multiple years of dividends in advance to reach the goal of producing 7-9% yields with the lowest volatility.
Preferred Stock Trader is Comanager of Conservative Income Portfolio and shares research and resources with author. He manages our fixed income side looking for opportunistic investments with 12% plus potential returns.
Analyst’s Disclosure: I/we have no stock, option or similar derivative position in any of the companies mentioned, and no plans to initiate any such positions within the next 72 hours. I wrote this article myself, and it expresses my own opinions. I am not receiving compensation for it (other than from Seeking Alpha). I have no business relationship with any company whose stock is mentioned in this article.
Seeking Alpha's Disclosure: Past performance is no guarantee of future results. No recommendation or advice is being given as to whether any investment is suitable for a particular investor. Any views or opinions expressed above may not reflect those of Seeking Alpha as a whole. Seeking Alpha is not a licensed securities dealer, broker or US investment adviser or investment bank. Our analysts are third party authors that include both professional investors and individual investors who may not be licensed or certified by any institute or regulatory body.