Divergence In Price Action And Hawkish Central Banks (Technical Analysis)

Summary
- Treasury bond ETFs show resilience despite hawkish central bank actions, suggesting a potential rally in bonds.
- The Dollar Index has broken below key moving averages, indicating a possible next leg lower for the USD.
- The iShares 20+ Year Treasury ETF is testing a mini base, with a big move imminent, potentially catching the market by surprise.
borchee
Despite the recent hawkishness by central banks around the world, Treasury bond ETFs are surprisingly showing a great deal of resilience.
This negative divergence between news and price action tells me that the pain trade might be for bond yields to move lower and for bonds to rally. The pain trade typically refers to the move that the market is not prepared for.
This week, Powell said that in order to combat inflation, the Fed will likely have to continue raising interest rates going forward.
The Bank of England also voted to raise interest rates by 50bps, instead of the 25bps that was the market consensus.
Despite these developments, the Dollar Index broke below its key moving averages on the daily chart, and is now 1-1.5% away from testing key support levels at 100.80. Break below those, and that might pave the way for the USD's next leg lower.
Daily Chart: Dollar Index
TradingView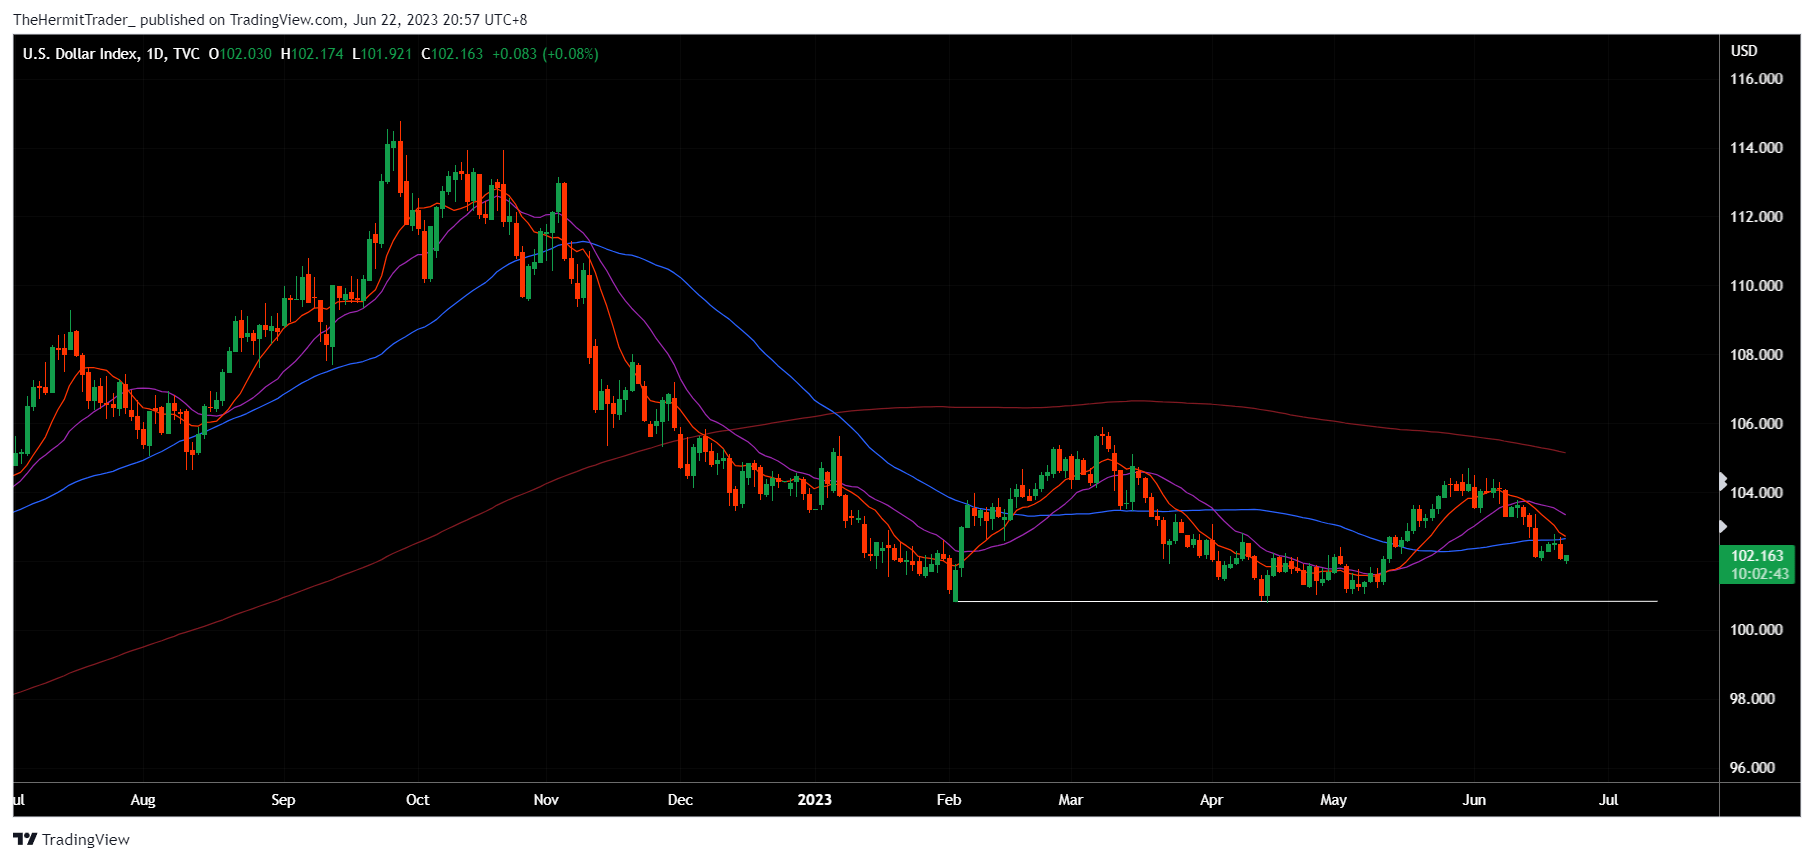
Powell's speech did not provide momentum for the US 10-Year yield to break out higher from its consolidative flag pattern. The market has been range-bound since December, and feels sluggish despite the Fed maintaining its hawkish stance.
Daily Chart: US10Y
TradingView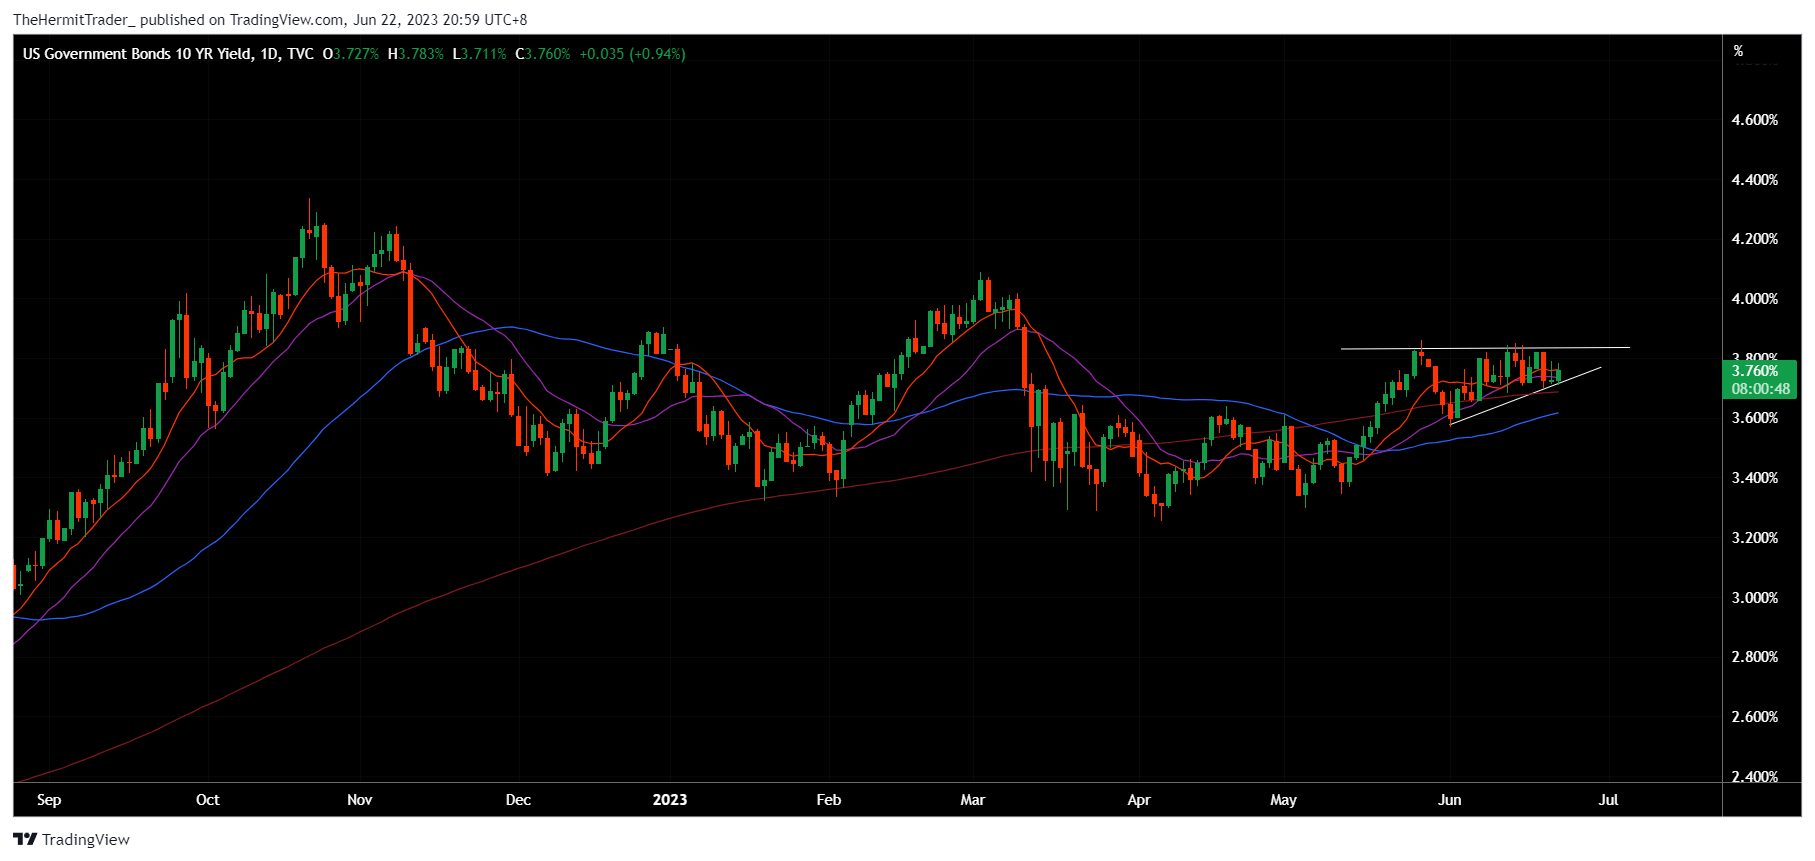
Despite the surprise 50bps rate hike by the Bank of England today (22 June), the Pound's initial rally fizzled out, and it is now trading at the day's low against the USD. GBP/USD is still on a multi-month uptrend, and I will be watching closely when price next tests the uptrend support.
Daily Chart: GBP/USD
TradingView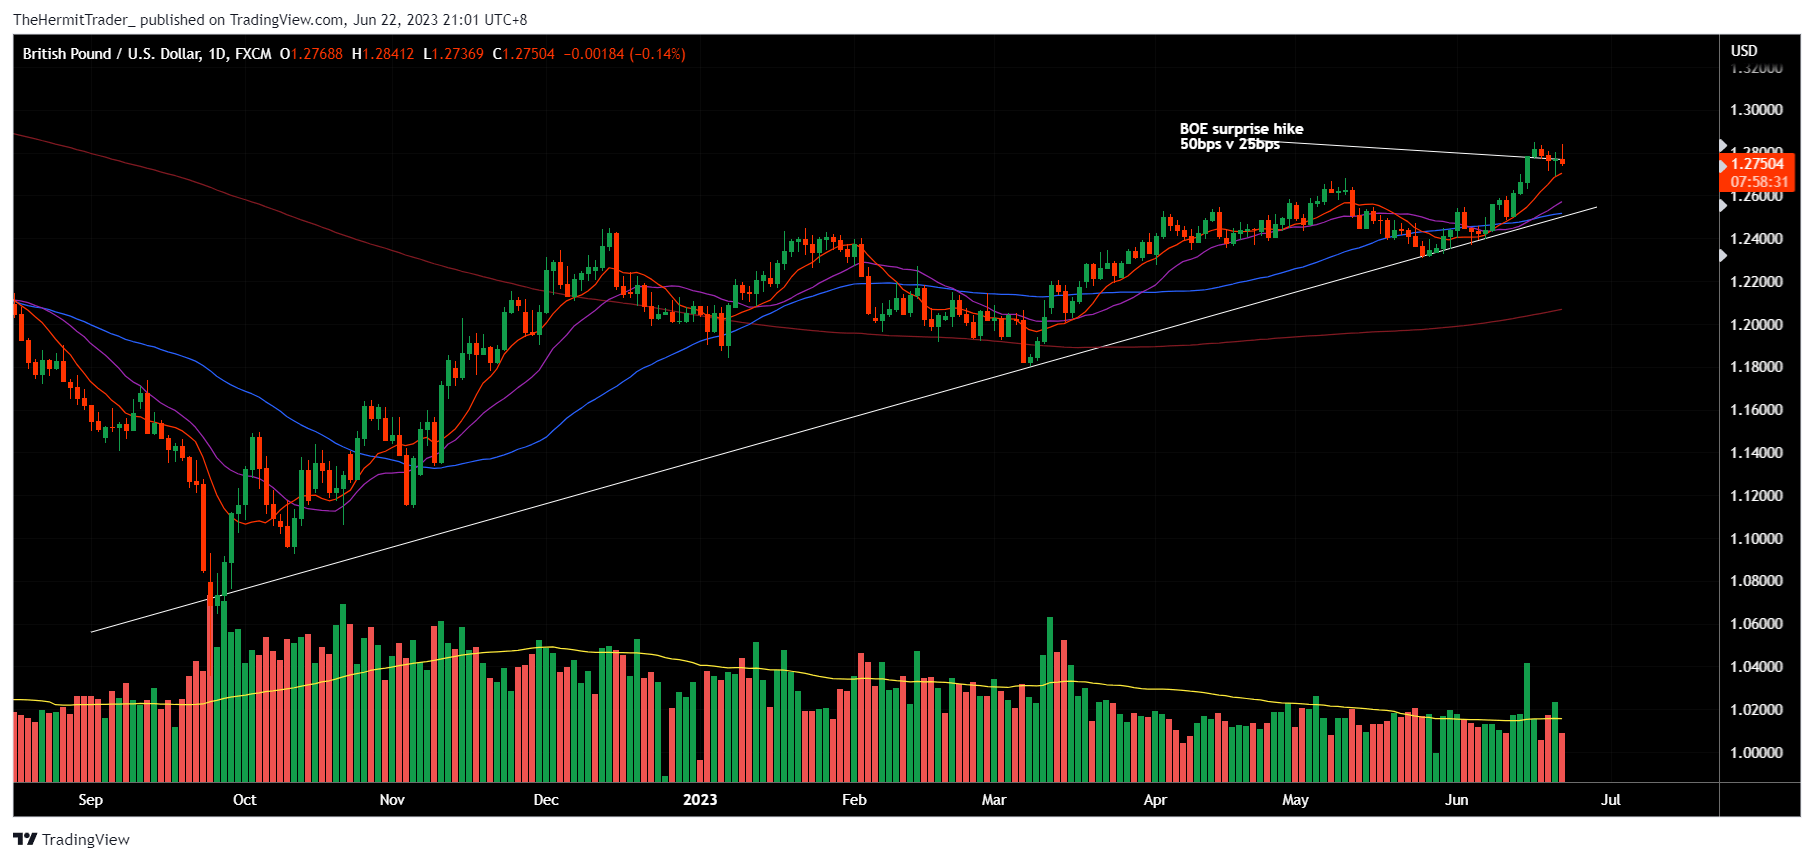
Most interestingly, the iShares 20+ Year Treasury ETF (TLT) has been making a series of higher lows since October, despite the aggressive rate hikes by the Fed. TLT is now testing the neckline of a mini base, and key moving averages are starting to converge. I think a big move is imminent, and the path of maximum pain that catches the market by surprise feels higher.
Daily Chart: TLT
TradingView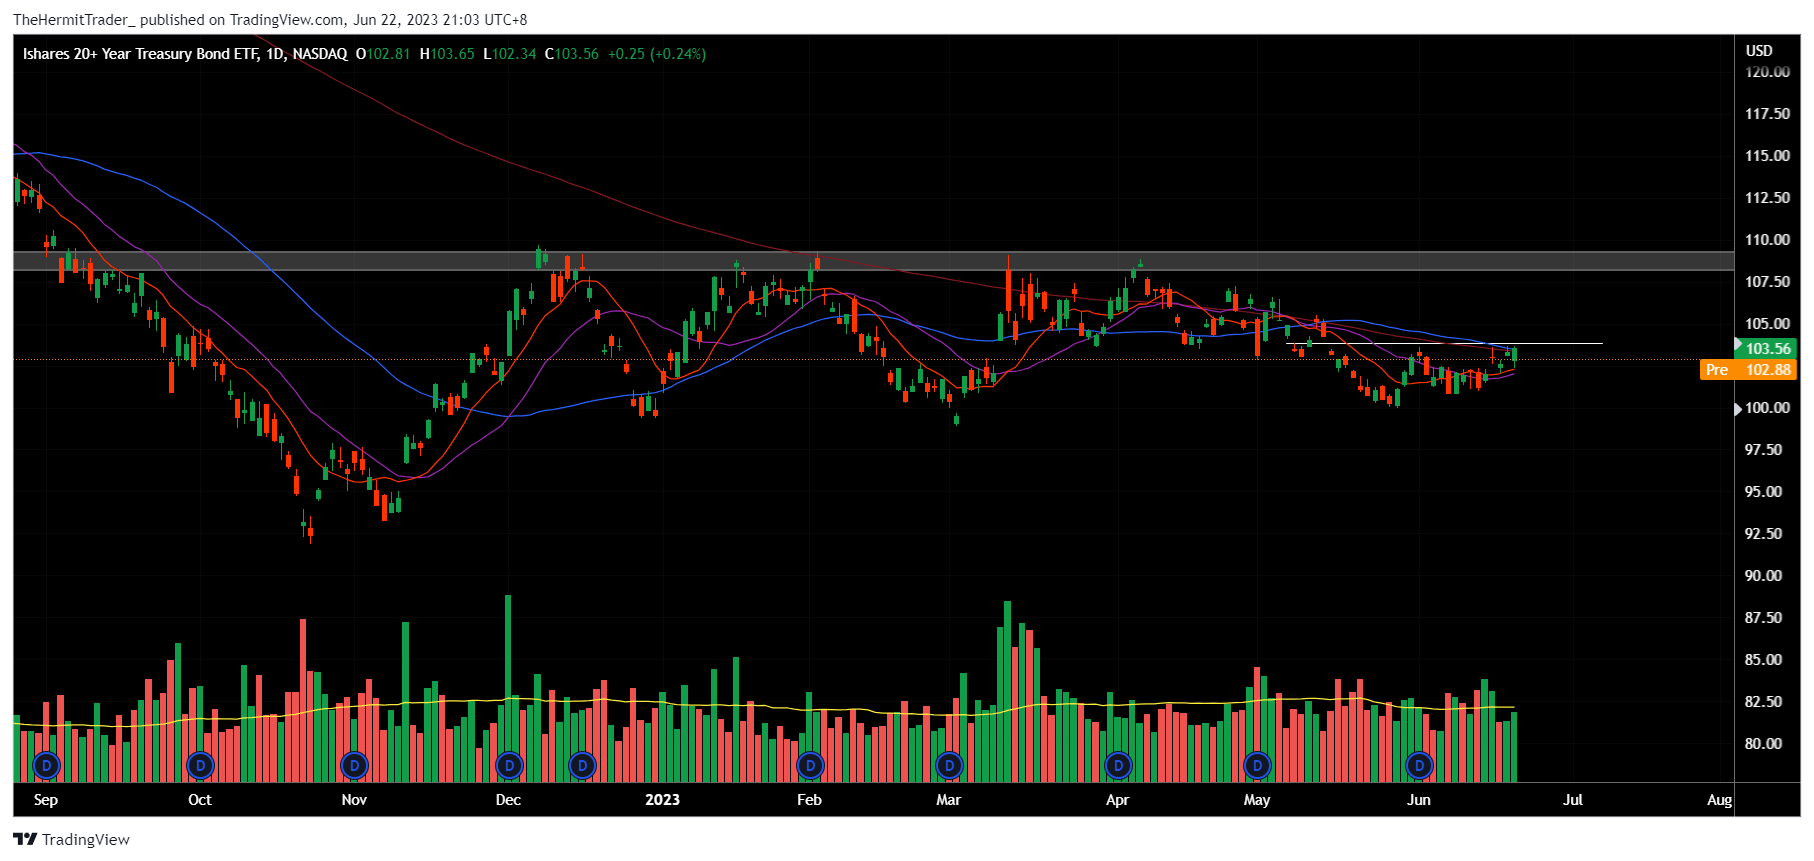
Overall, bonds are showing signs of resilience despite hawkish actions by central banks. This tells me the sell-off in bonds might be waning. If TLT breaks out of its mini base, I would consider a starter long position.
This article was written by

Analyst’s Disclosure: I/we have no stock, option or similar derivative position in any of the companies mentioned, but may initiate a beneficial Long position through a purchase of the stock, or the purchase of call options or similar derivatives in TLT over the next 72 hours. I wrote this article myself, and it expresses my own opinions. I am not receiving compensation for it (other than from Seeking Alpha). I have no business relationship with any company whose stock is mentioned in this article.
Seeking Alpha's Disclosure: Past performance is no guarantee of future results. No recommendation or advice is being given as to whether any investment is suitable for a particular investor. Any views or opinions expressed above may not reflect those of Seeking Alpha as a whole. Seeking Alpha is not a licensed securities dealer, broker or US investment adviser or investment bank. Our analysts are third party authors that include both professional investors and individual investors who may not be licensed or certified by any institute or regulatory body.
Recommended For You
Comments (1)
