ALTY: 7% Yield ETF Beating Competitors, Yet Unattractive

Summary
- Global X Alternative Income ETF is a multi-asset fund with a 7.3% yield.
- It has beaten its 3 closest competitors since 2018, and also in 2023.
- However, the ALTY ETF has lost about 24% in share price and 31% in distributions since inception.
- Bonus: a solution to manage the decay in high-yield funds.
- Quantitative Risk & Value members get exclusive access to our real-world portfolio. See all our investments here »
takasuu
This article series aims at evaluating ETFs (exchange-traded funds) regarding past performance and portfolio metrics. Reviews with updated data are posted when necessary.
ALTY strategy and portfolio
Since my latest article with a sell rating on Global X Alternative Income ETF (NASDAQ:ALTY), the fund has gained less than 1% in total return (including distributions), whereas the S&P 500 (SP500) is up 9.3%. This post renews my opinion with updated data. ALTY is a high yield fund paying monthly distributions. It has 19 holdings, a distribution yield of 7.30% and a total expense ratio of 0.50%. It started investing operations on 07/13/2015 and tracks the Indxx SuperDividend Alternatives Index, a rule-based strategy mixing different categories of securities. The name, index, and strategy have changed on 9/28/2021. It is mostly a fund of funds.
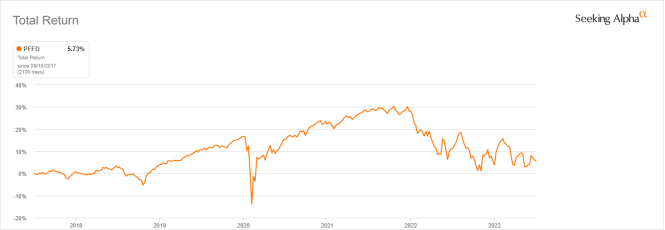
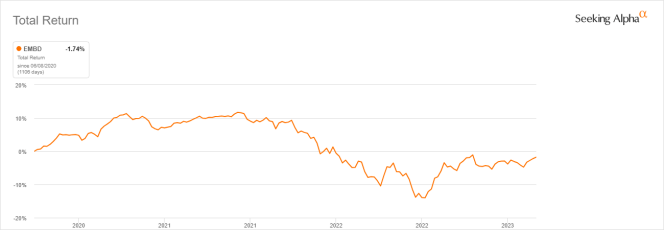
As described by Global X ETFs, the index offers an exposure to five asset categories: Infrastructure/MLPs, real estate, preferred stocks, emerging market bonds and covered calls. For the real estate, preferreds, emerging market bonds and covered calls parts, it just holds other ETFs by the same issuer: Global X SuperDividend REIT ETF (SRET), Global X U.S. Preferred ETF (PFFD), Global X Emerging Markets Bond ETF (EMBD), Global X Nasdaq 100 Covered Call ETF (QYLD). For the infrastructure/MLPs part, it invests directly in MLPs and infrastructure companies. The five categories are equally weighted at 20% at each annual reconstitution. They may be rebalanced quarterly if one of them deviates more than 3% from its target weight.
In the previous version of underlying index (until September 2021), it was holding the same real estate ETF, about 13 closed-end funds and 30 stocks of infrastructure and asset management companies (BDCs). The new structure eliminating CEFs and BDCs resulted in cutting the total expense ratio from 2.8% to 0.5%.
History of largest holdings
Let's have a look at share price charts of ALTY's main constituents:
SRET total return (Seeking Alpha) PFFD total return (Seeking Alpha) EMBD total return (Seeking Alpha) QYLD total return (Seeking Alpha)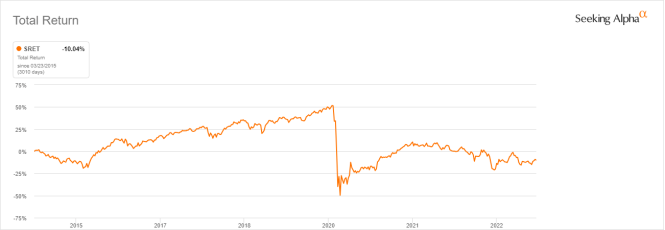

The next one is not a portfolio holding. It is a proxy for the infrastructure/MLPs part.
MLPX total return (Seeking Alpha)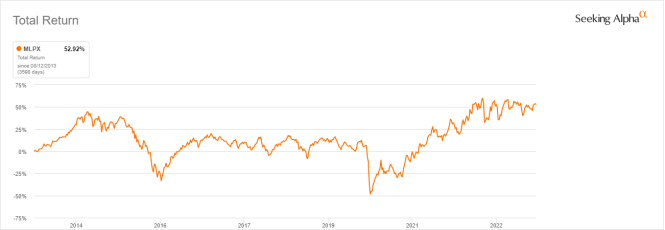
The next table reports the performance of a simulated portfolio holding these 5 ETFs since 1/1/2020, rebalanced quarterly as ALTY does, compared with a dividend benchmark: the iShares Select Dividend ETF (DVY).
Since 1/1/2020 | Total Return | Annual Return | Drawdown | Sharpe ratio | Volatility |
Simulation | -9.61% | -2.87% | -41.14% | -0.13 | 20.47% |
DVY | 21.59% | 5.79% | -41.59% | 0.27 | 21.92% |
The simulated portfolio based on the new underlying index is in loss by almost 10% since January 2000, whereas the benchmark has gained over 20%.
Performance
The next chart compares the total returns since 1/1/2018 of ALTY and 3 other multi-asset high-yield ETFs:
- Multi-Asset Diversified Income Index Fund (MDIV), reviewed here,
- GraniteShares HIPS US High Income ETF (HIPS), reviewed here,
- iShares Morningstar Multi-Asset Income ETF (IYLD), reviewed here.
These funds are close competitors, but they are structured in different ways across asset classes: follow the review links above for more information.
ALTY vs competitors since 2018, total return (Seeking Alpha)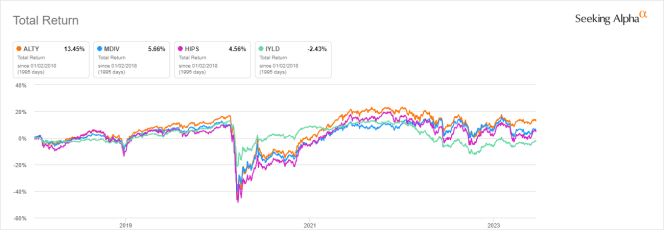
ALTY is the best performer among its peers. It is also ahead of the pack in 2023 to date:
ALTY vs competitors year-to-date, total return (Seeking Alpha)
Despite beating competitors, ALTY has lost about 24% in share price since inception (combining successive underlying indexes).
ALTY share price (without dividends) (Seeking Alpha)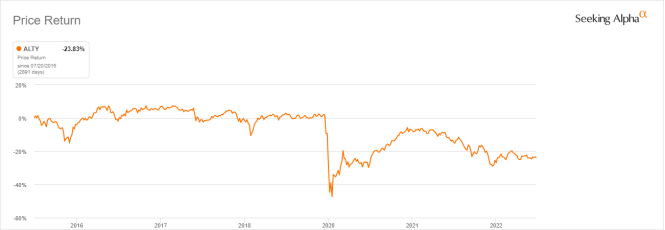
This issue is not specific to ALTY: funds with yields above 6% suffer from capital decay on average (there are rare exceptions).
Distribution history is not more attractive. The annual sum of distributions has gone down from $1.22 per share in 2016 to $0.84 in 2021. For shareholders, it is a 31% cut in income stream, while the cumulative inflation has been about 23% in the same time (based on CPI).
ALTY distribution history (Seeking Alpha)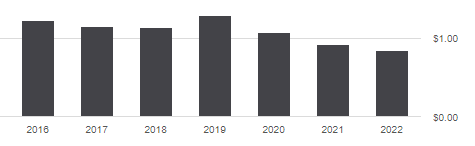
Global X Alternative Income ETF managers have improved their products with the new version by drastically reducing the total expense ratio. However, it's difficult to make a good product with bad and average components. ALTY may be useful for swing trading, tactical allocation, or capturing some market anomalies. However, historical data show it is a risky long-term investment.
Bonus: a solution to manage the decay in high-yield funds
Capital and income decay is an issue in many closed-end funds, like in high yield ETFs. However, it may be avoided or mitigated by rotational strategies. I designed a 5-factor ranking system in 2016, and monitored its performance during several years. I started publishing the eight best ranked CEFs in Quantitative Risk & Value (QRV) after the March 2020 meltdown. The list is updated every week. It isn't a model portfolio: trading the list every week is too costly in spreads and slippage. Its purpose is helping investors find funds with a good entry point. In the table below, I give the hypothetical example of starting a portfolio on 3/25/2020 with my initial "Best 8 Ranked CEFs" list and updating it every 3 months, ignoring intermediate updates. Return is calculated with holdings in equal weight and reinvesting dividends at the beginning of every 3-month period.
Since 3/25/2020 | Total Return | Annual Return | Drawdown | Sharpe ratio | Volatility |
Best 8 CEFs quarterly | 123.75% | 28.20% | -20.60% | 1.16 | 20.18% |
ALTY | 73.20% | 18.46% | -18.48% | 0.9 | 17.08% |
SPY | 85.18% | 20.93% | -24.50% | 0.92 | 18.70% |
This simulation is not a real portfolio and not a guarantee of future return.
Of course, past performance (real or simulated) is not representative of future return. However, I think a time-tested rotational strategy in CEFs has a much better chance to protect both capital and income streams against erosion and inflation than a high-yield ETF.
Quantitative Risk & Value (QRV) features data-driven strategies in stocks and closed-end funds outperforming their benchmarks since inception. Get started with a two-week free trial now.

This article was written by

Step up your investing experience: try Quantitative Risk & Value for free now (limited offer).
I am an individual investor and an IT professional, not a finance professional. My writings are data analysis and opinions, not investment advice. They may contain inaccurate information, despite all the effort I put in them. Readers are responsible for all consequences of using information included in my work, and are encouraged to do their own research from various sources.
Analyst’s Disclosure: I/we have no stock, option or similar derivative position in any of the companies mentioned, and no plans to initiate any such positions within the next 72 hours. I wrote this article myself, and it expresses my own opinions. I am not receiving compensation for it (other than from Seeking Alpha). I have no business relationship with any company whose stock is mentioned in this article.
Seeking Alpha's Disclosure: Past performance is no guarantee of future results. No recommendation or advice is being given as to whether any investment is suitable for a particular investor. Any views or opinions expressed above may not reflect those of Seeking Alpha as a whole. Seeking Alpha is not a licensed securities dealer, broker or US investment adviser or investment bank. Our analysts are third party authors that include both professional investors and individual investors who may not be licensed or certified by any institute or regulatory body.