COWZ June Reconstitution Update: 18 Substitutions, 12x Forward P/E, High Quality Remains

Summary
- The Pacer US Cash Cows 100 ETF consistently selects 100 high-quality U.S. securities trading at attractive valuations. Fees are high at 0.49%, but long-term compounded returns are impressive.
- However, COWZ's annual returns from 2017-2023 are inconsistent relative to the value and blend peer groups I've assigned. This introduces timing risks, as COWZ is often a below-average performer.
- COWZ emphasizes value in the struggling Energy sector. However, what worked in 2021-2022 won't necessarily work in 2023. Despite quarterly reconstitutions, COWZ has been slow to unwind these risky stocks.
- You might choose to use COWZ as a complementary ETF. A unique feature is its high 9.35/10 Profitability Score, impressive for a portfolio that avoids most of the largest Russell 1000 companies.
- Looking for a portfolio of ideas like this one? Members of Hoya Capital Income Builder get exclusive access to our subscriber-only portfolios. Learn More »
Lumineux_Images
Investment Thesis
The Pacer US Cash Cows 100 ETF (BATS:COWZ) is a portfolio of 100 U.S. stocks with high free cash flow yields, resulting in high-quality selections with low valuation ratios. Over time, it's also become Pacer's own cash cow. This alternative ETF has amassed $13.20 billion in assets under management since it launched in December 2016, and with a relatively steep 0.49% expense ratio, Pacer is raking it in each year. By all accounts, COWZ is a success.
COWZ underwent another quarterly reconstitution update effective June 20, 2023. This article summarizes the 18 changes made and analyzes the entire ETF's fundamentals, including concentration, volatility, growth, valuation, profitability, and earnings strength metrics. I look forward to walking you through the latest numbers and deciding if upgrading my rating on COWZ to a buy is reasonable.
COWZ Overview
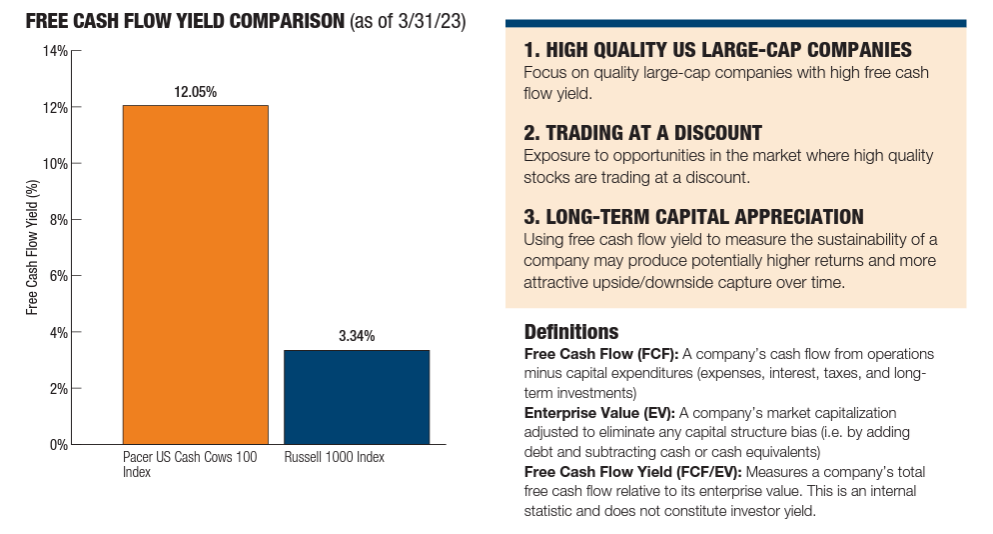
COWZ tracks Pacer's proprietary US Cash Cows 100 Index, selecting large-cap Russell 1000 stocks based on their free cash flow yields. Free cash flow is a company's cash flow from operations less capital expenditures, and this figure is divided into a company's enterprise value (market capitalization plus debt less cash) to arrive at free cash flow yield. The screening process results in a dramatically different portfolio, illustrated nicely on COWZ's latest fact sheet. Note that these results do not reflect the newest reconstitution, but it explains how different COWZ is from plain vanilla funds.
Pacer ETFs
As of March 31, 2023, the Index's Free Cash Flow Yield was 12.05% vs. 3.34% for the Russell 1000 Index, resulting in low valuation ratios. Pacer's claim of selecting high-quality large-cap companies is also reasonably accurate. As I will highlight later, COWZ has a $58 billion weighted average market capitalization and a 9.35/10 Profitability Score.
REITs are eligible, but other Financial securities are not, with reconstitutions occurring quarterly on the third Friday in March, June, September, and December. One criticism is that constituents are weighted based on trailing free cash flow (not yield) despite using forward free cash flow and earnings to define the selection universe. I think it's a flaw, and I predicted in March 2022 how COWZ would be slow to unwind its Energy holdings even with its frequent quarterly reconstitutions. Even amidst weakness in the sector, COWZ is still 35% Energy.
Seeking Alpha
Performance Analysis
Compounded Returns
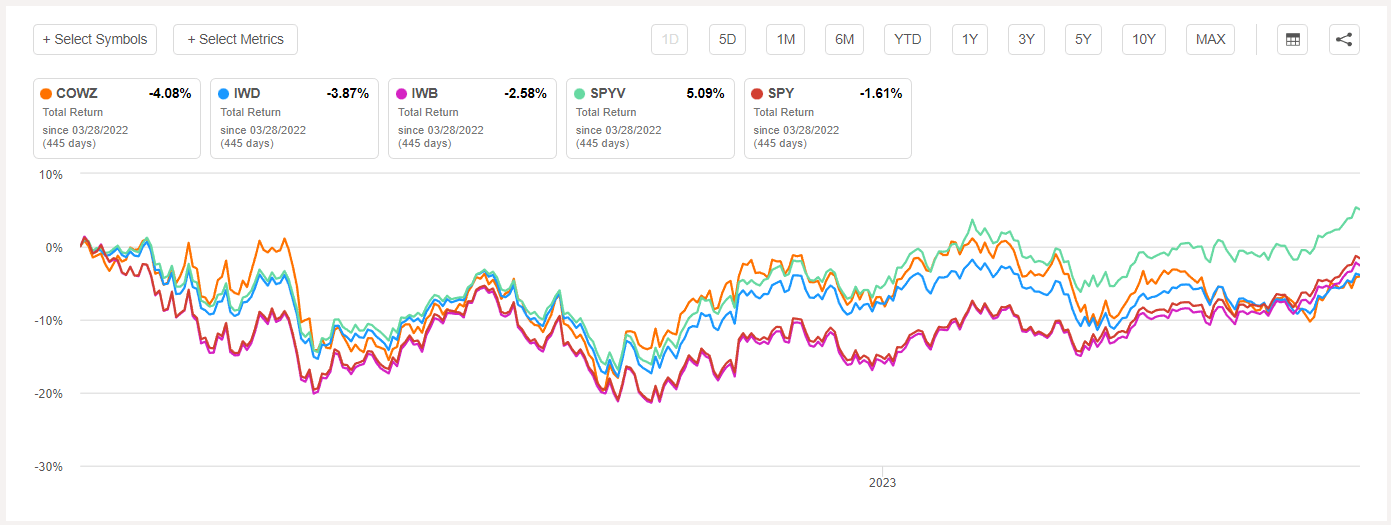
The following performance chart is a primary tool for most investors. It compares an ETF's total returns (assuming reinvested dividends) with an appropriate peer group. In this example, I chose the iShares Russell 1000 Value ETF (IWD) and the iShares Russell 1000 ETF (IWB) because those are the two benchmarks Pacer uses on its fund page.
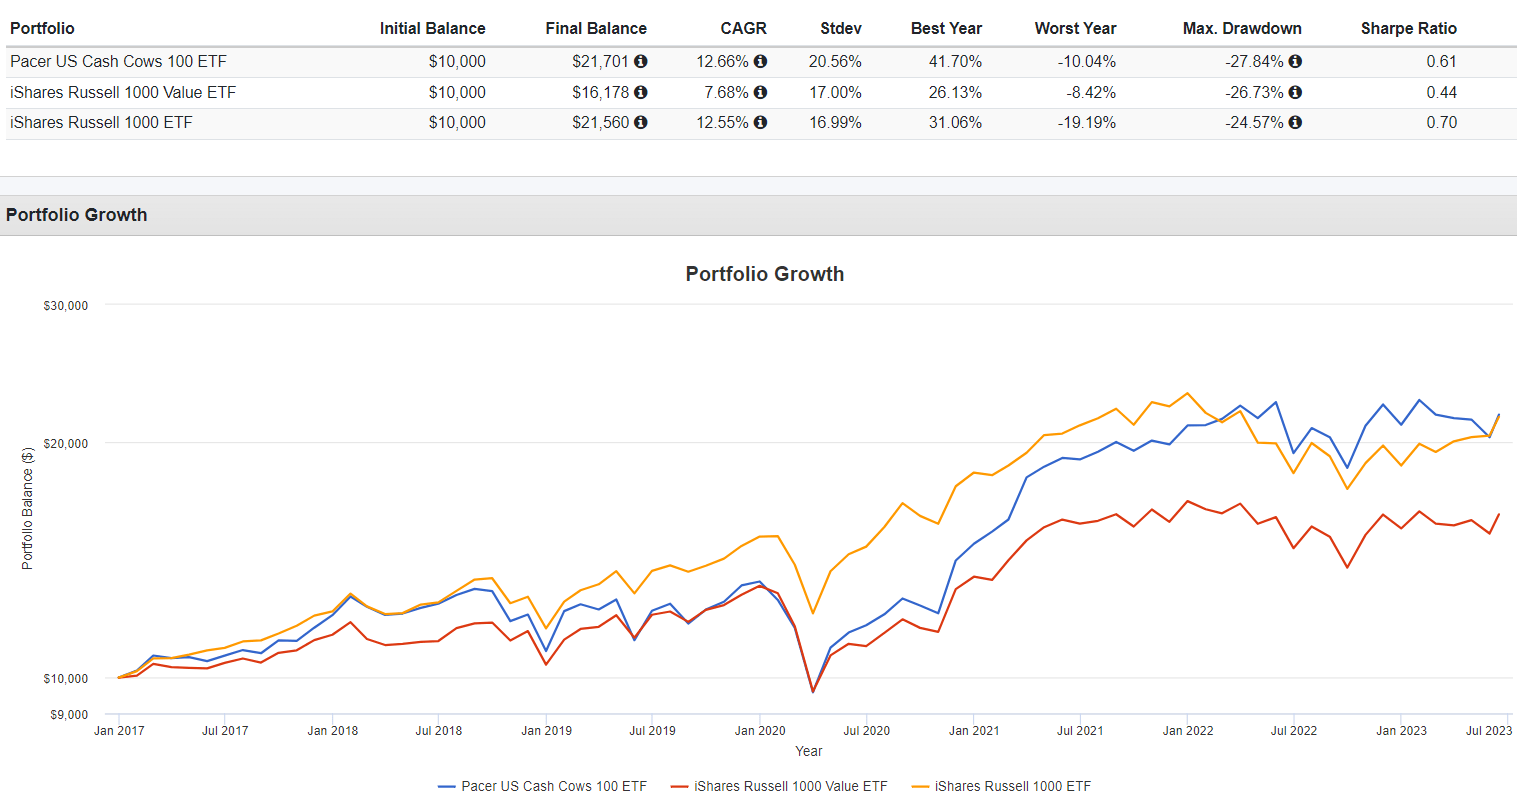
Portfolio Visualizer
I don't know which benchmark is more appropriate. On the one hand, COWZ always has a low valuation ratio, so it makes sense for IWD to be its primary benchmark, which is Pacer's preference. On the other hand, its selections are typically highly volatile, which is not a characteristic of large-cap value ETFs. Therefore, IWB might be better from that perspective. Either way, COWZ's 12.66% annualized return since January 2017 is impressive. It slightly beat IWB's 12.55% per year gain and crushed IWD by 5% per year. Considering how it's also a high-fee fund, it's easy to assume the strategy works.
However, these charts are not ideal analysis tools and can cause investors to chase returns, especially if the source of returns (and why it will continue) is not understood. COWZ gained 41.70% and 0.20% in 2021-2022 because of its increasing exposure to Energy stocks. An explanation for why Energy stocks would continue outperforming, even as inflation declined, should have accompanied any buy rating on COWZ. Moreover, Energy prices are notoriously difficult to forecast.
Annual Returns
An alternative is to view an ETF's annual returns regarding how it ranks against other suitable peers. Morningstar is a good starting point for your research. As shown below, COWZ ranked in the third performance quartile between 2017-2019, then was a top performer from 2020-2022, and is now back to below-average performance, underperforming 61% of its peers.
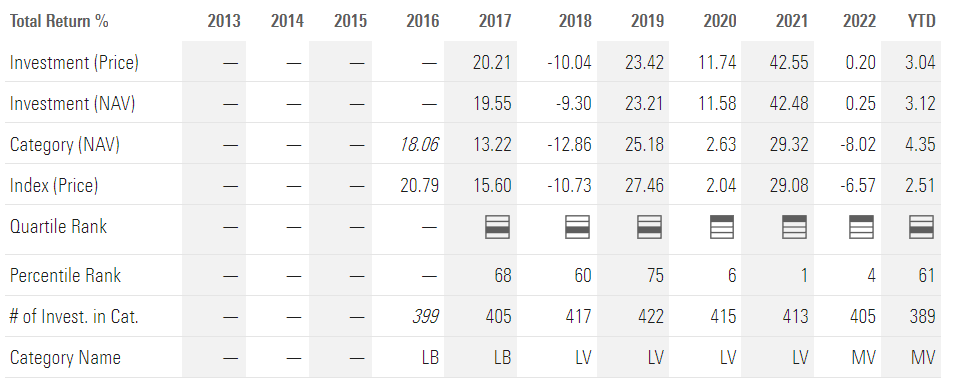
Morningstar
COWZ's assigned category has changed over the years, moving between Large Blend, Large Value, and Mid Value. First, let's consider the value side. The following table summarizes the annual returns for COWZ and 29 large- and mid-cap value funds with at least as much performance history as COWZ. In the last row, I calculated COWZ's ranking using returns through May.
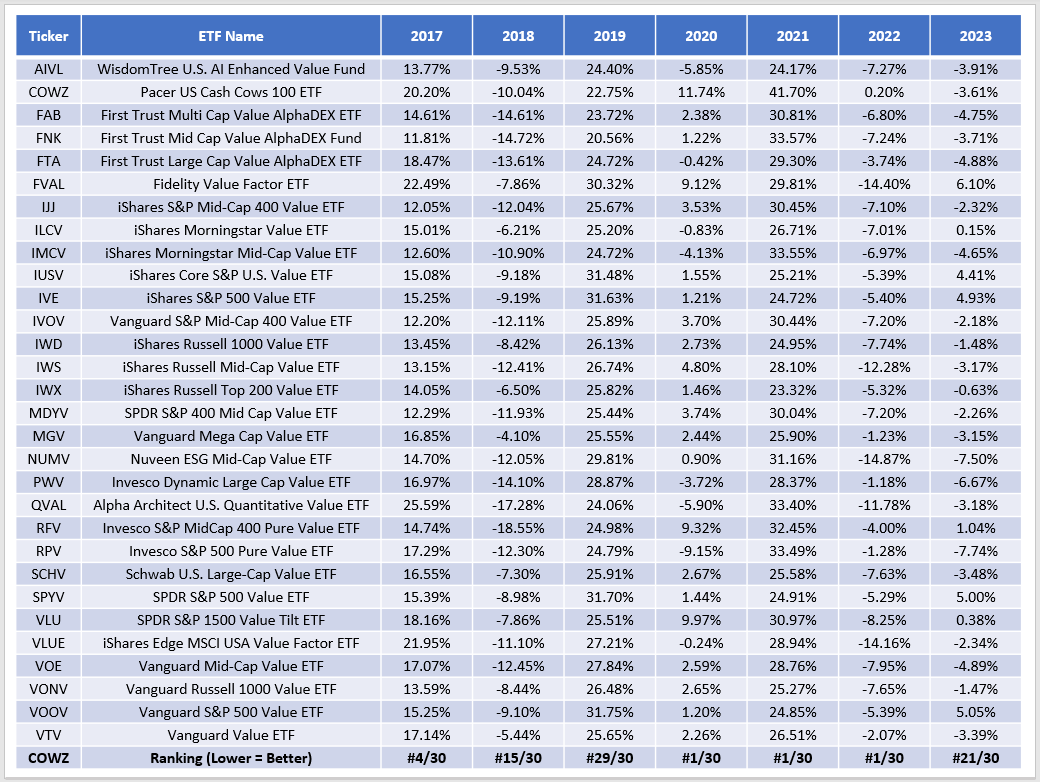
The Sunday Investor
The conclusion is similar to the one presented by Morningstar, but if COWZ were placed in the Large Value category in 2017, it would look even better. Still, returns are inconsistent, and this suggests timing risks. Again, it's essential to understand why an ETF outperformed so you can determine if that success will continue. Otherwise, you might have bought COWZ in January 2023 based on its #1 rank from 2020-2022.
Now let's cover the large blend category. Here are the returns for 29 other large- and mid-cap blend ETFs you might use as comparators for COWZ. To avoid redundancy, I've omitted three S&P 500 ETFs (IVV, VOO, and SPLG), instead using returns for the SPDR S&P 500 ETF (SPY).
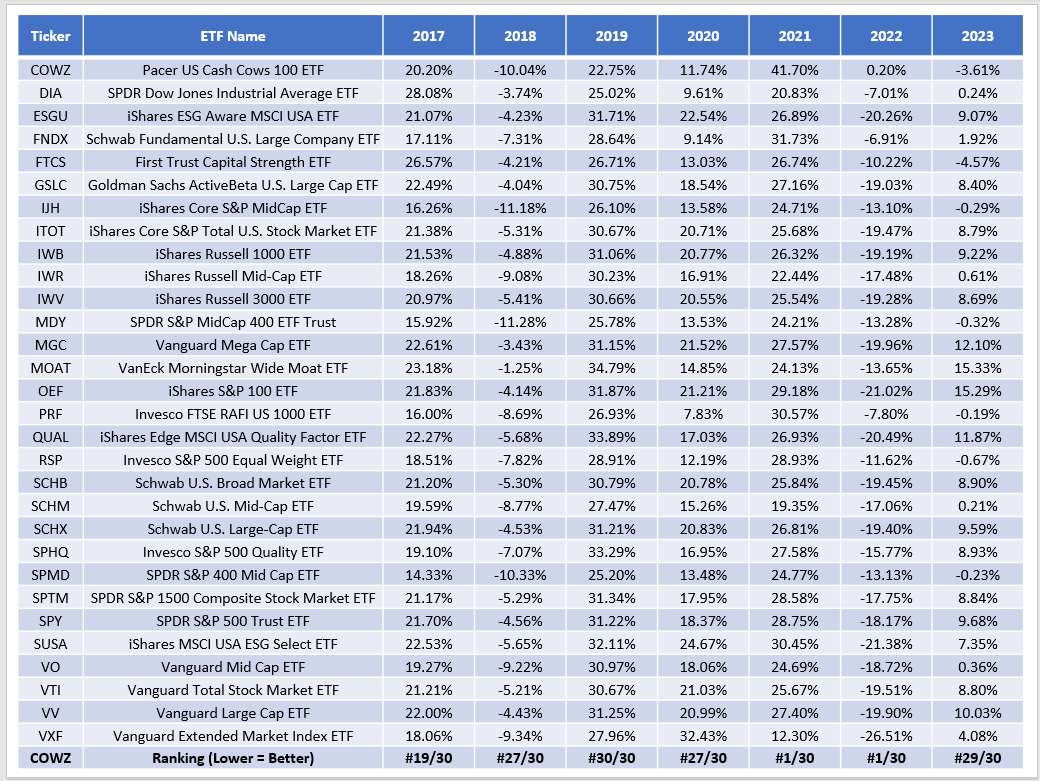
The Sunday Investor
The rankings are generally worse, which is expected in a mostly bullish market. COWZ still ranked #1 in 2021-2022. However, I hope you agree that most of the time, COWZ is an average-performing ETF. That's not to take anything away from its most successful years, but I'm not convinced the free cash flow yield screen was necessary.
For what it's worth, I expressed bullish sentiment for the sector with my December 2021 review of the iShares Core High Dividend ETF (HDV), noting the strong 25+ year correlation between returns for Exxon Mobil (XOM) and changes in the average annual inflation rate. For the same reason, I downgraded HDV as inflation got under control. The timing was good, as HDV outperformed SPY by 20.69% in the first half of 2022 but has lagged by 13.77% from July 2022 onwards. I didn't rely on free cash flow metrics to make those judgments.
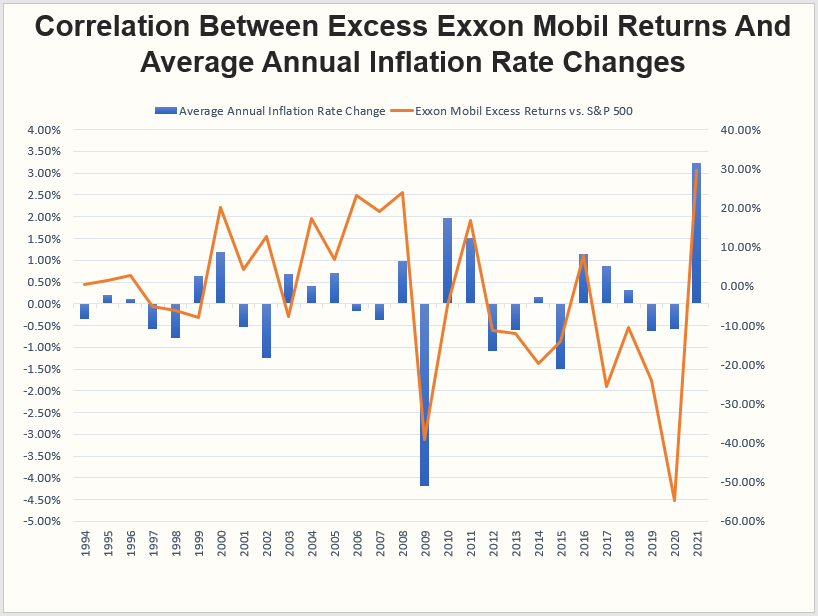
The Sunday Investor
COWZ Analysis
COWZ Reconstitution Summary: 18 Additions
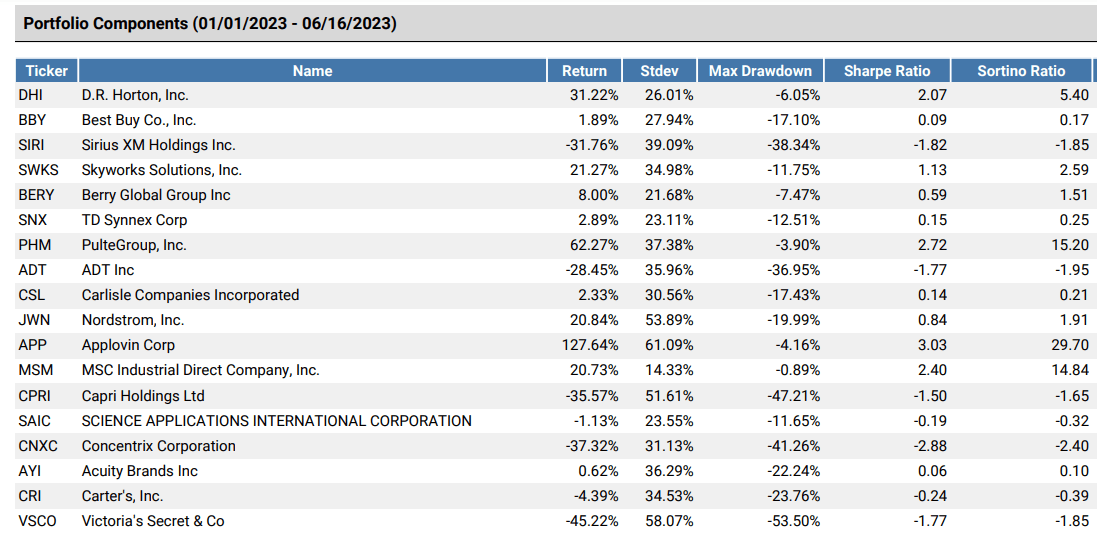
COWZ made 18 additions this quarter. However, most were small- and mid-cap stocks with less than 1% weightings. I've listed them from biggest to smallest below, along with their YTD return statistics through June 16, 2023.
Portfolio Visualizer
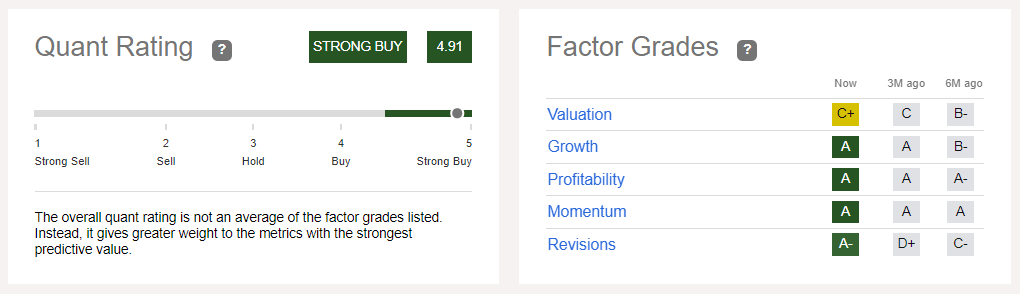
D.R. Horton (DHI) was the most significant addition. The stock is up 31.22% YTD, which would negatively impact FCF Yield. However, DHI's TTM FCF per share increased from $4.02 to $7.85 over the last quarter. The homebuilder smashed earnings expectations in April, and management now sees higher revenues for the remainder of the year. As a result, DHI now has an "A-" Seeking Alpha EPS Revision Grade and a strong 4.91 Quant Score.
Seeking Alpha
Others, like Sirius XM Holdings (SIRI), were added because of a declining share price. The company's TTM FCF per share is steady between $0.37-$0.40, but SIRI is down 31.76% YTD. The result is a higher free cash flow yield, making it more likely to qualify for COWZ. Unlike DHI, the company's fortunes aren't improving, but it's more of a deep value, almost contrarian play.
COWZ Reconstitution Summary: 17 Deletions
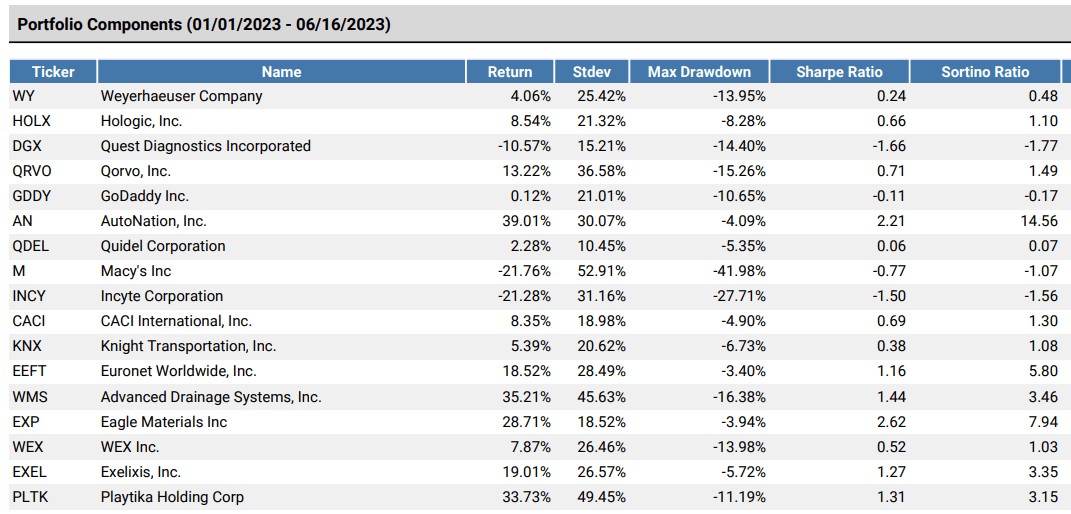
The Index deleted 17 stocks with a combined 8.24% weighting as of May 31, 2023. It's a surprisingly quiet reconstitution for a fund with a 114% portfolio turnover rate for its most recent fiscal year. I've listed the 17 deletions below. Unlike the additions, where there is a mix between strong- and poor-performing stocks this year, the deletions are almost all up on the year.
Portfolio Visualizer
AutoNation (AN) is one example. The automotive retailer's free cash flow per share is on the uptrend and was $22.20 for the twelve months ending March 2023. However, its 39.01% gain pushed it out of value territory.

Seeking Alpha
Macy's (M) is one exception. The stock's TTM FCF per share has fallen off a cliff lately, declining to $0.52 from $6.89 six quarters ago. In my view, these are "good" deletions. A low share price is justified; there's no point in trying to catch a falling knife. Direxion can attest to that after its Fallen Knives ETF (NIFE) closed last year.
Overall, the changes were mainly related to the denominator in the free cash flow yield calculation (decreasing enterprise value) rather than the numerator (increasing free cash flow). Still, these companies only account for 8% of the portfolio. Let's see how the rest of the portfolio looks next.
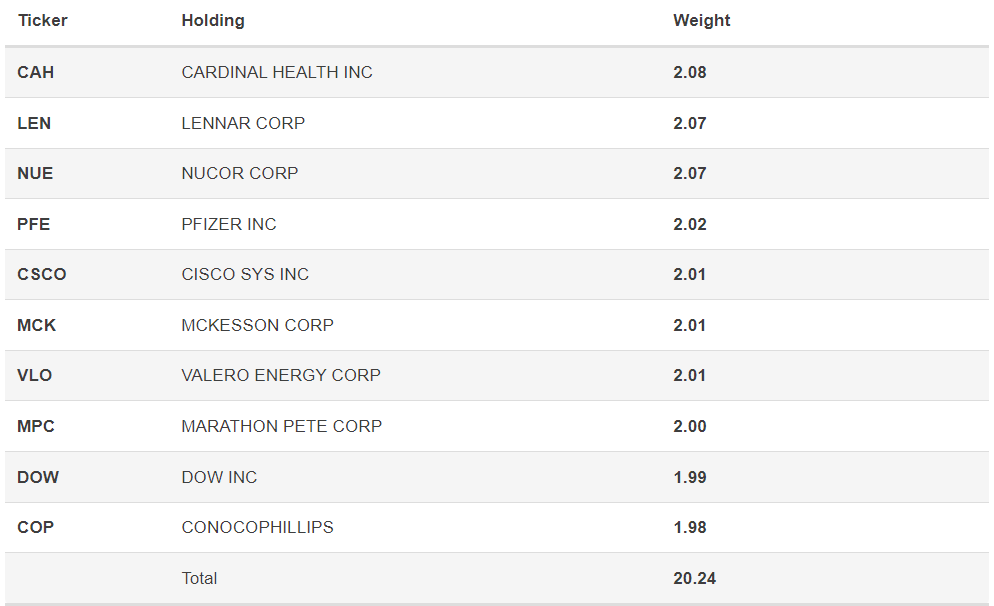
COWZ Top Holdings and Sector Exposures
COWZ's top ten holdings are listed below. The Index applies a 2% capping at each reconstitution, so unfortunately, this list isn't very comprehensive. To illustrate, Valero Energy (VLO), Marathon Petroleum (MPC), and ConocoPhillips (COP) are the three Energy stocks in the top ten. However, there are 20 others, and the sector has a 35.47% total weight.
Pacer ETFs
Health Care (16.53%), Materials (13.86%), and Consumer Discretionary (13.57%) are next, while there is little or no exposure to Consumer Staples, Utilities, Real Estate, and, as mentioned earlier, Financials.
COWZ Fundamentals By Industry
The following table provides a more complete view of COWZ, summarizing its top 25 industries, which total 91% of the fund. Included in the bottom rows are summary metrics for IWD and IWB and metrics for COWZ before its reconstitution.
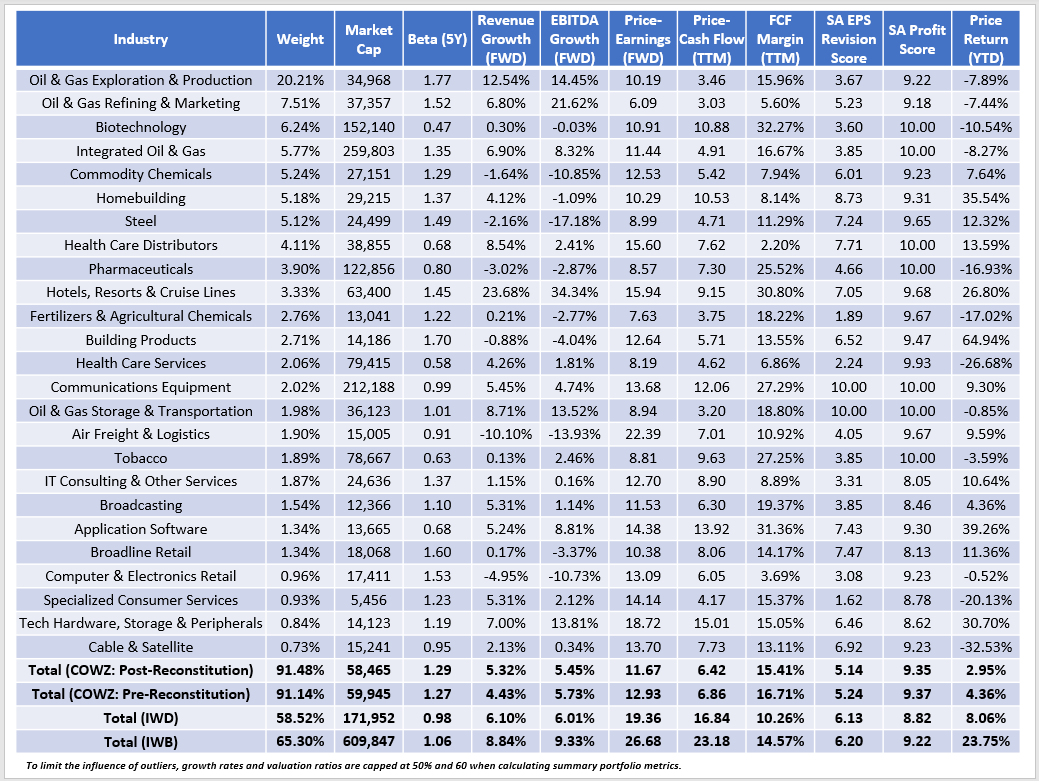
The Sunday Investor
A few observations:
1. COWZ remains a highly volatile ETF, evidenced by its 1.29 five-year beta and the higher standard deviation from the earlier performance chart. Investors should expect it to outperform the broader market in bullish periods and may want compensation for the additional risk. Of course, some investors don't mind extra volatility as long as the returns are satisfactory.
2. COWZ doesn't screen for growth, so we shouldn't expect it to score well on that factor. After the reconstitution, it's slightly behind IWD on sales and EBITDA growth and 3-4% behind IWB. What's noteworthy is that in March 2022, COWZ's growth rates were substantially higher and in line with IWB.
3. As expected, COWZ excels in valuation. It trades at 11.67x forward earnings and 6.42x trailing cash flow, substantially better than IWD and IWB.
4. By weighting companies by free cash flow, COWZ effectively secures a high profitability score of 9.35/10. Its constituents have a 15.41% weighted average trailing free cash flow margin, so Pacer's statement that COWZ focuses on high-quality U.S. companies is accurate. IWB is close at 14.57%, but COWZ is unique because it achieves high profitability by selecting smaller companies. I calculated an 8.33% overlap by weight between the two funds, similar to the 8% that the ETF Research Center notes pre-reconstitution.
5. COWZ has weak earnings and price momentum. It's normal, as it's a deep-value fund, but it's somewhat extreme. Constituents are up a weighted average of 2.95% YTD compared to 8.06% and 23.75% for IWD and IWB. Furthermore, COWZ's 5.14/10 EPS Revision Score suggests they're not performing as well for a good reason. With few exceptions, analysts are not bullish, particularly among Oil & Gas stocks. Oil & Gas E&P companies comprise 20.21% of COWZ, and here is how the top five score using Seeking Alpha's Quant Factor Grading System:
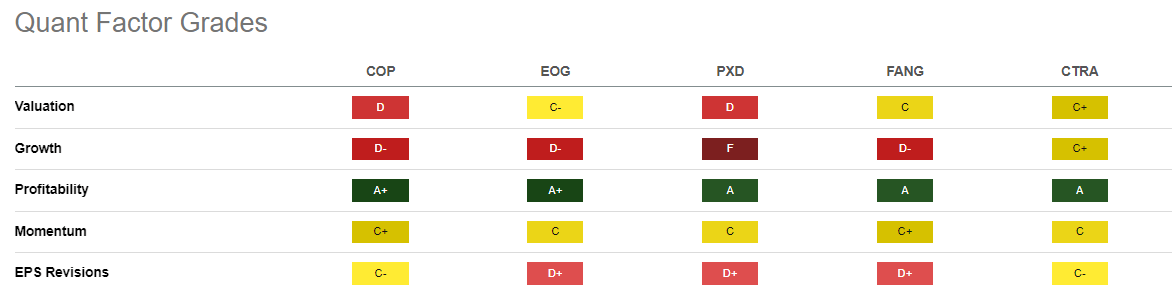
Seeking Alpha
As shown, all have either "C-" or "D+" EPS Revision Grades. However, the more significant problem is the unpredictability of oil prices. For example, the U.S. Energy Information Administration notes a wide confidence interval for the price of crude oil in the short term, ranging from about $30-$145 per barrel by 2025 based on options market information.
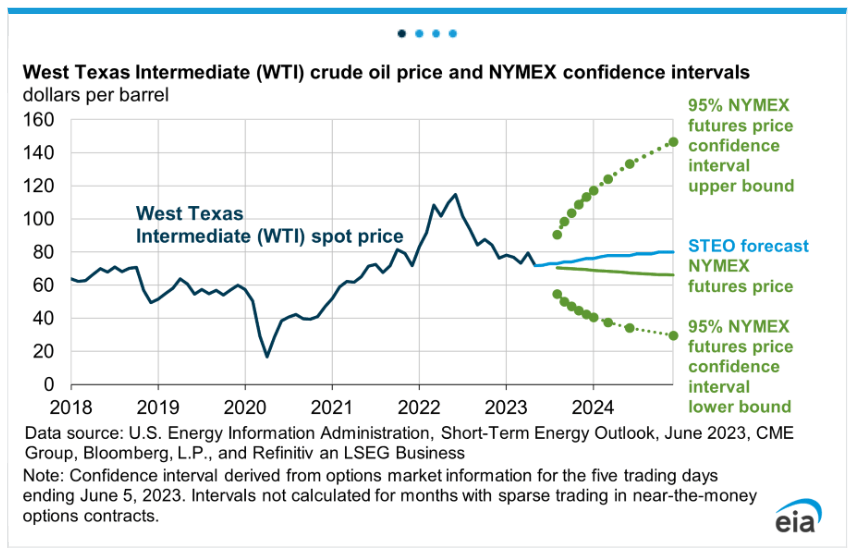
Energy Information Administration (EIA)
Assigning over one-third of a portfolio's weight to this volatile sector feels more like gambling than a sound strategy. COWZ may still be appropriate as a way to boost exposure to Energy, but sector ETFs do the same thing.
Investment Recommendation
I continue to view COWZ as too risky, so I decided not to upgrade my rating. My criticisms include inconsistent annual performance, extreme concentration in the volatile Energy sector, and below-average growth estimates. Furthermore, weak price and earnings revisions indicate it's mainly a contrarian play, which isn't my investment style.
On the positive side, COWZ's reconstitution wasn't eventful, but the ETF kept its excellent valuation and profitability features. You can count on this each quarter, so COWZ might be suitable if you are looking for specific exposure to those factors. It also might complement other value strategies nicely since it avoids the most prominent U.S. stocks, but I suggest only a minimal weighting. Please let me know if you plan to use COWZ in your portfolio in the comments below, and as always, reach out with any questions you may have. Thank you for reading.
The Sunday Investor Joins Income Builder
The Sunday Investor has teamed up with Hoya Capital to launch the premier income-focused investing service on Seeking Alpha. Members receive complete early access to our articles along with exclusive income-focused model portfolios and a comprehensive suite of tools and models to help build sustainable portfolio income targeting premium dividend yields of up to 10%.
Whether your focus is High Yield or Dividend Growth, we’ve got you covered with actionable investment research focusing on real income-producing asset classes that offer potential diversification, monthly income, capital appreciation, and inflation hedging. Start A Free 2-Week Trial Today!

This article was written by

I perform independent fundamental analysis for over 850 U.S. Equity ETFs and aim to provide you with the most comprehensive ETF coverage on Seeking Alpha. My insights into how ETFs are constructed at the industry level are unique rather than surface-level reviews that’s standard on other investment platforms. My deep-dive articles always include a set of alternative funds, and I am active in the comments section and ready to answer your questions about the ETFs you own or are considering.
My qualifications include a Certificate in Advanced Investment Advice from the Canadian Securities Institute, the completion of all educational requirements for the Chartered Investment Manager (CIM) designation, and a Bachelor of Commerce degree with a major in Accounting. In addition, I passed the CFA Level 1 Exam and am on track to become licensed to advise on options and derivatives in 2023. In November 2021, I became a contributor for the Hoya Capital Income Builder Marketplace Service and manage the "Active Equity ETF Model Portfolio", which as a total return objective. Sign up for a free trial today! Hoya Capital Income Builder.
Analyst’s Disclosure: I/we have a beneficial long position in the shares of SPY either through stock ownership, options, or other derivatives. I wrote this article myself, and it expresses my own opinions. I am not receiving compensation for it (other than from Seeking Alpha). I have no business relationship with any company whose stock is mentioned in this article.
Seeking Alpha's Disclosure: Past performance is no guarantee of future results. No recommendation or advice is being given as to whether any investment is suitable for a particular investor. Any views or opinions expressed above may not reflect those of Seeking Alpha as a whole. Seeking Alpha is not a licensed securities dealer, broker or US investment adviser or investment bank. Our analysts are third party authors that include both professional investors and individual investors who may not be licensed or certified by any institute or regulatory body.
Recommended For You
Comments (2)

The quarterly reconstitution doesn't help matters either, and seeing that the average turnover reported for the last 5 FYs = 105% makes me think that if we were to buy it today, we'd know what we're getting, but only 3/4 would remain after 3 months!
So although the investment thesis is interesting, the reconstitution/turnover + the 49 bps is enough to keep me away.
Have you ever done, or thought about doing, some sort of comparison of peer funds to see if the frequency of reconstitution affects their relative performance. My personal bias is that greater frequency would cause lower returns, but don't have anything solid to back that up (other than what's been written about investor behavior).
