SPDW: Growth Profile Not Attractive

Summary
- The SPDR Portfolio Developed World ex-US ETF has an inferior growth profile compared to the S&P 500 index, underperforming it significantly in the long run.
- The fund's downside risk is high, as it tends to underperform the S&P 500 index during economic turmoil and recessions.
- Investors with a long-term investment horizon may be better off investing in funds that track the S&P 500 index instead of SPDW.
Klaus Vedfelt
Introduction
Sometimes investors may want to diversify their portfolio by including stocks outside of the United States. Developed markets outside of the U.S. appears to be a good place to start as they appears to be much more stable than emerging markets. However, is this a good time to invest in developed markets now? In this article, we will analyze SPDR Portfolio Developed World ex-US ETF (NYSEARCA:SPDW) and provide our insights and suggestions.
ETF Overview
SPDW invests in large-cap stocks in developed markets excluding the United States. The fund has trailed the S&P 500 index significantly since its inception due to its slower growth profile and its low exposure to technology sector. In times of economic turmoil, the fund tends to also underperform the S&P 500 index. In other words, downside risk is high. Given uncertain macroeconomic condition, we think it is better for investors to seek other alternatives.
YCharts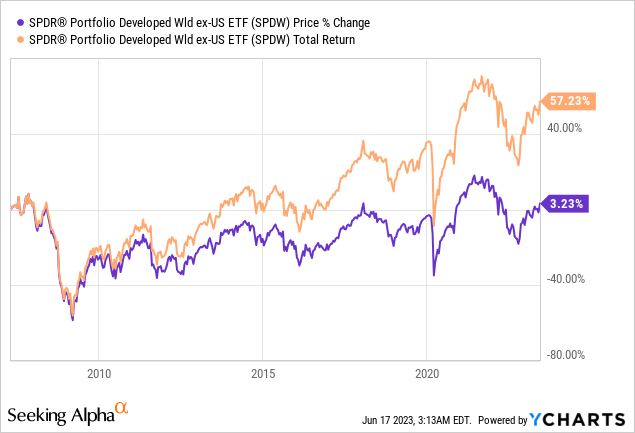
Fund Analysis
SPDW performed poorly in 2022
SPDW has not performed well last year due to tightening monetary policies by many central banks around the world. Between January 2022 and the trough in October 2022, the fund delivered a negative return of nearly 30%. Although the fund has rebounded since reaching the trough, it has still lost about 8% of its total value since the beginning of 2022. Looking forward, inflations remain high in many countries around the world. Therefore, rates will likely continue to remain elevated for a lengthy period. Therefore, any rebound may be short-lived and a recession may arrive very soon.
YCharts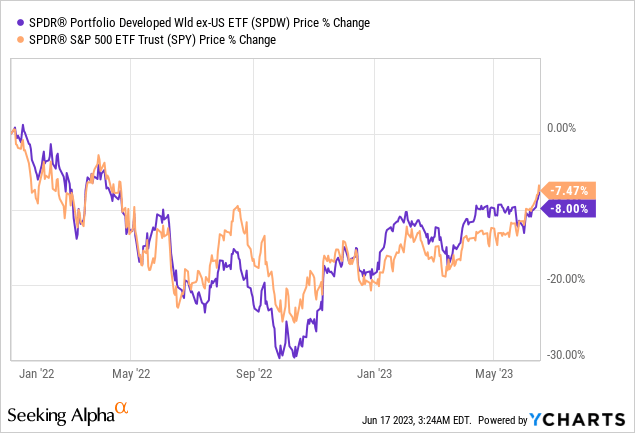
SPDW has an inferior growth profile than the S&P 500
Besides macroeconomic headwinds, let us look at SPDW's growth profile. As can be seen from the table below, financials, industrials and consumer discretionary sectors represent about 17.93%, 16.96%, and 11.89% of the portfolio respectively. These 3 sectors represent about 47% of SPDW's total portfolio. These sectors usually grow in line with the economy. Given SPDW's high exposure to these sectors, it is difficult to see the fund outperform the broader market. In contrast, SPDW's exposure to high growth sectors such as information technology sector is quite limited. As can be seen from the table below, information technology sector only represents about 10% of its total portfolio. This is very different than the S&P 500 index as information technology sector represents over 28% of the S&P 500 index. Therefore, SPDW's growth profile appears to be limited.
SPDR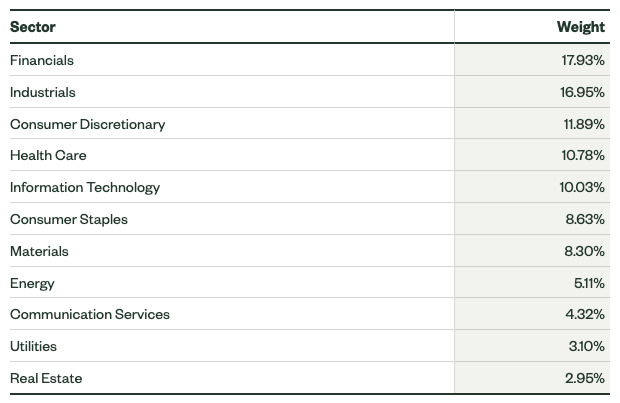
This low exposure is one of the main reasons why SPDW has underperformed the S&P 500 index in the long run. As can be seen from the chart below, SPDW has delivered a price return of only 3.23% since its inception in April 2007. Even when we include its dividend, its total return was only 57.2% in the past 16 years. This was much lower than the S&P 500 index. In fact, S&P 500 index delivered a total return of 311.3% during the same period.
YCharts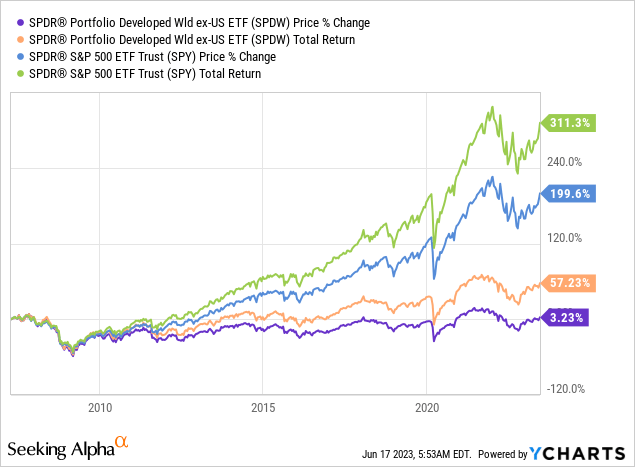
Top 10 holdings: Quite Diversified
Let us take a look at SPDW's top 10 holdings. As can be seen from the chart below, none of one stocks represent more than 1.5% of its total portfolio. In fact, its top 10 holdings only represent 11.22% of SPDW's total portfolio. Therefore, concentration risk to any individual stock is quite low. This is much lower than the S&P 500 as the S&P 500 index's top 10 holdings represent over 30% of its total weight.
SPDR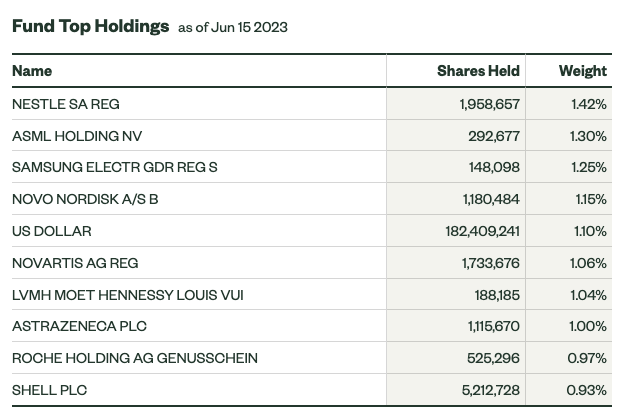
Buffett Indicator Analysis: It isn't cheap nor expensive
It is difficult for us to evaluate the valuation of every stock in SPDW's portfolio as the fund has a portfolio over 2,500 stocks. However, we can analyze each country's stock market valuation using an indicator that Warren Buffett often uses. It is called the Buffett Indicator, which is the ratio of market capitalization to GDP to evaluate whether the broader stock market is overvalued or not. If the market capitalization to GDP ratio is in the range of 75% to 90%, the valuations of equities are fair. However, if this ratio is above 120%, the stock market is quite overvalued. To better reflect the actual situation of each country, we think the denominator needs to include also the assets of each country's central banks as many countries around the world have implemented quantitative easing in the past few decades. Therefore, we have the modified equation as (total market capitalization)/(GDP + Assets).
Let us first look at SPDW's exposure to different markets. As can be seen from the table below, the top 10 countries represent about 85.1% of its total portfolio. Based on market capitalization to (GDP + Assets) ratio, Germany's stock markets appears to be quite cheap at only 34.04%. On the other hand, Canada, Switzerland and Sweden appears to be quite expensive with ratios of 123.03%, 111.06%, and 128.39% respectively. To help us gauge whether SPDW is expensive or not, we have also done our calculation of the weighted average ratio based on the portfolio weight of each country below. The weighted average market cap to (GDP+ Assets) ratio for these 10 countries is currently at 81.27%. This valuation appears to be quite fair. It is neither very cheap nor very expensive.
Top-10 Countries | Portfolio Weight (%) | Market Cap/(GDP+Assets) Ratio (%) |
Japan | 22.10 | 66.04 |
United Kingdom | 12.20 | 75.70 |
Canada | 9.50 | 123.03 |
France | 9.04 | 73.27 |
Switzerland | 7.71 | 111.06 |
Germany | 6.66 | 34.04 |
Australia | 6.42 | 82.09 |
South Korea | 4.89 | 79.79 |
Netherlands | 3.60 | 88.74 |
Sweden | 2.98 | 128.39 |
Total/Weighted Average | 85.10 | 81.27 |
Source: Created by author, SPDR, Gurufocus
Downside risk is quite high
As we have mentioned in the beginning of our article, we believe a recession is very likely due to elevated rates across many major central banks around the world. Therefore, it is important to evaluate SPDW's downside risk. As can be seen from the chart below, the fund has declined by about 60% during the Great Recession in 2008/2009. On the contrary, the S&P 500 index declined by about 55% during the same period, less than SPDW. The fund has also declined by about 30% during the outbreak of the pandemic. This was also much worse than the S&P 500's 25% decline.
YCharts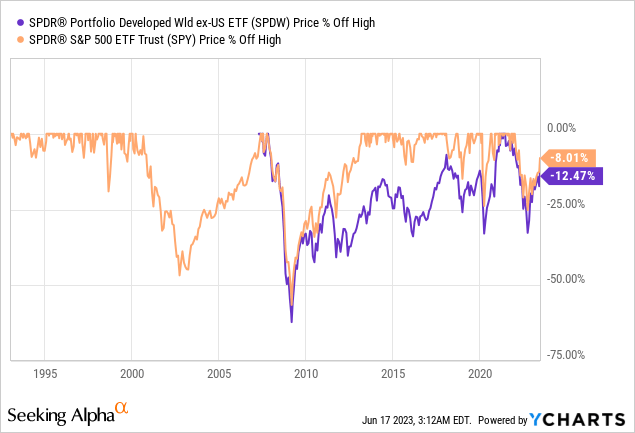
Investor Takeaway
In conclusion, SPDW appears to have an inferior growth profile than the S&P 500 index. This has great consequences as its total return over the long run trailed the S&P 500 significantly. It also underperformed the S&P 500 index during an economic recession and has higher downside risk. For investors with a long-term investment horizon, we do not think it is necessary to own this fund. Investors will be better to simply invest in funds that tracks the S&P 500 index.
This article was written by

Analyst’s Disclosure: I/we have no stock, option or similar derivative position in any of the companies mentioned, and no plans to initiate any such positions within the next 72 hours. I wrote this article myself, and it expresses my own opinions. I am not receiving compensation for it (other than from Seeking Alpha). I have no business relationship with any company whose stock is mentioned in this article.
This is not financial advice and that all financial investments carry risks. Investors are expected to seek financial advice from professionals before making any investment.
Seeking Alpha's Disclosure: Past performance is no guarantee of future results. No recommendation or advice is being given as to whether any investment is suitable for a particular investor. Any views or opinions expressed above may not reflect those of Seeking Alpha as a whole. Seeking Alpha is not a licensed securities dealer, broker or US investment adviser or investment bank. Our analysts are third party authors that include both professional investors and individual investors who may not be licensed or certified by any institute or regulatory body.