ServiceNow: Stock Is Fairly Valued

Summary
- ServiceNow maintains a stable market share in the ITSM market, with a forecasted 43.1% share in 2022, and has been a leader in the Gartner Magic Quadrant for nine consecutive years.
- ServiceNow's growth is more dependent on ARPU growth (16.7% yearly growth) due to successful cross-selling initiatives, while customer additions are expected to decline (-15.2% yearly decline) due to a focus on large enterprises.
- A new price target of $532 has been established, and we believe ServiceNow stock is fairly valued after its 47% year-to-date increase in 2023.
Sundry Photography
In our previous analysis of ServiceNow, Inc. (NYSE:NOW) in 2022, we identified that ServiceNow held a dominant position in the IT Services Management (ITSM) market, capturing an impressive 39.6% market share. However, we observed a concerning trend in its stock-based compensation, which grew at an average rate of 57.2%—surpassing its revenue growth of 43.1%. This discrepancy raised concerns about the potential erosion of shareholder value. Additionally, the company faced challenges with its relatively higher subscription price compared to competitors such as Microsoft, Atlassian, and LogMeIn. We believed this pricing disparity could impede the company's ability to attract smaller business clients. Consequently, we assigned a Sell rating to the company with a price target of $463.92, representing a downside of 16.5%.
Since our previous coverage, ServiceNow's stock price has indeed met our projected target, experiencing a decline of 19.7% within the year following our analysis until February 2023. However, the stock price has since rebounded and currently shows a remarkable increase of 32% since February 2023. Hence, in this updated analysis, we evaluate the company to revise our valuation and determine if our outlook has shifted. We focused on examining the stability of ServiceNow's ITSM market share by analyzing its changes over the past year. Additionally, we analyzed its customer additions and Average Revenue Per User (ARPU) to ascertain which of these factors has a more significant impact on growth. Lastly, we will employ our customer addition and ARPU forecasts to project future revenues, enabling us to gauge any notable alterations in the company's outlook since our previous analysis.
Stable ITSM Market Share
ServiceNow Segment Revenue ($'000s) | 2018 | 2019 | 2020 | 2021 | 2022 | 5-year Average | Our 2022 Forecast |
Subscription | 2,421,313 | 3,255,079 | 4,285,797 | 5,573,000 | 6,891,000 | 7,074,651 | |
Growth % (YoY) | 39.2% | 34.4% | 31.7% | 30.0% | 23.6% | 31.8% | 26.9% |
Professional services and other | 187,503 | 205,358 | 233,687 | 323,000 | 354,000 | 389,254 | |
Growth % (YoY) | 4.8% | 9.5% | 13.8% | 38.2% | 9.6% | 15.2% | 20.5% |
Total Revenue | 2,608,816 | 3,460,437 | 4,519,484 | 5,896,000 | 7,245,000 | 7,463,905 | |
Growth % (YoY) | 36.0% | 32.6% | 30.6% | 30.5% | 22.9% | 30.5% | 26.6% |
Source: Company Data, Khaveen Investments
Based on the table, the company’s total revenue grew by 22.9% in 2022, which was below its 5-year average of 30.5% and the 2021 growth of 30.5%. However, it was also fairly in line with our forecasted growth of 26.6%. This was due to the subscription segment (95.1% of 2022 revenue) growing at 23.6%, relatively in line with our previous forecast of 26.9%. Although management did not highlight the reasons for the slowdown in growth rate, according to Gartner, “global IT spending contracted 0.2% in 2022”, which we believe could have impacted the company’s growth. The Professional services and other segment grew at 9.6%, well below our forecasts of 20.5%, but it accounts for only 4.9% of total revenue.
Furthermore, we examined ServiceNow’s market share in the ITSM market. Although ServiceNow provides a wide range of services under its Now Platform, more than 50% of revenue in 2021 was from ITSM. According to Apps Run The World, ServiceNow was the market leader in the $7.7 bln ITSM market with a 40.1% share in 2021. This equates to $3.09 bln directly from ITSM, 52.4% of 2021 total revenue. This is relatively the same as ServiceNow’s ITSM market share from 2020 which was 39.5%. We forecasted the 2022 ITSM market size, by using Technavio’s 2022 market forecast CAGR of 14.3% on the $7.7 bln 2021 ITSM market size, which is $8.8 bln. Then, dividing 52.4% of ServiceNow’s 2022 revenue ($3.8 bln) by the forecasted 2022 ITSM market size ($8.8 bln), we derived the company’s 2022 ITSM market share to be 43.1%. Therefore, based on our forecasted 2022 (43.1%) and the past two years (2021:40.1%, 2020:39.5%) ITSM market share, we believe that the company has a stable market share in the ITSM market.
Gartner
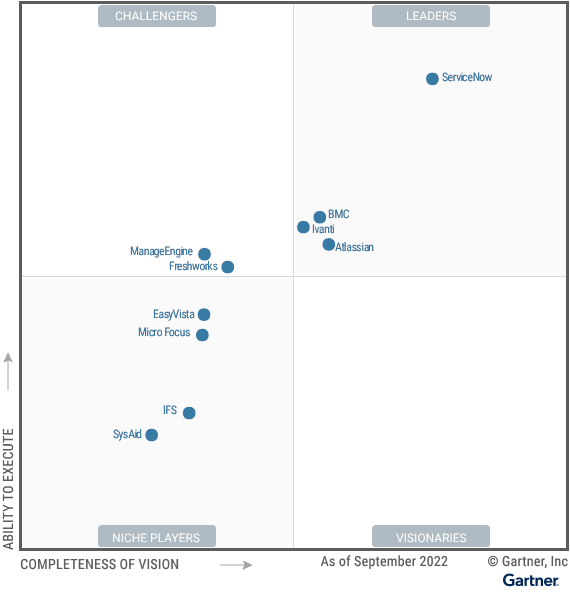
Moreover, based on Gartner’s Magic Quadrant, ServiceNow is in the Leaders Quadrant, and it is much better in terms of ability to execute and completeness of vision when compared to other companies offering ITSM services, even those within the leader’s quadrant. Additionally, this is the ninth straight year that ServiceNow is a leader in the Gartner Magic Quadrant. According to Gartner, ServiceNow’s position in the quadrant is due to it having new product enhancements while releasing “more native advanced features than any other vendor”, and it “maintains a number of advanced product differentiations”. This is reflected by looking at the table below, with ServiceNow having the joint highest capability score of 4.5 and the highest number of reviews (1,738) when compared to other ITSM companies in the Leader and Challenger quadrant, according to Gartner Peer Insights.
Product Capabilities | Capability Score (Out of 5) | No. of Reviews |
ServiceNow | 4.5 | 1,738 |
ManageEngine | 4.4 | 1,026 |
Atlassian (TEAM) | 4.5 | 846 |
Ivanti | 4.4 | 844 |
Freshworks (FRSH) | 4.5 | 732 |
BMC | 4.5 | 167 |
Source: Gartner, Khaveen Investments
Lastly, according to Gartner’s market momentum index, which is measured by Gartner inquiries and web and social media trends, “ServiceNow maintains a strong community of users, as prospective customers regularly cite awareness or experience through their peers”, which indicates it has a strong market presence. We believe its high market presence could be maintained as its sales and marketing team increased headcount by 25.5% in 2022.
ServiceNow’s dominance in the market is so strong that…
ITSM platform buyers frequently cite concerns that ServiceNow’s market dominance is hurting their ability to renegotiate their contracts or reduce their ServiceNow footprint without heavily impacting their current discounts - Gartner
This indicates it has strong bargaining power over buyers. In conclusion, we believe ServiceNow has a stable market share in the ITSM market when looking at our calculated market share of 43.1% in 2022, and Apps Run the World’s share of 40.1% and 39.5% in 2021 and 2020 respectively. We also identified it was a leader in the Gartner Magic Quadrant for nine straight years due to product differentiation and market presence in terms of social media and web search trends.
Growth More Dependent on ARPU Growth
ServiceNow Customer Additions & ARPU | 2018 | 2019 | 2020 | 2021 | 2022 | 5-year Average |
Customers | 5,400 | 6,200 | 6,900 | 7,400 | 7,700 | |
Growth % (YoY) | 22.7% | 14.8% | 11.3% | 7.2% | 4.1% | 12.0% |
Customer Additions | 1,000 | 800 | 700 | 500 | 300 | |
Growth % (YoY) | 25.0% | -20.0% | -12.5% | -28.6% | -40.0% | -15.2% |
ARPU ($ mln) | 0.483 | 0.558 | 0.655 | 0.797 | 0.941 | |
Growth % (YoY) | 10.8% | 15.5% | 17.4% | 21.6% | 18.1% | 16.7% |
Customers with > $1 mln ACV | 675 | 890 | 1,082 | 1,346 | 1,637 | |
Growth % (YoY) | 34.7% | 31.9% | 21.6% | 24.4% | 21.6% | 26.8% |
Revenue Growth % (YoY) | 36.0% | 32.6% | 30.6% | 30.5% | 22.9% | 30.5% |
Source: ServiceNow, Khaveen Investments
Based on the table, customer additions have constantly been decreasing for the past 5 years with 1000 additions in 2018 to only 300 additions in 2022. Whereas at the same time, the ARPU growth rate has constantly increased, starting with 10.8% in 2018 to 21.6% in 2021, with a slight dip in 2022 at 18.1%. Customer additions seemed to have had a bigger impact on growth in 2018 as customer growth (22.7%) was higher than ARPU growth (10.8%), but ever since then, ARPU growth has been greater.
When we covered ServiceNow previously, we identified that ServiceNow had the highest subscription price compared to all its closest competitors in the ITSM space with $30,000 for its standard package and $50,000 for its professional package.
Customers who fail to budget for the necessary add-ons and product upgrades often encounter unwelcome costs when looking to add additional platform capabilities such as custom apps, ITOM features, line-of-business applications, orchestration, AI/ML or additional workflow approvers – Gartner
Therefore, ServiceNow also has a high cost of add-ons of other services aside from ITSM. Moreover, according to Software Stack Investing, ServiceNow’s services revolve around the automation of repetitive work and are “primarily for internal business functions that have well-defined and repeatable logic”. Although the automation of repetitive work is helpful, we believe it is more applicable to large enterprises rather than smaller ones. Even if smaller businesses wanted to automate, they have the option to use cheaper alternatives to ServiceNow.
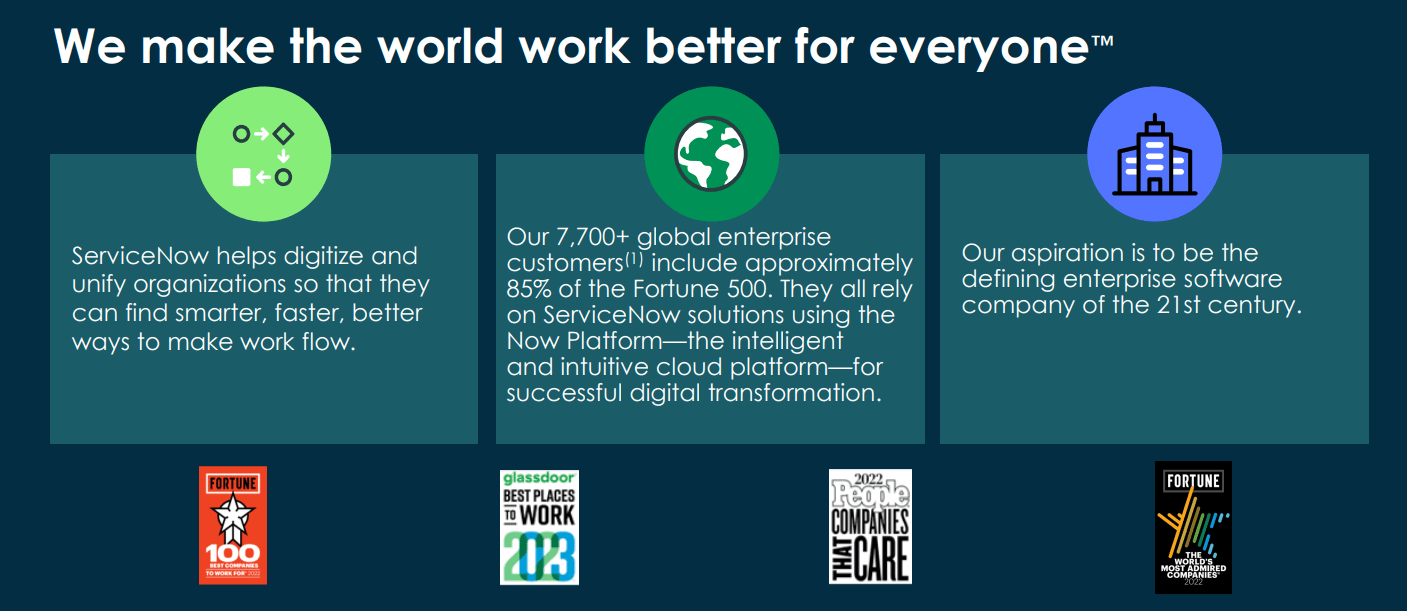
Additionally, according to ServiceNow (picture below), they serve 85% of companies in the Fortune 500. Therefore, we believe the reason for the constant decline in customer additions is the cheaper alternatives that smaller businesses have at their disposal to meet their workflow automation needs as well as ServiceNow already serving a high proportion of large enterprises, which leads to a decrease in the rate of customer additions over time.
ServiceNow
In terms of ARPU growth, we believe a key factor is the company’s cross-selling abilities.
ServiceNow effectively markets and sells across its broader platform and extended ITSM capabilities to its customers. Gartner regularly sees customers purchasing products beyond ITSM to extend their platform utilization in areas such as HR, CEC, GRC and broader ITOM - Gartner
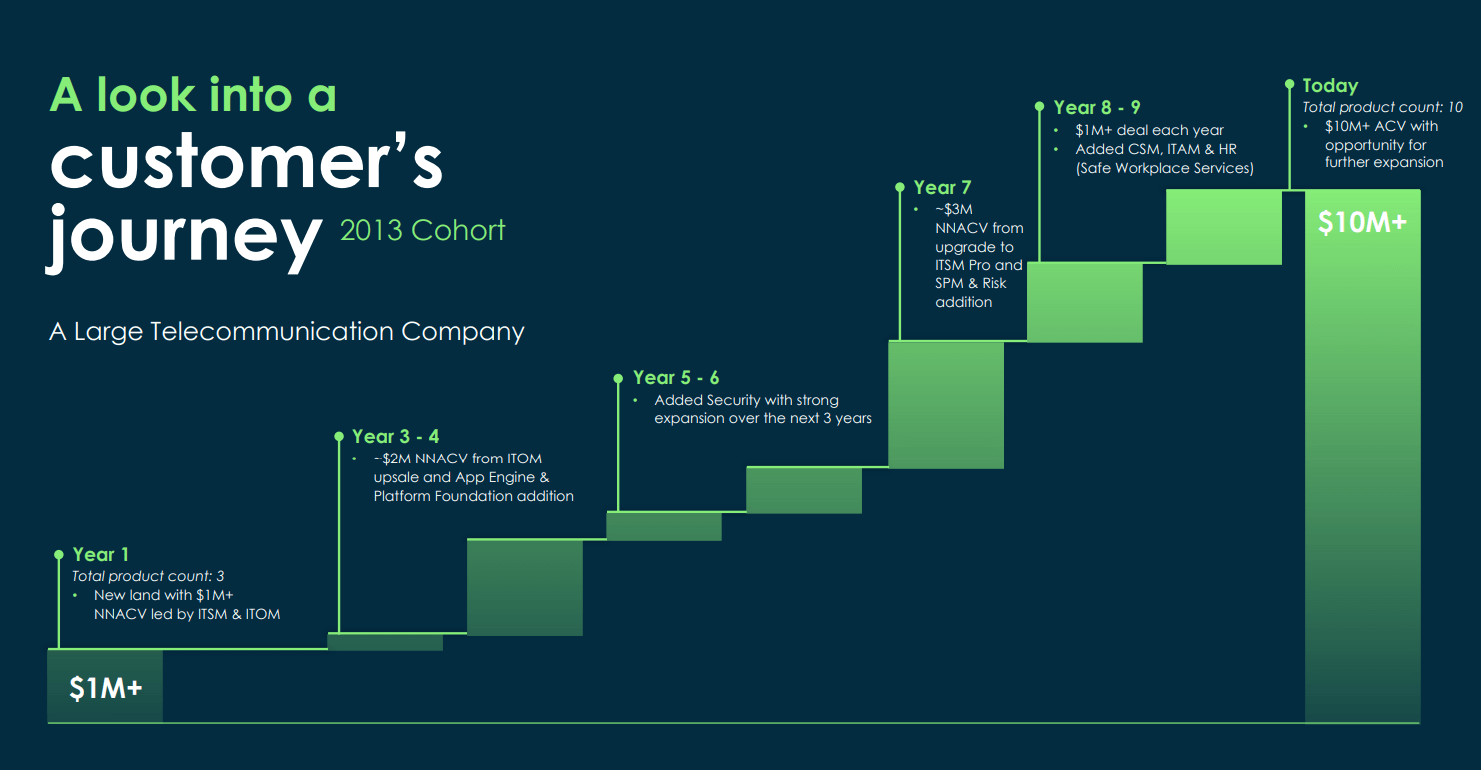
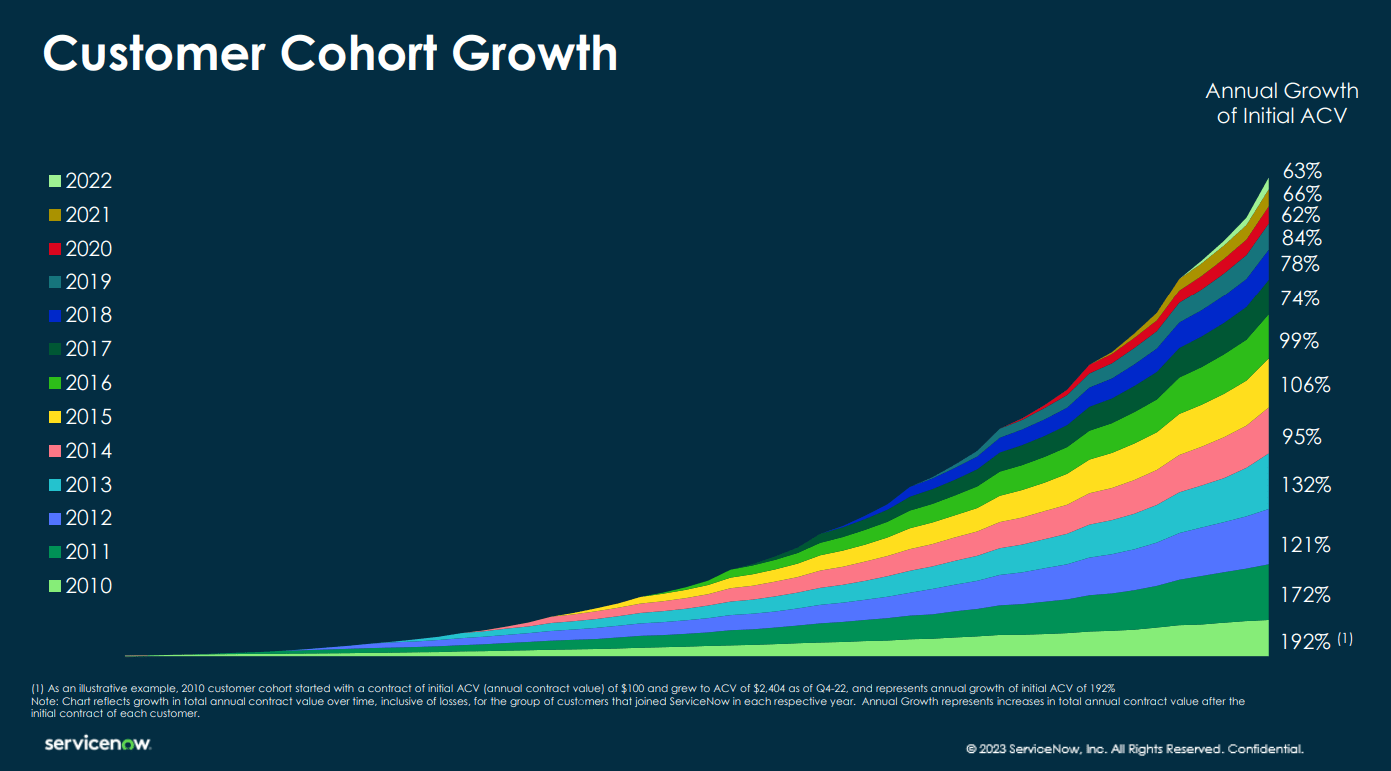
From the image below, we see how ServiceNow has been able to not only retain a customer but also increase the ACV over the years. The customer started by just purchasing 3 products in 2013 and an ACV of just over $1 mln. But as the years go by, the ACV goes up along with the number of products being subscribed to, leading to an ACV of over $10 mln and 10 products subscribed by 2022. We believe cross-selling is prevalent across the ServiceNow customer base as according to ServiceNow, customers with >$1mln Annual Contract Value ('ACV') are growing at a 5-year average rate of 26.8%, fairly in line with average revenue growth of 30.5%.
ServiceNow
In conclusion, we believe ServiceNow is more dependent on ARPU growth rather than customer additions for overall growth. Most SMB businesses have cheaper alternatives compared to ServiceNow for their workflow automation needs and the company already has 85% of Fortune 500 companies as customers. Thus, we believe this leads to a lower rate of customer additions over time. However, the company has had a steady increase in ARPU growth over the years due to cross-selling of their products that eventually increase the customer ACV.
Low Customer Additions as It Focuses on Large Enterprises
For this section, we updated our forecasts for ServiceNow revenues for the next five years by forecasting customer additions and ARPU as well as explaining the reasons behind our projections.
In terms of customer additions, ServiceNow’s strategy appears to be going for large companies that can spend lots of money on a wide range of services. According to ServiceNow, it already provides its services to 85% of companies in the Fortune 500. Additionally, ServiceNow’s President and Chief Operating Officer CJ Desai stated that the company is “…very focused on top of the house of the pyramid, as you call it, in terms of expansion strategy” in the Q12023 earnings briefing, referring to companies in the top of the pyramid as large enterprises. Since the company has an expansion strategy that focuses on adding large enterprises and already has a big proportion of large enterprises as its customers (85% of Fortune 500), we do not believe it will be able to add customers at the rate it was adding previously.
In terms of ARPU, we believe ARPU would continue to grow over time due to the various points stated above such as product differentiation and cross-selling which results in an increase of >$1 mln ACV customers. Moreover, according to ServiceNow (picture below), the longer the customer stays within the company, the higher their annual ACV growth compared to their initial ACV. Therefore, with consistently increasing ACV per customer, we expect ARPU to show a steady increase over the next five years.
ServiceNow
Thus, taking into account our reasoning for both customer additions and ARPU, our forecasts are as below. For the company’s total customers, we used the 5-year average growth of customer additions (-15.2%) as the growth rate for the next five years which represents an average customer addition of 188 per year. For its ARPU growth, we based our assumption on its 3-year average of 19% as a conservative estimate as we see the company maintaining its growth with its cross-selling abilities. In total, we forecasted its growth over the next 5 years at an average of 21.8%. Our 2023 growth forecast of 23% is also in line with management guidance of 23% YoY growth for its subscription revenue based on its latest earnings briefing.
ServiceNow Revenue Forecasts | 2023F | 2024F | 2025F | 2026F | 2027F |
Customers | 7,954 | 8,170 | 8,353 | 8,508 | 8,639 |
Growth % (YoY) | 3.3% | 2.7% | 2.2% | 1.9% | 1.5% |
Customer Additions | 254 | 216 | 183 | 155 | 131 |
Growth % (YoY) | -15.2% | -15.2% | -15.2% | -15.2% | -15.2% |
ARPU ($ mln) | 1.120 | 1.333 | 1.587 | 1.889 | 2.248 |
Growth % (YoY) | 19.0% | 19.0% | 19.0% | 19.0% | 19.0% |
Total Revenue ($ mln) | 8,909 | 10,891 | 13,254 | 16,069 | 19,423 |
Growth % (YoY) | 23.0% | 22.3% | 21.7% | 21.2% | 20.9% |
Source: Company Data, Khaveen Investments
Risk: Low Revenue Share in Asia Pacific
ServiceNow, Khaveen Investments
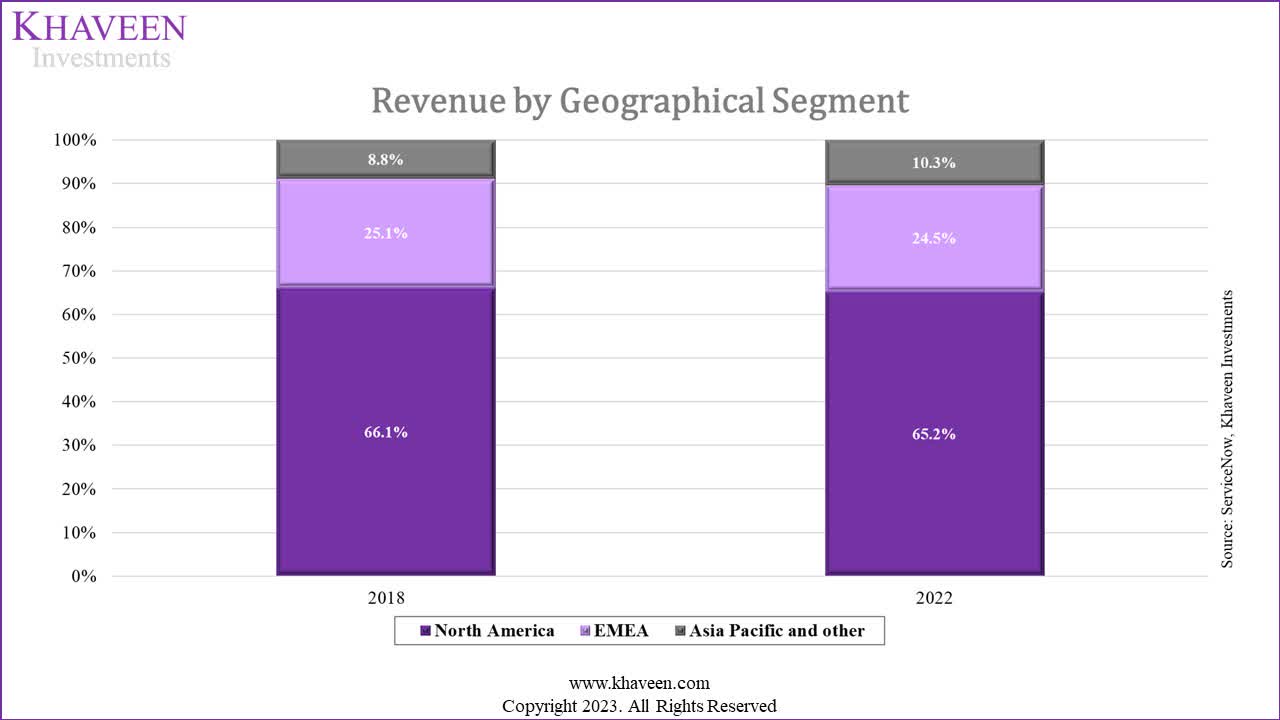
ServiceNow’s revenue share in the Asia Pacific and other region in 2022 was 10.3%, lower than its revenue share in EMEA (24.5%) and North America (65.2%). The share in Asia Pacific and Other has only increased by 1.5% from 8.8% in 2018. According to Mordor Intelligence, the fastest-growing ITSM market over the next five years is Asia Pacific. Therefore, we believe the limited exposure (10.3%) to the Asia Pacific region is negative to its revenue growth outlook.
Verdict
Khaveen Investments
Seeking Alpha, Khaveen Investments
In summary, we believe ServiceNow has maintained a stable market share position in the ITSM market, with our forecasted 2022 market share of 43.1% comparing favorably to Apps Run the World's 2021 and 2020 shares of 40.1% and 39.5%, respectively. Furthermore, ServiceNow's consistent leadership in the Gartner Magic Quadrant for nine consecutive years speaks to its product differentiation and strong market presence.
Regarding customer additions and ARPU growth, we have observed a declining trend in customer additions, while ARPU has experienced steady growth over the past five years. We attribute the decline in customer additions to the high subscription prices, which may be less affordable for smaller firms, as well as the company's substantial existing customer base of large enterprises (representing 85% of Fortune 500 companies). The growth in ARPU can be attributed to successful cross-selling initiatives, evidenced by a 26.8% average annual growth in customers with an ACV exceeding $1 mln. Looking ahead, we forecast a further decline in customer additions (-15.2% yearly decline) due to ServiceNow's strategic focus on expanding its presence within large enterprises. Conversely, we anticipate ARPU to continue growing (16.7% yearly growth) due to its cross-selling efforts and an increase in ACV as customers extend their tenure with the company.
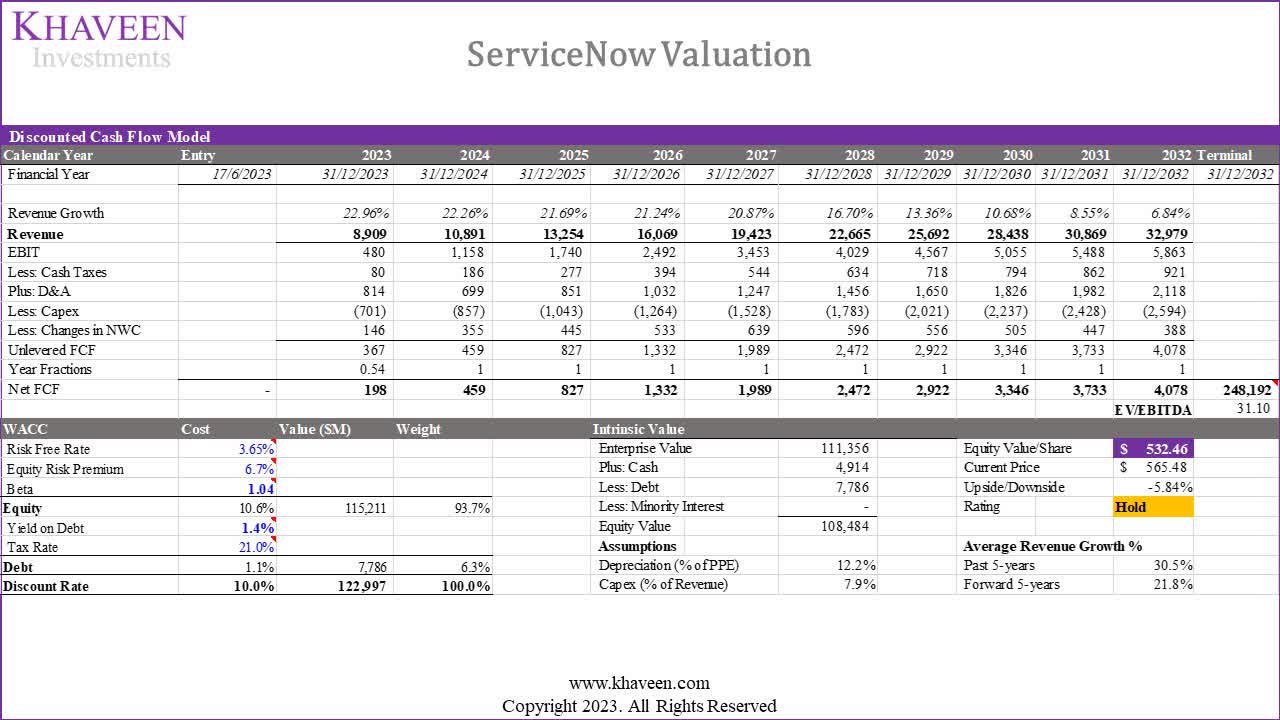
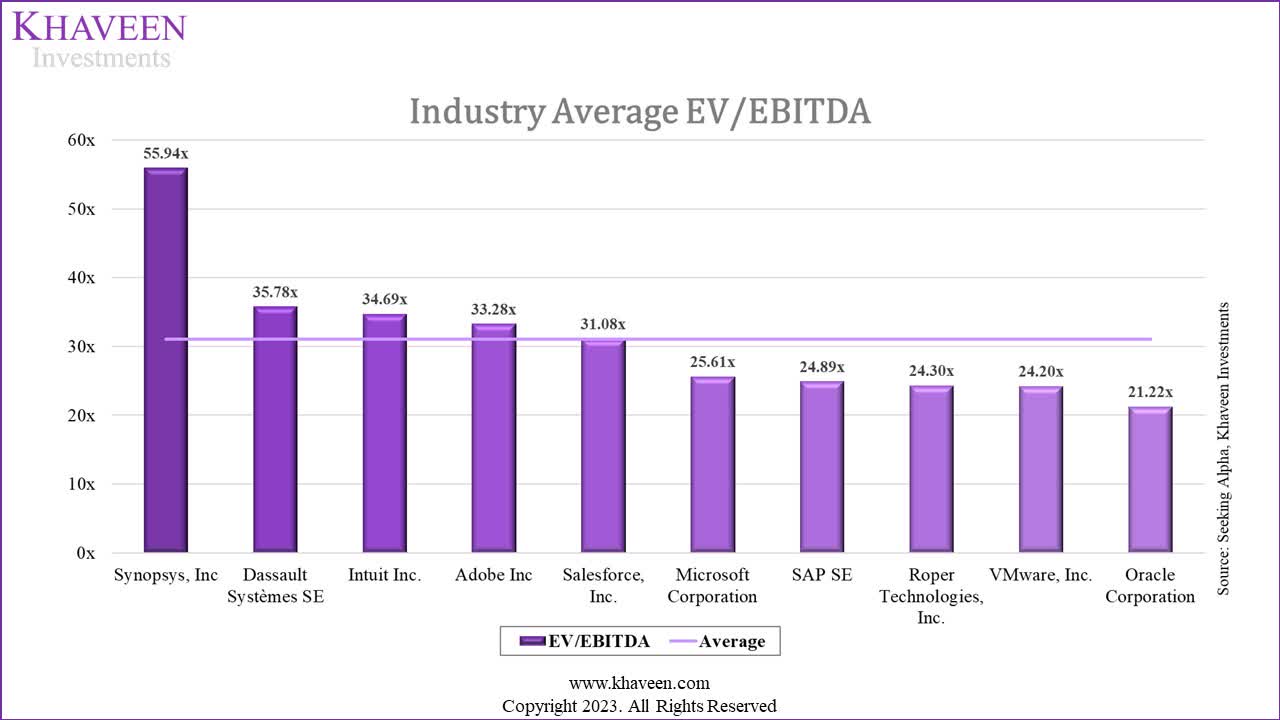
For our valuation of ServiceNow, we employed a DCF approach based on our forecasted revenues. To determine the terminal value, we considered the EV/EBITDA ratios of 10 out of the 13 highest-revenue software companies, excluding ServiceNow, Palo Alto Networks (PANW), and Workday (WDAY) due to their anomalous EV/EBITDA values of 131.43x, 200.31x, and 314.79x, respectively. The ten companies used for comparison included Microsoft (MSFT), Oracle (ORCL), SAP (SAP), Salesforce (CRM), Intuit (INTU), Adobe (ADBE), VMware (VMW), Dassault Systèmes (OTCPK:DASTY), Roper Technologies (ROP), and Synopsys (SNPS). As a result, we derived an EV/EBITDA value of 31.1x, which is lower than the previous coverage's EV/EBITDA value of 54.61x. In conclusion, we have established a new price target of $532.46 with a downside of 6%. This revised target is higher than our previous target of $463.92, reflecting our forecasted 5-year revenue growth of 21.8%, compared to the previous estimate of 18.2%. With a higher price target, we now rate the company as a Hold.
This article was written by

Analyst’s Disclosure: I/we have a beneficial long position in the shares of NOW either through stock ownership, options, or other derivatives. I wrote this article myself, and it expresses my own opinions. I am not receiving compensation for it (other than from Seeking Alpha). I have no business relationship with any company whose stock is mentioned in this article.
No information in this publication is intended as investment, tax, accounting, or legal advice, or as an offer/solicitation to sell or buy. Material provided in this publication is for educational purposes only and was prepared from sources and data believed to be reliable, but we do not guarantee its accuracy or completeness.
Seeking Alpha's Disclosure: Past performance is no guarantee of future results. No recommendation or advice is being given as to whether any investment is suitable for a particular investor. Any views or opinions expressed above may not reflect those of Seeking Alpha as a whole. Seeking Alpha is not a licensed securities dealer, broker or US investment adviser or investment bank. Our analysts are third party authors that include both professional investors and individual investors who may not be licensed or certified by any institute or regulatory body.