Toll Brothers: No Margin Of Safety Even With Uptick In Long-Term Annual Average Housing Starts

Summary
- Toll Brothers is a cyclical company. Any analysis and valuation should be based on a cyclical lens. There is a strong correlation between TOL’s revenue and the US Housing Starts.
- Scenario 1 (no change in long-term annual Housing Starts) shows no margin of safety, while Scenario 2 (increase in long-term annual Housing Starts) does not meet the 30% target margin of safety.
- TOL is financially sound but not a growth company; it is currently fully priced from a conservative perspective.
Scott Olson
Investment Thesis
Toll Brothers (NYSE:TOL) is a cyclical company. During the latest Housing Starts cycle from 2005 to 2022 (peak-to-peak), its revenue grew at 3 % CAGR. But this was due to a combination of 1.1 % CAGR in Deliveries while unit selling price grew at 1.8 % CAGR. Part of the growth was due to the 2014 acquisition.
Over the past 70 years, there was no growth in the long-term annual average Housing Starts. However, there was growth in the Housing Price Index. I would not consider the sector as a growth one.
A valuation of TOL over the cycle on such a basis showed that there is no margin of safety. Even if you assumed that there would be a 1/3 increase in the long-term annual average Housing Starts, the margin of safety is not sufficient.
Thrust of my analysis
In my article “Home Builders' Base Rates: A Reference For Better Fundamental Analysis”, I identified the top 9 listed home builders. These are companies with readily available financial data from 2005 to 2022 – the latest peak-to-peak Housing Starts cycle. TOL is one of the companies on that list.
I had previously determined the intrinsic value of Lennar based on its performance over the 2005 to 2022 cycle. Refer to: “Lennar – the market is pricing a change in the long-term Housing Starts.”
In this article, I will analyse and value TOL based on the same approach. This is the second article in my series to determine the cyclical value of the top 9 home builders.
To recap:
TOL is a cyclical company and as such any analysis and valuation should be based on its performance over the cycle.
While nobody disputed the cyclical nature of the sector, we have different views on the long-term annual Housing Starts. As such I will value TOL based on two Scenarios:
- Scenario 1 – no change in the long-term annual Housing Starts of 1.5 million units.
- Scenario 2 – an increase in the long-term annual Housing Starts to 2.0 million units.
I also considered 2 approaches to determining the cyclical Gross Profits:
- Derived based on the equation for Gross Profits = Deliveries X Selling Price X Cyclical Gross Profit Margins.
- Based on the past 2 years’ actual average Gross Profits. This was because the average annual Housing Starts over the past 2 years is around 1.5 million units. So it is logical that it can represent the cyclical value.
Based on the above, I found that there is no margin of safety based on Scenario 1. But while there is some margin of safety under Scenario 2, it did not meet my 30 % target.
Cyclical sector
The home building sector is cyclical. The revenue of the sector is pegged to the US Housing Start. As such, I use the Housing Starts to determine the key characteristics of the cycle.
Looking at Chart 1, I would draw the following conclusions:
- Over the past 70 years, there is no growth in the long-term annual average Housing Starts. I took this long-term average as 1.5 million units per year.
- In the past 2 years, Housing Starts seem to be at the long-term annual average level.
- Over the past 70 years, there have been 4 occasions when the annual Housing Starts exceeded 2 million units.
- I am not sure whether the current drop in Housing Starts is merely a temporary pullback from an uptrend, or the start of its downtrend leg.
Chart 1: US Housing Starts (FRED)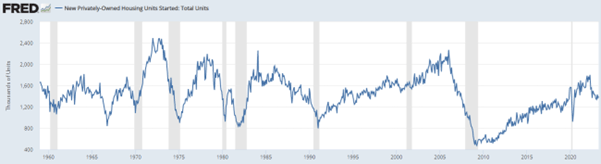
While there was no growth in the long-term annual average Housing Starts, there was long-term price growth as illustrated in Chart 2. The revenue growth for the home building sector over the past few years was the result of both volume growth as well as price growth.
Chart 2: Housing Price Index (Trading Economics)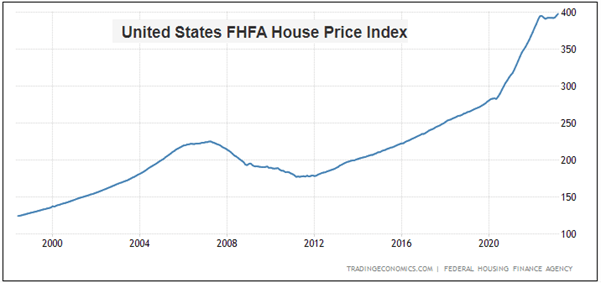
Valuation of cyclical companies
Damodaran opined that the performance of cyclical companies is dependent on where they are in the cycle. This can over shadows strategies and even management capabilities. Extrapolating the performance based on the current earnings and cash flows can lead to misleading valuations.
To overcome this extrapolation challenge, we have to normalize the performance over the cycle. Damodaran suggested 2 ways to do this:
- Take the average values over the cycle.
- Take the current revenue and determine the earnings by multiplying it with the normalized margins.
In the case of TOL, I will use both methods to determine the cyclical performance.
2 views on long-term annual average Housing Starts
I have assumed that there is no change to the long-term annual average Housing Starts. My view is that 70 years of data cannot be wrong.
But there are many Seeking Alpha readers who believe that there is some fundamental increase to this long-term annual average Housing Starts.
TOL seems to share this "increased" view based on the following extracted from its 2022 Annual Report:
“…the chronic undersupply of new homes…Housing starts have not kept up with population and household growth in the U.S. for at least the last 15 years, and this lack of supply will continue to support the market for new homes.
Demographic trends are also in our favor, as the two largest demographic groups in America - Millennials and Baby Boomers - are both on the move. Millennials…have demonstrated that home ownership remains a strong foundation of the American dream…Baby Boomers, many with significant savings and substantial equity in their existing homes, are also a strong driver of new home demand…”
To be fair to TOL, they did not specifically state that there will be an increase in the long-term annual average Housing Starts. They merely stated that they expect continued and favorable demand. This could just mean that the Housing Starts in the next few years could go beyond 2.0 million units per year like what had happened previously.
I don’t have a crystal ball on how the future will turn out. As such I have chosen to present valuations based on both views. I will leave it up to you to decide which is more likely.
Performance
I look at 3 metrics to get an overview of the performance over the cycle – revenue, profit after tax (PAT), and gross profitability (gross profits/total assets).
Chart 3 shows the performance of TOL over the 2005 to 2022 cycle. During this period there was a 0.75 correlation between TOL revenue and the Housing Starts. As illustrated in my base rate article, if you looked from 2005 to 2016, we have a higher correlation at 0.86. This is because from 2016 to 2022 there was a significant increase in the selling prices.
Chart 3: Performance Index (Author)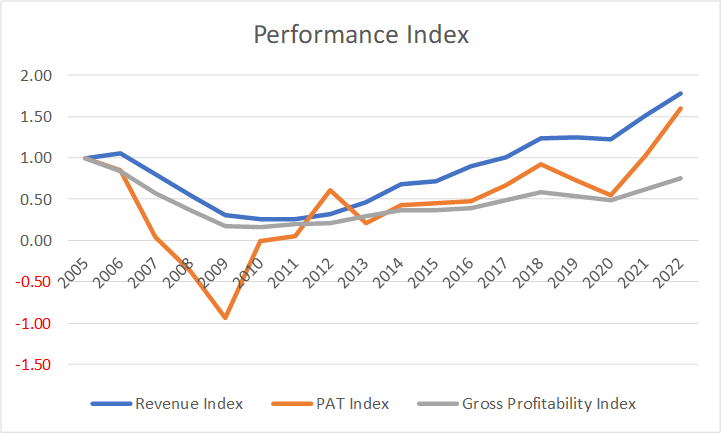
Note to Chart 3: I converted the various metrics into indices to enable them to be plotted on the same chart. The index for a particular year is the value for the year divided by the respective 2005 value.
This is supported by the 0.89 correlation between the US Housing Starts and TOL’s Deliveries from 2005 to 2022. The conclusion is that TOL is a cyclical company whose performance is tied to the US Housing Start. This is very similar to that for Lennar.
Note the following performances:
- During the trough part of the cycle, TOL incurred losses.
- Throughout the cycle, the gross profitability was below that in 2005.
According to Professor Novy-Marx, gross profitability has the same power as PBV in predicting cross-section returns. Given the underperformance of this metric over the past 18 years, you should take any claim of success with a pinch of salt.
From 2005/06 to 2021/22, revenue grew at about 3.2 % CAGR. But this was due to a combination of volume growth and price growth as shown in Chart 4.
I estimated that during this period Deliveries grew at 1.1 % CAGR while unit selling price grew at 1.8 % CAGR. Are these signs of a growth company?
You can see that over the past 2 years, the high revenue growth was due to both growth in Deliveries and selling prices.
Chart 4: : Revenue, Deliveries, and Selling Price (Author)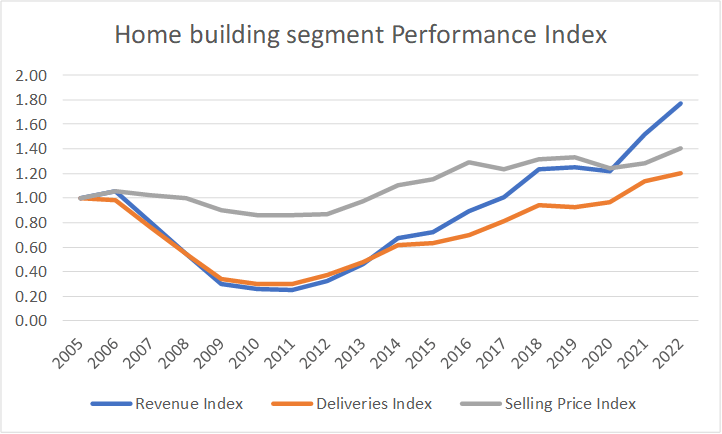
Note that there was a jump in Deliveries and revenue in 2014. This was due to the USD 1.49 billion acquisition of the home-building business of Shapell Industries. The current Deliveries is only about 20% higher than that of 2005. It makes you wonder what the picture would be if TOL did not undertake the 2014 acquisition.
What does all this mean? TOL is not a growth company in a no-growth (volume terms) cyclical sector. Note that this was the same conclusion I reached for Lennar.
Financial position
I would rate TOL as financially strong based on the following:
- As of the end of Dec 2022, it had USD 1.3 billion in cash. This is about 11 % of its total assets.
- It had a Debt Equity ratio of 0.58 at the end of 2022. My base rate was a mean Debt Equity ratio of 0.41 for 2022.
- Over the past 18 years, it generated an average of USD 363 million per year in Cash Flow from Operations compared to its average PAT of USD 372 million per year. The mean Cash Flow from Operations over the same period for my base rate was USD 328 million.
- It managed to generate positive Cash Flow from Operations for 14 out of the 18 years. Excluding Lennar, there were 8 home builders in my base rate panel companies. Of these, only 2 did better than TOL on this measure.
I would like cyclical companies to be financially sound going into the downtrend leg of a cycle as I do not know how severe the downtrend will be. TOL fits the bill.
Valuation
I valued TOL based on the single-stage Free Cash Flow to the Firm (FCFF) model.
I focussed on 2 Scenarios:
- Scenario 1. I assumed that 2021/22 represented the long-term annual average Housing Starts of 1.5 million units.
- Scenario 2. This assumed that the long-term annual average Housing Starts was increased to 2.0 million units.
For both Scenarios, I assumed that growth was 3.0 %. This was 2005 to 2022 combined growth rate for Deliveries and unit selling prices.
For Scenario 1, I had 2 sub-scenarios:
- Scenario 1a. This was based on deriving the gross profits over the cycle from the equation Gross Profit = Deliveries X Selling Price X (2005 to 2022 average Gross Profit Margins).
- Scenario 1b. The gross profits over the cycle = 2021 to 2022 average gross profits. This is in line with my earlier analysis that the past 2 years’ average Housing Starts was at the long-term level. In other words, it represented the cyclical performance.
Table 1 summarized the results. You can see that there is no margin of safety under Scenario 1a. I would not consider the margin of safety under Scenario 1b significant.
But at first glance, there appears to be a 43% margin of safety under Scenario 2. But this is not a realistic picture as it assumed that we are now at the 2.0 million units Housing Starts level. If we assumed that it will another 5 years to reach the 2.0 million units long-term annual average Housing Starts, the margin of safety is reduced to 18 %.
The conclusion is that there is no margin of safety under Scenario 1 and not enough margin of safety under Scenario 2.
Table 1: Summary of valuation (Author)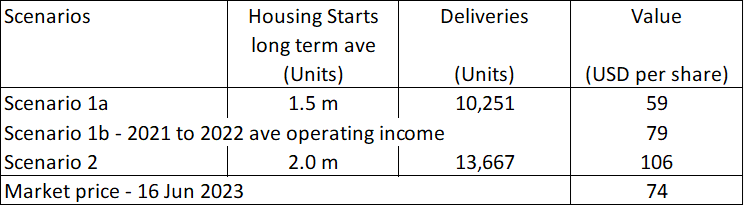
An alternative way to compute the average gross profit margins
For TOL, for the normalized gross profit margins, I took the average gross profit margins for each year from 2005 to 2022.
But in my earlier Lennar article, I had computed the normalized gross profit margins = (sum of 2005 to 2022 gross profits) divided by the (sum of the 2005 to 2022 revenue).
This was different from what I did for TOL above.
If I adopted the Lennar approach, the value of TOL would be USD 66 per share compared to USD 59 per share shown in Table 1. Changing how the average gross profit margins were computed did not change the conclusion.
Valuation model
I valued TOL based on the single-stage Free Cash Flow to the Firm (FCFF) model.
Value of the operating assets of the firm = FCFF X (1 + g) / (WACC – g).
Where:
FCFF = EBIT X (1 – t) X (1 – Reinvestment rate).
EBIT = Gross profits – Selling, Admin, and Selling or SGA expenses - Write offs.
Gross profits = Revenue X Gross Profit Margins. The calculation for Scenarios 1a and 2 is different from that for Scenario 1b.
Revenue = Deliveries X Selling Price.
Deliveries would be pegged to the Scenarios.
- For Scenario 1, it would be the 2021 to 2022 average Deliveries. I assumed that these 2 years represented the long-term annual average Housing Starts of 1.5 million units.
- For Scenario 2, it would be 2020 to 2022 average Deliveries X (2/1.5). This is to scale it to 2 million units annual average Housing Starts.
Gross Profit Margins = cyclical values.
t = tax rate based on the past 3 years’ average.
g = 3.0 % based on the combined growth rates of Deliveries and unit selling prices. This is the fundamental growth rate from the equation Growth = Return X Reinvestment rate.
Return = EBIT(1-t)/TCE.
TCE = Total Capital Employed = Total Equity + Debt – Cash – Investments in non-controlled entities.
Reinvestment rate = Growth / Return.
WACC = weighted average cost of capital derived from the first page of a Google search for the term “TOL WACC” as summarized in Table 2.
Value of Equity = Value of operating assets of the firm + Cash + Investments in non-controlling entities – Debt – Minority interests.
Table 2: WACC (Various)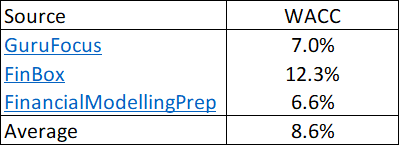
Sample calculation
Table 3 shows a sample calculation for the intrinsic value.
Table 3: Computing the intrinsic value (Author)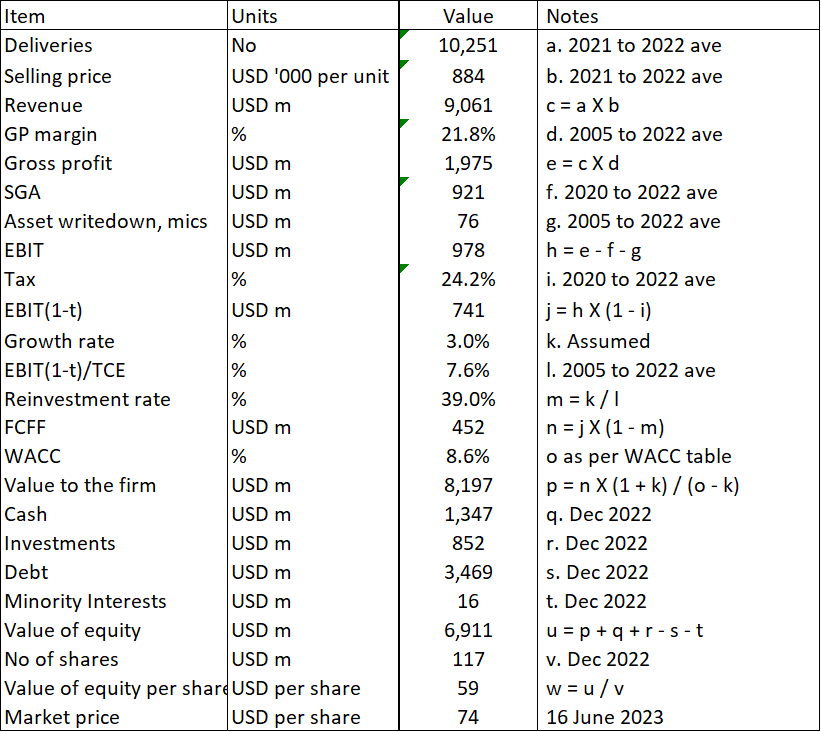
Note to Table 3: Over the past 18 years, TOL incurred some asset write-downs and other one-off charges. I included the average in my valuation.
Time to reach normalcy
Scenario 2 does not reflect the actual situation. It assumed that we are now at the 2 million units annual average Housing Starts. If you look at Chart 1, we are not there yet.
According to Damodaran, if time is needed to reach the normalized performance, we could take the following approach:
- Assume normalization in the long term.
- Allow the earnings to follow the current pattern in the short term and use the growth rate as the mechanism to bring it back to normalcy.
I used a 2 stage FCFF model to value TOL on such a basis. I assumed that it would take another 5 years to reach the 2.0 million annual Housing Starts. Refer to Table 4.
On such a basis I found that the intrinsic value was reduced to USD 88 per share. The margin of safety had reduced from 43 % to 18 %.
I will admit that this reduction will depend on the growth assumptions to reach the revenue associated with the 2.0 million units Housing Starts. Nevertheless, the point is that there will be a reduction.
Table 4: Two-stage valuation model (Author)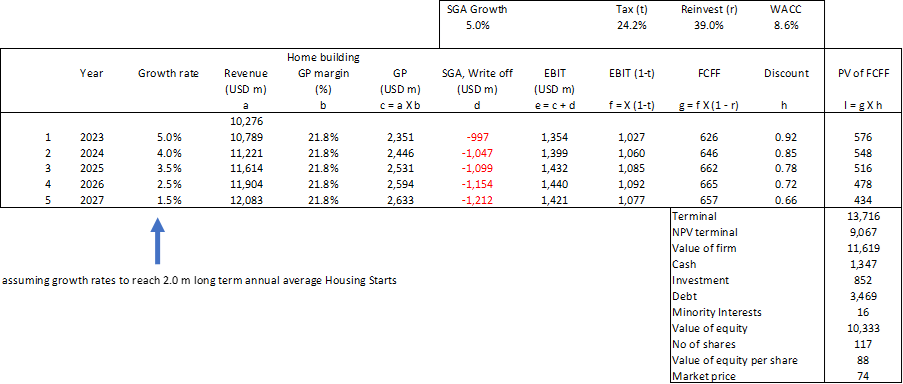
Notes to Table 4.
a) Terminal value = Value to the firm under Scenario 2.
b) NPV of terminal = (Terminal value) X (Year 5 Discount rate).
c) Value of firm = (PV of FCFF for Years 1 to 5) plus (NPV of terminal).
d) I have assumed that the SGA will grow at 5% annually.
e) The rest of the parameters eg tax rates, Reinvestment rates, and WACC were assumed to be the same as those for Scenario 2.
Risks and limitations
The crux of my valuation is that TOL is a cyclical company. Even when I used the past 2 years values, it was to represent the cyclical performance.
At the same time, you should consider the following when looking at my valuation:
- Low WACC.
- Growth.
- Ignoring non-home building business.
Part of the reason for the 8.6 % WACC was because of the current high risk-free rate and equity risk premium. This is due to the uncertainty associated with the high inflation rates, possible recession, and the Ukraine invasion. If you are going to look at the value over the cycle, I would argue that you should also consider the values over the cycle. This would mean lower risk-free rate, equity risk premium and possibly lower Beta. In other words, a lower WACC. This meant that my valuation is conservative.
Secondly, in my valuation, I assumed a 3.0 % growth rate. I had shown that TOL is not a growth company. Furthermore, if you accept that there is no long-term growth in the annual Housing Starts, you would conclude that this is a no-growth sector. Given these, it may be more appropriate to value TOL based on the Earnings Power Value (EPV).
It is simple enough to set the growth rate = 0 in my valuation model. When I did this, I obtained the following EPV.
- Scenario 1a = USD 63 per share.
- Scenario 2 = USD 112 per share.
You will notice that the EPV is higher than the values incorporating growth as shown in Table 1. The reason for this is that the Return achieved by TOL was lower than the cost of capital.
For example, you can see from item l in Table 2 that the 7.6 % return as measured by EBIT(1-t)/TCE was less than the 8.6 % WACC.
You should not be surprised by these EPV results. According to Damodaran, growth in cases where the returns are less than the cost of funds will destroy value. All the more reason to require at least a 30% margin of safety for TOL!
Finally, in my analysis and valuation, I just consider the home-building business. But TOL has also a non-home building business. Table 5 shows the 2022 situation.
Table 5: 2022 Business contributions (Author)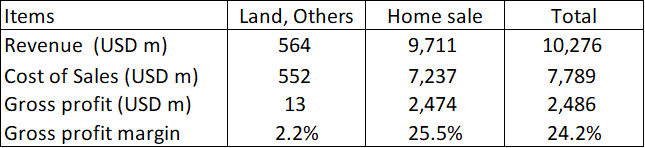
You can see that the non-home sales revenue and gross profit margins are a small component of the total. But I used the home sales to represent the total revenue. I thus under-accounted for the revenue in my valuation model. This meant that my gross profits were conservative. In other words, a conservative valuation.
Note that the Land, Others gross profit was very small relative to the total gross profits. As such, ignoring this gross profit and gross profit margins would not have much impact on the valuation.
Taking all the above into consideration, I would be worried if there is not at least a 30% margin of safety.
Conclusion
While I would rate TOL as financially sound, I would not consider it as a growth one. Given this and that it is a cyclical company, any analysis, and valuation of TOL should be based on its performance over the cycle.
I assumed that the cycle is represented by the 2005 to 2022 performance. This is pegging it to the latest peak-to-peak Housing Starts cycle.
My valuation of TOL over the cycle showed that there is no margin of safety. The crux of my valuation is that there is no growth in the long-term annual Housing Starts.
Even if you assumed that there is a 1/3 increase in the long-term annual Housing Starts, my analysis showed that there is not enough margin of safety since it would need time to reach this increased level.
From a conservative perspective, I would rate TOL stock as fully priced currently.
This article was written by

Analyst’s Disclosure: I/we have no stock, option or similar derivative position in any of the companies mentioned, and no plans to initiate any such positions within the next 72 hours. I wrote this article myself, and it expresses my own opinions. I am not receiving compensation for it (other than from Seeking Alpha). I have no business relationship with any company whose stock is mentioned in this article.
Seeking Alpha's Disclosure: Past performance is no guarantee of future results. No recommendation or advice is being given as to whether any investment is suitable for a particular investor. Any views or opinions expressed above may not reflect those of Seeking Alpha as a whole. Seeking Alpha is not a licensed securities dealer, broker or US investment adviser or investment bank. Our analysts are third party authors that include both professional investors and individual investors who may not be licensed or certified by any institute or regulatory body.