Heritage Commerce: Over 6% Dividend Yield But Risks Are Also Elevated

Summary
- Subdued loan growth and a stable margin will help earnings continue to trend upward this year.
- HTBK’s risk level is elevated due to its location, uninsured deposits, and office exposure.
- HTBK is offering a high dividend yield of 6.2%. There are currently no threats to the dividend payout.
- The December 2023 target price suggests a high upside from the current market price.

Michael Vi/iStock Editorial via Getty Images
Earnings of Heritage Commerce Corp (NASDAQ:HTBK) will most probably continue on an uptrend this year thanks to decent loan growth. I’m expecting the company to report earnings of $1.25 per share for 2023, up 14.8% year-over-year. Compared to my last report on the company, I haven’t changed my earnings estimate much. The company is offering an attractive dividend yield and a high price upside. As a result, I’m maintaining a buy rating on Heritage Commerce Corp.
Margin to Fare Better in the Year Ahead Compared to the First Quarter
Heritage Commerce’s net interest margin dipped by a basis point during the first quarter after expanding by more than 30 basis points in each of the last three quarters of 2022. This sudden trend reversal is attributable to the significant deterioration of the funding mix. Heritage took on $300 million worth of short-term debt during the quarter which pushed up interest expenses due to their high cost. As mentioned in the annual shareholder presentation, Heritage repaid these borrowings on April 20, 2023; therefore, some of the pressure on the margin will ease in the second quarter.
The margin will also benefit from past Fed funds rate hikes as it is somewhat rate sensitive. The results of the management’s rate-sensitivity analysis given in the 10-Q filing show that a 200-basis points hike in rates could increase the net interest income by 3.5% over twelve months.
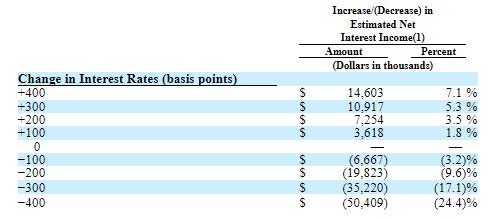
1Q 2023 10-Q Filing
Considering these factors, I’m expecting the margin to remain mostly stable in the last nine months of 2023.
Loan Growth to Improve from the First Quarter’s Level but Remain Below the Historical Average
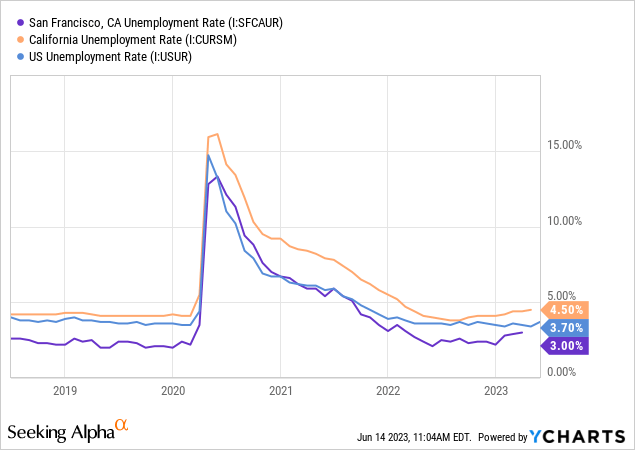
Heritage’s loan portfolio disappointingly contracted by 1.1% during the first quarter of the year after managing to achieve healthy growth last year. I’m expecting loan growth to improve from the first quarter’s level in the year ahead because of a strong local economy. Heritage Commerce mostly operates in California with a focus on the San Francisco Bay area. The unemployment rate in San Francisco has risen over the last few months, but it is still very low when compared to previous years and the national average.
On the other hand, the high-rate environment will put a damper on credit demand. Overall, I’m expecting the loan portfolio to grow by 3.4% in 2023. My estimate is below the past five-year CAGR of 15.8% because interest rates are higher now. I’m expecting deposits and other balance sheet items to grow somewhat in line with loans for the last nine months of this year. The following table shows my balance sheet estimates.
| Financial Position | FY18 | FY19 | FY20 | FY21 | FY22 | FY23E |
| Net Loans | 1,859 | 2,511 | 2,575 | 3,044 | 3,251 | 3,361 |
| Growth of Net Loans | 18.9% | 35.1% | 2.6% | 18.2% | 6.8% | 3.4% |
| Other Earning Assets | 973 | 1,180 | 1,635 | 2,054 | 1,486 | 1,949 |
| Deposits | 2,638 | 3,415 | 3,914 | 4,759 | 4,390 | 4,613 |
| Borrowings and Sub-Debt | 39 | 40 | 40 | 40 | 39 | 352 |
| Common equity | 367 | 577 | 578 | 598 | 632 | 681 |
| Book Value Per Share ($) | 8.7 | 12.0 | 9.6 | 9.9 | 10.4 | 11.1 |
| Tangible BVPS ($) | 6.4 | 8.1 | 6.5 | 6.9 | 7.4 | 8.2 |
| Source: SEC Filings, Earnings Releases, Author's Estimates (In USD million unless otherwise specified) | ||||||
Expecting Earnings to Grow by 15%
Earnings of Heritage Commerce will likely continue to grow this year on the back of moderate loan growth. I’m expecting the company to report earnings of $1.25 per share for 2023, up 14.8% year-over-year. The following table shows my income statement estimates.
| Income Statement | FY18 | FY19 | FY20 | FY21 | FY22 | FY23E |
| Net interest income | 122 | 132 | 142 | 146 | 180 | 206 |
| Provision for loan losses | 7 | 1 | 13 | (3) | 1 | 3 |
| Non-interest income | 10 | 10 | 10 | 10 | 10 | 11 |
| Non-interest expense | 76 | 85 | 90 | 93 | 95 | 107 |
| Net income - Common Sh. | 35 | 40 | 35 | 48 | 67 | 77 |
| EPS - Diluted ($) | 0.84 | 0.84 | 0.59 | 0.79 | 1.09 | 1.25 |
| Source: SEC Filings, Earnings Releases, Author's Estimates(In USD million unless otherwise specified) | ||||||
In my last report on Heritage Commerce released in December 2022, I estimated earnings of $1.28 per share for 2023. I haven’t made any big changes to my updated earnings estimate because my outlook hasn’t changed much since my last report. Further, the results of the last two quarters have been in line with my expectations, so there’s no need to make any significant changes to my estimates.
Risks Remain Elevated
Three sources of risk stand out for Heritage Commerce, as discussed below.
- Heritage Commerce operates in the Alameda, Contra Costa, Marin, San Benito, San Francisco, San Mateo, and Santa Clara counties of California. Therefore, it has market overlap with companies that suffered from deposit runs on the bank earlier this year, namely SVB Financial (OTCPK:SIVBQ) and First Republic Bank (OTCPK:FRCB). The growth in Heritage’s deposit book during the first quarter shows that the deposit run did not spread to the company. Nevertheless, contagion risk remains.
- In case of a deposit run, Heritage could face some problems because of its large balance of uninsured deposits, which represented approximately 57% of total deposits on March 31, 2023. However, the company had yet-to-be-availed available liquidity and borrowing capacity of $2.773 billion, which was 110% of estimated uninsured deposits on March 31, 2023, as mentioned in the annual shareholder presentation. Therefore, it’s highly unlikely that a deposit run on the bank will harm the company’s going concern status. However, earnings could take a hit because the alternate sources of funding are costly, and they could boost interest expenses in case Heritage needed to replace uninsured deposits with borrowings.
- Office exposure in the commercial real estate portfolio totaled $383 million at the end of March 2023, which is around 12% of total loans. The market value of office properties and the debt-servicing capabilities of office property loans are at risk from the hybrid work and work-from-home cultures. Therefore, the office exposure presents a material risk to Heritage Commerce’s bottom line.
Attractive Dividend Yield with Secure Payout
Heritage Commerce is offering a high dividend yield of 6.2% at the current quarterly dividend rate of $0.13 per share. Due to the following two reasons, the dividend payout appears secure.
- The earnings and dividend estimates for 2023 suggest a payout ratio of 42%, which is below the last five-year average of 62%.
- The company reported a total capital-to-risk-weighted-assets ratio of 15.3% at the end of March 2023, as opposed to a minimum regulatory requirement of 10.5%. Therefore, the company appears more than just well-capitalized. Regulatory requirements do not currently threaten the amount of dividend payouts.
Maintaining a Buy Rating
I’m using the peer average price-to-tangible book (“P/TB”) and price-to-earnings (“P/E”) multiples to value Heritage Commerce. Peers are trading at an average P/TB ratio of 1.15 and an average P/E ratio of 8.76, as shown below.
| HTBK | FMBH | PGC | NFBK | CCBG | Peer Average | |
| P/E ("ttm") | 7.51 | 7.16 | 7.00 | 8.95 | 11.94 | 8.76 |
| P/E ("fwd") | 7.58 | 8.75 | 7.86 | 12.17 | 9.19 | 9.49 |
| P/B ("ttm") | 0.79 | 0.79 | 0.95 | 0.75 | 1.32 | 0.95 |
| P/TB ("ttm") | 1.10 | 1.06 | 1.04 | 0.80 | 1.70 | 1.15 |
| Source: Seeking Alpha | ||||||
Multiplying the average P/TB multiple with the forecast tangible book value per share of $8.2 gives a target price of $9.4 for the end of 2023. This price target implies a 12.0% upside from the June 14 closing price. The following table shows the sensitivity of the target price to the P/TB ratio.
| P/TB Multiple | 0.95x | 1.05x | 1.15x | 1.25x | 1.35x |
| TBVPS - Dec 2023 ($) | 8.2 | 8.2 | 8.2 | 8.2 | 8.2 |
| Target Price ($) | 7.8 | 8.6 | 9.4 | 10.3 | 11.1 |
| Market Price ($) | 8.4 | 8.4 | 8.4 | 8.4 | 8.4 |
| Upside/(Downside) | (7.5)% | 2.2% | 12.0% | 21.7% | 31.5% |
| Source: Author's Estimates |
Multiplying the average P/E multiple with the forecast earnings per share of $1.25 gives a target price of $11.0 for the end of 2023. This price target implies a 30.0% upside from the June 14 closing price. The following table shows the sensitivity of the target price to the P/E ratio.
| P/E Multiple | 6.8x | 7.8x | 8.8x | 9.8x | 10.8x |
| EPS - 2023 ($) | 1.25 | 1.25 | 1.25 | 1.25 | 1.25 |
| Target Price ($) | 8.5 | 9.7 | 11.0 | 12.2 | 13.5 |
| Market Price ($) | 8.4 | 8.4 | 8.4 | 8.4 | 8.4 |
| Upside/(Downside) | 0.3% | 15.1% | 30.0% | 44.8% | 59.6% |
| Source: Author's Estimates |
Equally weighting the target prices from the two valuation methods gives a combined target price of $10.2, which implies a 21.0% upside from the current market price. Adding the forward dividend yield gives a total expected return of 27.1%. Hence, I’m maintaining a buy rating on Heritage Commerce Corp. However, due to the elevated risk level, I think Heritage Commerce is unsuitable for low-risk-tolerant investors.
This article was written by

Analyst’s Disclosure: I/we have no stock, option or similar derivative position in any of the companies mentioned, and no plans to initiate any such positions within the next 72 hours. I wrote this article myself, and it expresses my own opinions. I am not receiving compensation for it (other than from Seeking Alpha). I have no business relationship with any company whose stock is mentioned in this article.
Disclaimer: This article is not financial advice. Investors are expected to consider their investment objectives and constraints before investing in the stock(s) mentioned in the article.
Seeking Alpha's Disclosure: Past performance is no guarantee of future results. No recommendation or advice is being given as to whether any investment is suitable for a particular investor. Any views or opinions expressed above may not reflect those of Seeking Alpha as a whole. Seeking Alpha is not a licensed securities dealer, broker or US investment adviser or investment bank. Our analysts are third party authors that include both professional investors and individual investors who may not be licensed or certified by any institute or regulatory body.