Hollysys: Balance Sheet Remains The Principal Calling Card Here

Summary
- We await a technical breakout on Hollysys' long-term chart.
- Balance sheet trends remain favorable with cash & receivables making up 70% of the entire asset-take.
- Assets remain very cheap, liquidity is strong and the return on capital profitability metric remains elevated.
blackred
Intro
We wrote about Hollysys Automation Technologies Ltd. (NASDAQ:HOLI) back in July of last year when we recommended investors wait for a better entry point. We have been following this industrial player for quite some time due to the company's keen valuation and strong balance sheet which we will get into. Furthermore, multiple buyout rumors in previous years have sparked interest among speculators in search of a big payday.
As we see below on the long-term technical chart, however, shares have not yet been able to take out their multi-year trendline. Although shares are up approximately 12% since our July-2022 commentary 11 months ago, we would need to see an aggressive penetration of this resistance level before putting money to work in Hollysys Automation.
Being chartists, we believe that HOLI's technicals are essentially the summation of every piece of information (including fundamentals) which could affect the share price of the stock. This is something that many value investors fail to grasp. Many times, they hold very cheap fundamentally strong companies for years on end but the respective positions in the end fail to gain any type of upward traction. To this point, HOLI has lost close to 35% of its market cap over the past 5 years alone. This is a sizable opportunity cost especially when one considers the strong gains of the S&P 500 during this timeframe
Suffice it to say, we only intend to enter HOLI stock on the long side when the pattern of lower annual lows gets negated. Furthermore, HOLI's strong balance sheet (which we see below) should ensure that long-term overhead resistance should become long-term support if indeed the breakout can take place in earnest.
HOLI Pattern Of multi-Year Lower Lows (Tradingview.com)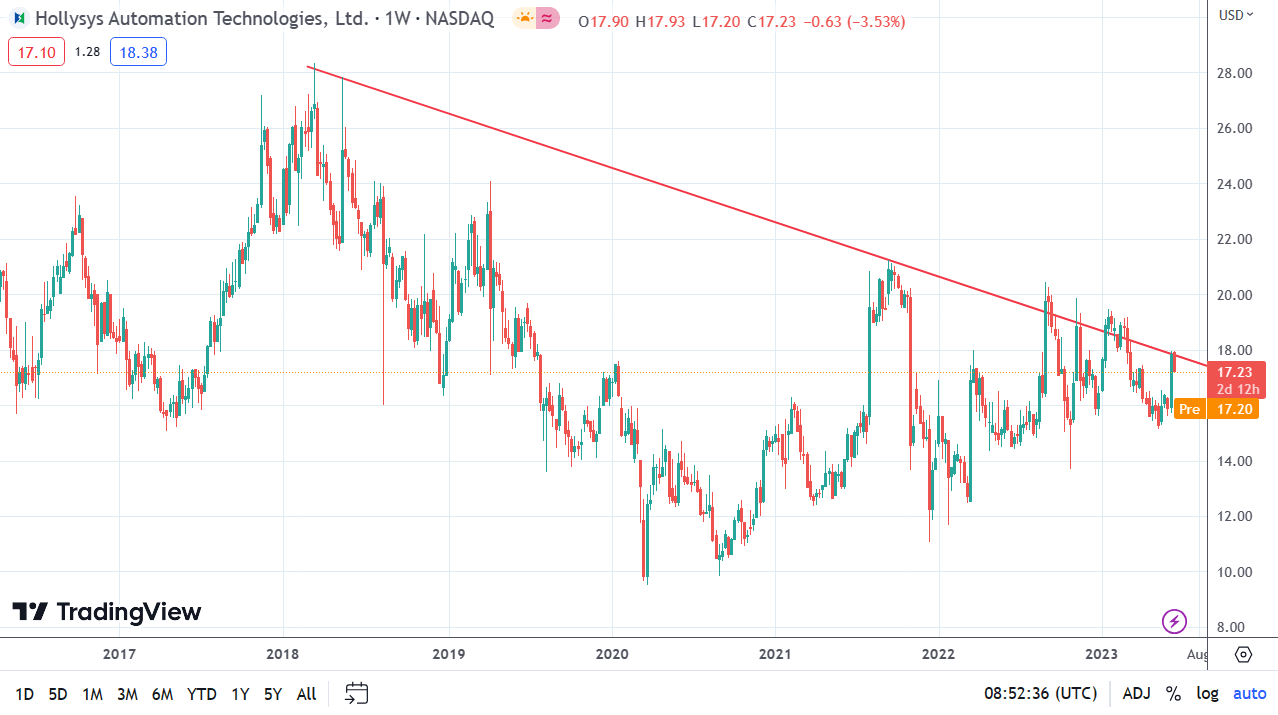
Cash & Short-Term Investments
HOLI's cash & short-term investments came in at just under $664 million at the end of the company's most recent third quarter. The lion's share of this line item is in liquid cash ($640+ million). Given HOLI trades with a market cap of $1.07 billion, the company's price-to-cash ratio comes in at a very attractive multiple of 1.62. Generally, you want to see a lot of cash on the balance sheet as this gives the company more options with respect to investments, acquisitions, share buybacks or dividends, etc.
Current Ratio (Liquidity)
Supply chain headwinds have caused havoc in multiple sectors in recent times around the globe. Companies have struggled to maintain liquidity in order to keep operations going to the best of their abilities. Maintaining liquidity especially now is vital to ensure short-term bills can be covered over a 12-month rolling forward period. At the end of Q3, HOLI's current assets amounted to $1.46 billion whereas its current liabilities totaled $445.3 million. Dividing the lower amount into HOLI's current assets, we get a current ratio of 3.28 demonstrating HOLI's liquidity remains in a sound position.
Long-Term Assets
Property, plant & equipment surprisingly makes up only $140+ million of HOLI's total asset take ($1.72 billion). This actually is not a bad thing as many industries need to continuously increase this line item on the balance sheet to either preserve market share or continue growing. Furthermore, goodwill & intangible assets make up less than $30 million (1.7%) of the company's total asset-take demonstrating that there is very little risk that significant impairment charges will take place in HOLI going forward.
ROA & Adjusted ROC
To see how efficiently HOLI is utilizing its assets, we divide the company's total assets ($1.723 billion) by trailing 12-month net profit ($104.5 million). This means HOLI's assets are returning just over 6% from their assets on an annual basis. While this figure may not turn many heads from a profitability standpoint, we must remember HOLI's very strong cash balance which makes up almost 40% of the total asset-take.
Therefore, with respect to calculating a different profitability metric such as return on capital, we would strip out HOLI's cash from the calculation (as it is not needed to run the business) and focus on EBIT instead of net profit. The reason we would use operating profit instead of net profit is that (debt implications, taxes or unusual items, etc.) can distort a company's earnings as tax rates and debt repayments schedules for example are not uniform across the board.
Return On Capital Formula (oldschoolvalue.com)
Therefore if we divide trailing EBIT of $94.50 by the sum of ($140.6 million & $350), we get an adjusted return of capital in HOLI of 19.26%. This result in our opinion gives a better insight into HOLI's profitability. Furthermore, with the company's trailing price to book multiple coming in at an ultra-low 0.88, HOLI has both sound profitability and a cheap valuation currently in its locker.
Risk
The principal risk concerning HOLI is its forward-looking growth path from an earnings standpoint. Remember, the reason for Holi's sustained pattern of lower lows since 2018 has been the company's lack of earnings power over a prolonged period. Although operating profit over the past four quarters of $94.5 million comes in substantially ahead of HOLI's EBIT of $74.5 million in its most recent completed fiscal year (June 2022), this elevated growth rate has not been the norm for the company. In fact, operating profit has only grown by 4% on average per year over the past five years whereas net profit is more or less flat in this timeframe. Therefore, growth rates concerning earnings must continue in order for the technical breakout to take place.
Conclusion
To sum up, Hollysys' strong foundation stems from a low valuation, sound profitability, and a robust balance sheet with plenty of cash. The market is looking for more growth and once this transpires, we should see a firm penetration of that multi-year bearish trendline. We look forward to continued coverage.

Analyst’s Disclosure: I/we have no stock, option or similar derivative position in any of the companies mentioned, but may initiate a beneficial Long position through a purchase of the stock, or the purchase of call options or similar derivatives in HOLI over the next 72 hours. I wrote this article myself, and it expresses my own opinions. I am not receiving compensation for it (other than from Seeking Alpha). I have no business relationship with any company whose stock is mentioned in this article.
Seeking Alpha's Disclosure: Past performance is no guarantee of future results. No recommendation or advice is being given as to whether any investment is suitable for a particular investor. Any views or opinions expressed above may not reflect those of Seeking Alpha as a whole. Seeking Alpha is not a licensed securities dealer, broker or US investment adviser or investment bank. Our analysts are third party authors that include both professional investors and individual investors who may not be licensed or certified by any institute or regulatory body.