NOBL: Good Idea, Bad Approach - 5 Factors That Could Improve Results From Dividend Aristocrats

Summary
- NOBL provides equal-weight exposure to 66 S&P 500 Dividend Aristocrats. Annual fees are 0.35%, and the ETF manages over $11 billion in assets.
- Unfortunately, the selection process is overly simplistic and insufficient. Instead, investors should consider skimming the ETF for the best long-term opportunities.
- I've developed an interactive Excel workbook that readers can download to quickly rank all Dividend Aristocrats according to key factors like growth, valuation, dividends, earnings, and profitability.
- This article identifies 10 top stocks that score well across the board and should be excellent long-term holdings. They also have great track records, but I didn't need to use historical returns to find them.
- The reason is that factors are what drive performance. Don't buy based on a low price alone, and my goal is for you to use my framework to avoid falling into dividend growth traps.
- Looking for a helping hand in the market? Members of Hoya Capital Income Builder get exclusive ideas and guidance to navigate any climate. Learn More »
skodonnell
Article Purpose
The ProShares S&P 500 Dividend Aristocrats ETF (BATS:NOBL) provides equal-weight exposure to 66 large-cap companies with 25+ year track records of increasing their dividend payments. NOBL is a popular choice for dividend growth investors, with $11.36 in assets under management. However, it's not optimal. Previously, I expressed concerns about growth and valuation and found other large-cap dividend ETFs offered a more attractive mix.
Instead of buying NOBL and paying its relatively high 0.35% fee each year, I ask readers to consider skimming the list for the highest-potential stocks. To assist, I've ranked each holding on five factors: growth, valuation, dividends, earnings, and profitability. I encourage readers to download this interactive workbook that uses Seeking Alpha data to see how I shortlisted just 10 Dividend Aristocrats that I believe will outperform moving forward. There's much information to review, so let's get started.
NOBL Analysis
Industry Overview: Identifying The Pros and Cons
Before we begin, let me quickly illustrate NOBL's issues by comparing its fundamentals to the SPDR S&P 500 ETF (SPY).
The Sunday Investor / Seeking Alpha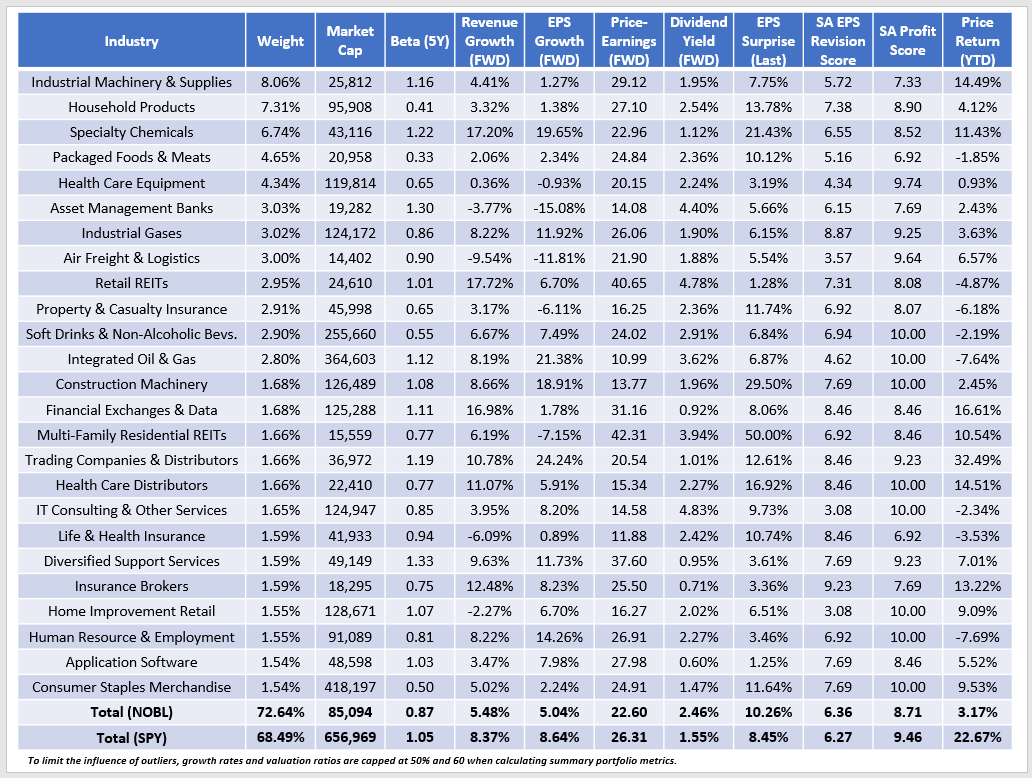
NOBL selects from the lower end of the S&P 500 Index, as indicated by its $85 billion market capitalization vs. SPY's $657 billion. Also, its 0.87 five-year beta suggests it's less volatile than the broader market. As for the five factors, NOBL has 3-4% less expected sales and earnings growth compared to SPY, trades 3-4 points cheaper on forward earnings and trailing cash flow, yields 0.91% more (0.65% after fees), is a bit below average on profitability, but has solid earnings momentum (earnings surprises and revisions). It's remarkable how its constituents are underperforming SPY by 19.50% YTD, so that should give you an idea of how poorly the market views these Dividend Aristocrats.
One reason is NOBL's need for more technology stocks. The 25-year requirement is too much to overcome, and I expect this to stay the same for the foreseeable future. Consumer Staples and Industrials are NOBL's largest sectors at 23% each, and the graph below helps explain why NOBL is trailing SPY by 11% YTD.
Seeking Alpha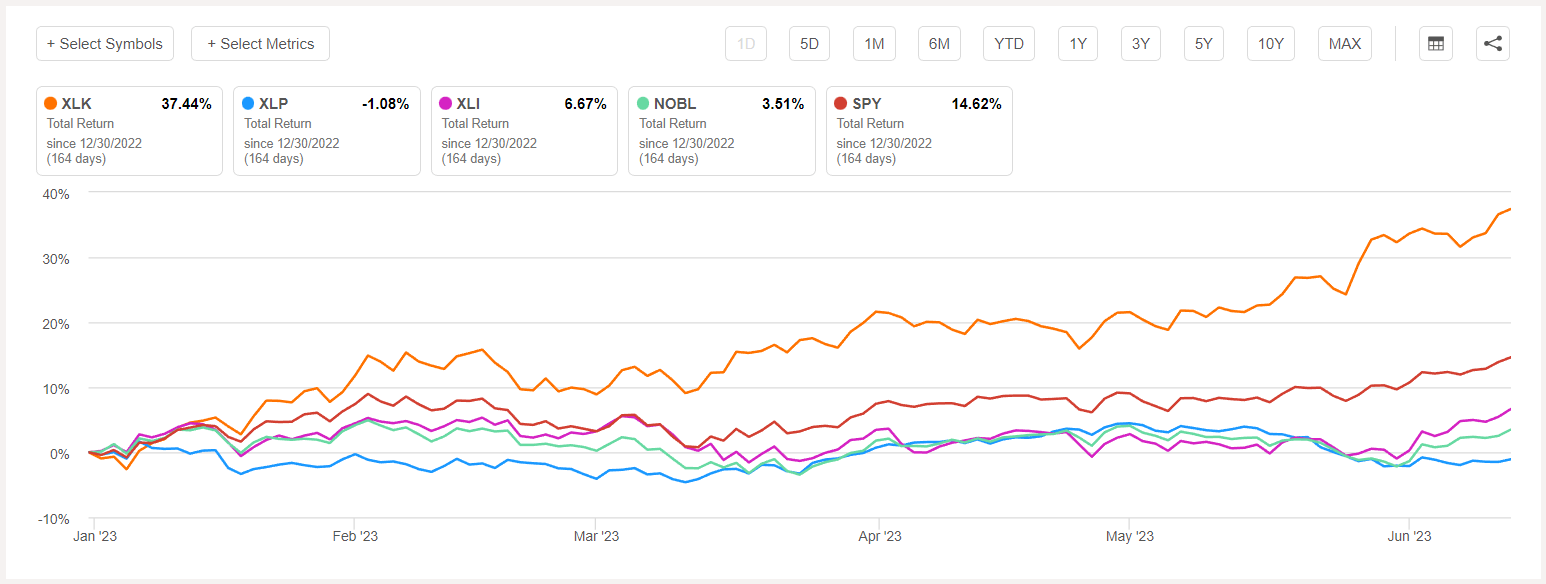
Factor #1: Growth
On the "Weightings" worksheet, I measured and weighted growth based on 12 sub-factors, as follows:
- 5Y Revenue CAGR: 5%.
- 3Y Revenue CAGR: 5%.
- TTM Revenue Growth: 5%.
- FWD Revenue Growth: 10%.
- 3Y EBITDA CAGR: 5%.
- TTM EBITDA Growth: 5%.
- FWD EBITDA Growth: 10%.
- 3Y EPS CAGR: 5%.
- TTM EPS Growth: 5%.
- FWD EPS Growth: 10%.
- 3Y Total Assets CAGR: 5%.
- Seeking Alpha Growth Score: 30%.
The Seeking Alpha Growth Score is weighted the most because it already incorporates many other sub-factors, serving as a "check" of sorts. Based on these weightings, Albemarle (ALB) scored the highest. Here is a sample of the metrics Seeking Alpha uses to calculate the Specialty Chemicals company's "A+" Growth Grade.
Seeking Alpha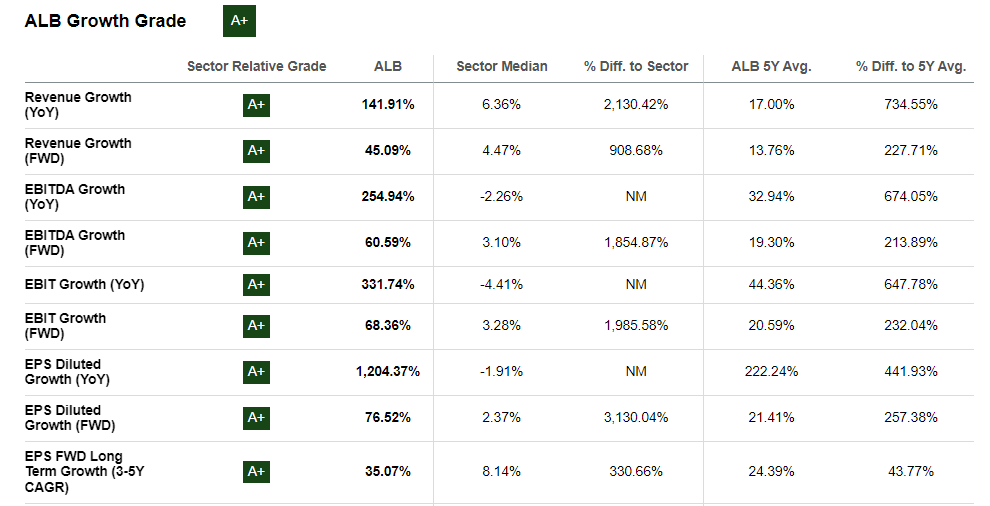
Recognizing that every investor is different and will assign different weightings than I have, I intentionally made the workbook interactive. Please adjust these sub-factor weightings as you see fit on the "Weightings" worksheet. Afterward, you can go to the "Growth" worksheet and re-rank the Dividend Aristocrats in the final column. I've set it up so that the best-ranked company is #1, and the worst-ranked is #66. Finally, to reduce the impact of outliers, I have also set a 50% cap on all growth metrics. It's the same approach I use when calculating summary metrics for ETFs, as figures like the above 1,204.37% diluted earnings growth can easily skew results.
I've listed the subsequent nine top growth Dividend Aristocrats below. They include Realty Income (O), NextEra Energy (NEE), Sysco (SYY), W.W. Grainger (GWW), Cintas (CTAS), Atmos Energy (ATO), Exxon Mobil (XOM), Brown & Brown, and Automatic Data Processing (ADP).
The Sunday Investor / Seeking Alpha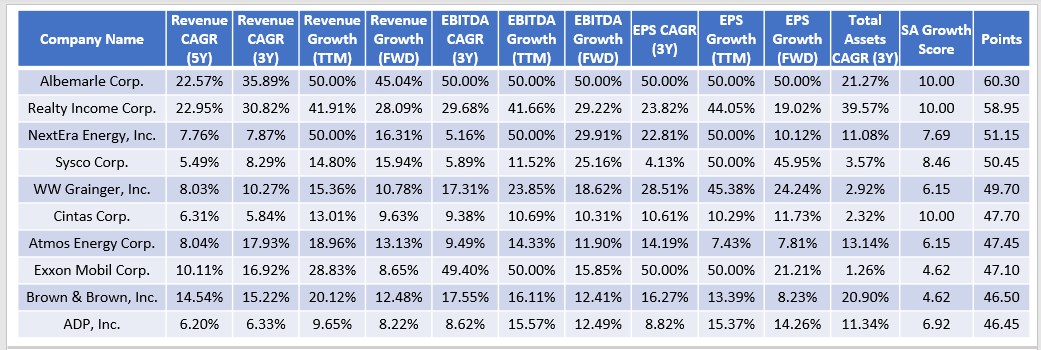
In total, these ten stocks have the following average price characteristics:
- YTD Price Return: 3.25%.
- 3Y Total Return: 84.84%.
- 5Y Total Return: 100.30%.
- 10Y Total Return: 343.64%.
- Price vs. 50D SMA Price: 2.73%.
- Price vs. 200D SMA Price: 1.56%.
I'll calculate these same numbers for the top ten companies on each factor, and we can use that information to help understand which element is favored both in the short- and long term.
Factor #2: Value
On the "Weightings" worksheet, I measured and weighted value based on eight sub-factors, as follows:
- TTM Price-Sales: 10%.
- TTM Price-Cash Flow: 10%.
- TTM Price-Book: 5%.
- TTM Price-Earnings: 5%.
- FWD Price-Earnings: 20%.
- TTM Enterprise Value-EBITDA: 10%.
- TTM Enterprise Value-Sales: 10%.
- Seeking Alpha Value Score: 30%.
Based on these factors, Walgreens Boots Alliance (WBA) was the top-rated Dividend Aristocrat value company. Below is a sample of the metrics Seeking Alpha uses to calculate WBA's "A-" Valuation Grade.
Seeking Alpha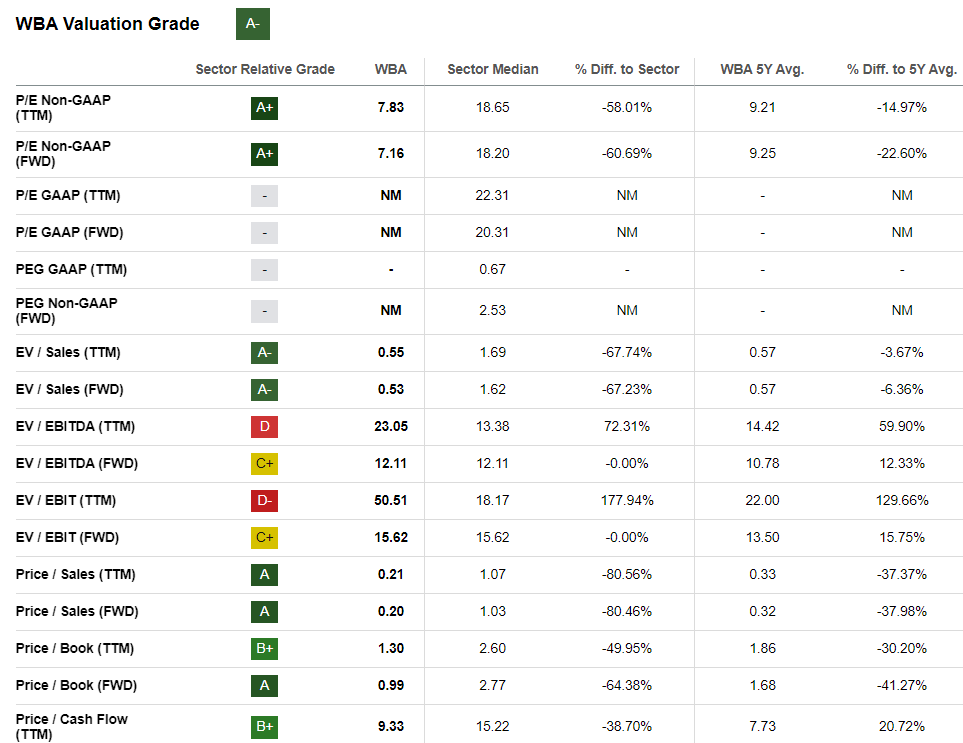
I've listed the next nine top value Dividend Aristocrats below. They include Archer-Daniels-Midland (ADM), Nucor (NUE), 3M (MMM), Cardinal Health (CAH), Exxon Mobil (XOM), Target (TGT), Franklin Resources (BEN), Chubb (CB), and Chevron (CVX). I've capped these ratios at 60 for valuation rankings, similar to Morningstar's approach.
The Sunday Investor / Seeking Alpha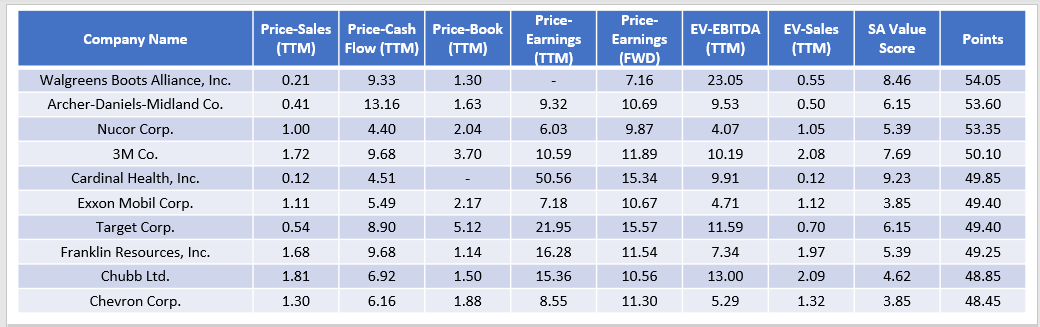
The price averages mentioned earlier for this group of stocks are as follows:
- YTD Price Return: -5.67%.
- 3Y Total Return: 82.84%.
- 5Y Total Return: 53.46%.
- 10Y Total Return: 116.14%.
- Price vs. 50D SMA Price: -0.89%.
- Price vs. 200D SMA Price: -3.64%.
These price statistics for the top-value stocks are all worse than the averages for the growth stocks. It's one piece of evidence that growth stocks are favored, but notably, the five- and ten-year total returns figures are 47% and 227% lower. Therefore, these value stocks have been that way for a long time. They may bounce back, but you may need a long time horizon.
Factor #3: Dividends
On the "Weightings" worksheet, I measured and weighted dividends based on 11 sub-factors, as follows:
- 4Y Average Dividend Yield: 5%.
- TTM Dividend Yield: 5%.
- FWD Dividend Yield: 10%.
- 4Y Average Dividend Payout Ratio: 10%.
- TTM Dividend Payout Ratio: 10%.
- 5Y Dividend CAGR: 10%.
- 3Y Dividend CAGR: 10%.
- Seeking Alpha Dividend Consistency Score: 10%.
- Seeking Alpha Dividend Growth Score: 10%.
- Seeking Alpha Dividend Safety Score: 10%.
- Seeking Alpha Dividend Yield Score: 10%.
Based on these factors, Nucor (NUE) was the top-rated Dividend Aristocrat dividend company. The following grades contributed to this high ranking.
Seeking Alpha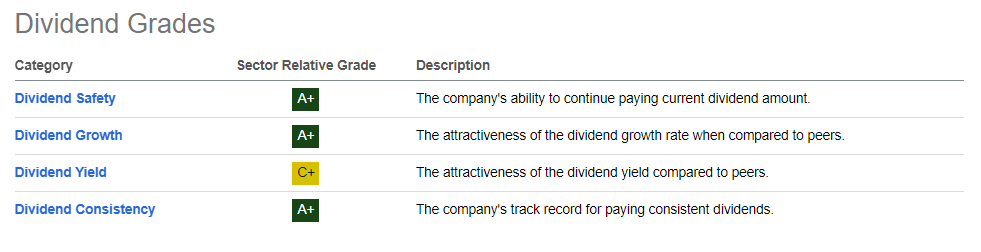
Nucor yields just 1.32%, but it has a low 7.92% dividend payout ratio, and has increased dividends by 7.97% over the last five years. These figures might not impress you, but as a reminder, you can always place less emphasis on the Dividend Grades above in the "Weightings" worksheet. The remaining nine top dividend stocks are AbbVie (ABBV), Chevron, T. Rowe Price Group (TROW), C.H. Robinson Worldwide (CHRW), General Dynamics (GD), Nordson (NDSN), Johnson & Johnson (JNJ), W.W. Grainger, and Archer-Daniels-Midland (ADM).
The Sunday Investor / Seeking Alpha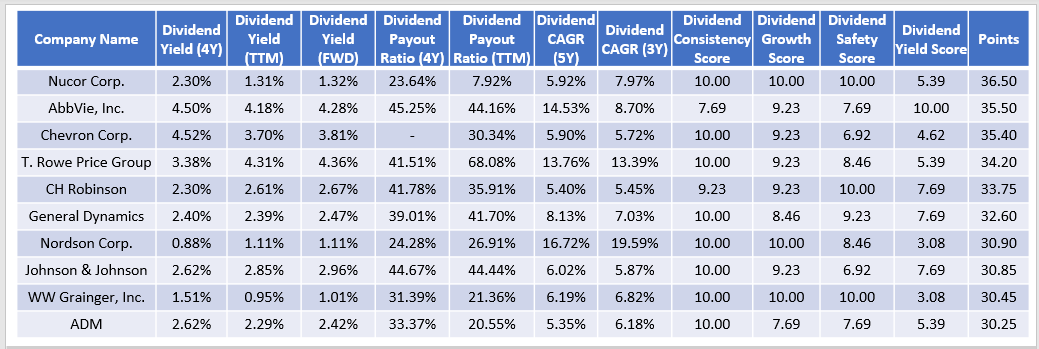
The price averages for this group of stocks are as follows:
- YTD Price Return: -1.83%.
- 3Y Total Return: 85.56%.
- 5Y Total Return: 71.67%.
- 10Y Total Return: 214.31%.
- Price vs. 50D SMA Price: 0.73%.
- Price vs. 200D SMA Price: -1.04%.
There is some overlap between the dividend and value factors. However, these shorter-term results are better than the top-rated value stocks, so the factor is worth some consideration. Still, there are some poor performers here. In particular, T. Rowe Price Group and C.H. Robinson Worldwide have barely broken even over that period.
Seeking Alpha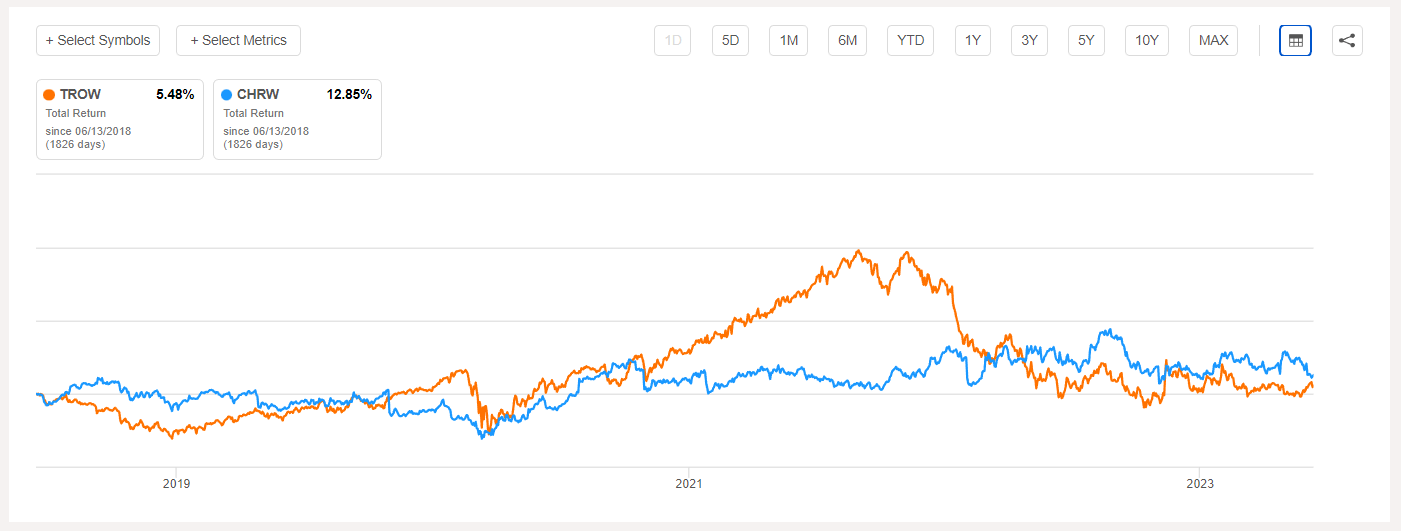
It's a reminder that just because a stock appears cheaply valued doesn't mean the market has it wrong. In T. Rowe's case, one likely reason is that the company last reported a double-digit sales surprise three years ago.
Seeking Alpha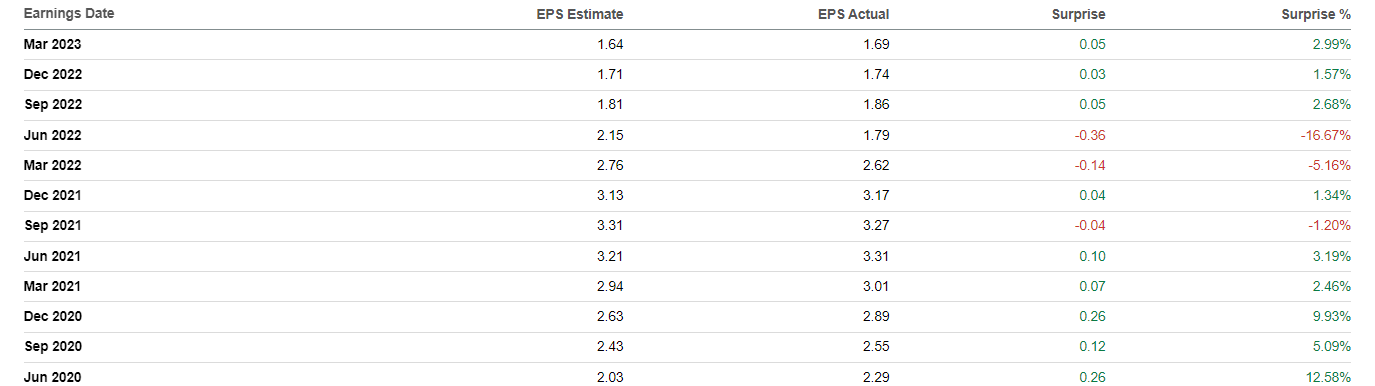
It's hard to get excited with results like these, especially after the huge June 2022 miss accompanied by $14.7 billion in net client outflows. The company outperformed NOBL post-pandemic through 2021 but lost 42% the following year. I attribute much of this to the lackluster earnings surprise figures above, so let's incorporate that next.
Factor #4: Earnings
On the "Weightings" worksheet, I measured and weighted earnings based on three sub-factors, as follows:
- Last Quarterly Revenue Surprise: 25%.
- Last Quarterly EPS Surprise: 25%.
- Seeking Alpha EPS Revision Score: 50%.
Clorox (CLX) was the top-rated earnings stock among the Dividend Aristocrats because it beat consensus sales and earnings expectations by 5.31% and 23.37% last quarter. McDonald's (MCD), A.O. Smith (AOS), Aflac (AFL), Brown & Brown (BRO), Consolidated Edison (ED), Johnson & Johnson, Caterpillar, Emerson Electric, and Cardinal Health round out the top 10 earnings stocks.
The Sunday Investor / Seeking Alpha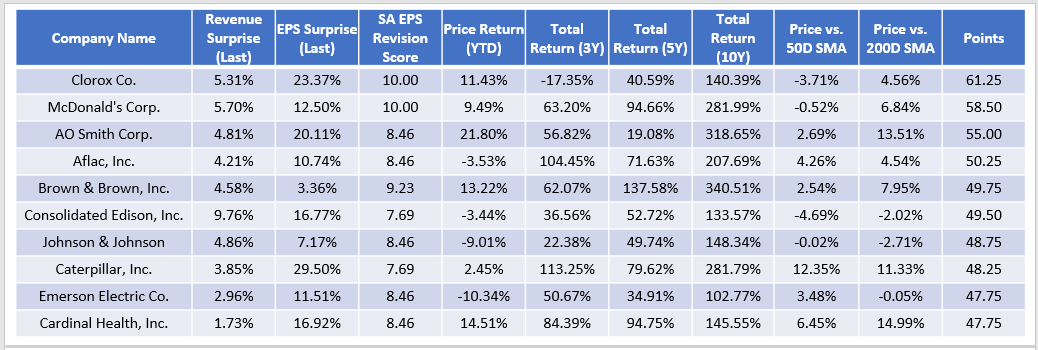
The average price metrics you see above are as follows:
- YTD Price Return: 4.66%.
- 3Y Total Return: 57.65%.
- 5Y Total Return: 67.53%.
- 10Y Total Return: 210.12%.
- Price vs. 50D SMA Price: 2.28%.
- Price vs. 200D SMA Price: 5.89%.
These are the best short-term price metrics yet. It's no surprise because earnings drive short-term results. I recommend using these statistics to avoid buying companies on their way down.
Factor #5: Profitability
Recall NOBL's weighted average 8.71/10 Profitability Score from the first table. This score is only average, and many dividend ETFs, including SCHD, score well above 9/10. Higher profitability gives companies an edge in market downturns. In addition, these companies likely have more flexibility to increase dividends even when times are tough. One criticism I have with NOBL is that several holdings are slow growers. Only 25% have a double-digit five-year dividend growth rate compared to 52% for SCHD. NOBL also includes several companies that seemingly raise dividends to maintain Dividend Aristocrat status. I prefer merit-based increases, and that's something more common to highly-profitable companies.
On the "Weightings" worksheet, I measured and weighted profitability based on nine sub-factors, as follows:
- TTM Gross Profit Margin: 5%.
- TTM EBITDA Margin: 5%.
- TTM EBIT Margin: 5%.
- TTM Net Income Margin: 5%.
- TTM Free Cash Flow Margin: 10%.
- TTM Return on Assets: 15%.
- TTM Return on Equity: 15%.
- TTM Return on Total Capital: 15%.
- Seeking Alpha Profitability Score: 25%.
Like the growth metrics, I've capped several profitability metrics at 50% to limit the influence of outliers. Under this weighting system, Automatic Data Processing was the top-rated stock. Here are some metrics Seeking Alpha uses to calculate ADP's "A+" Profitability Grade.
Seeking Alpha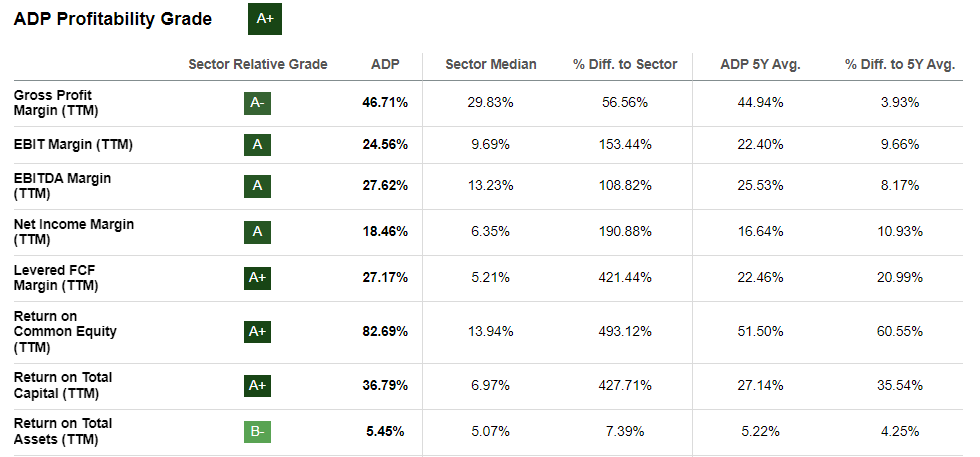
The remaining top stocks are AbbVie, Illinois Tool Works (ITW), Coca-Cola (KO), Nucor, Procter & Gamble (PG), Colgate-Palmolive (CL), Johnson & Johnson, Exxon Mobil, and Albemarle.
The Sunday Investor / Seeking Alpha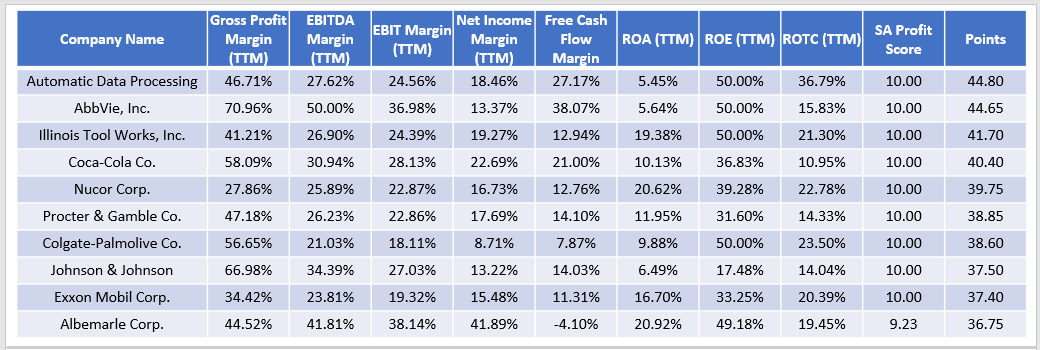
The price averages for this group of stocks are as follows:
- YTD Price Return: -1.47%.
- 3Y Total Return: 96.79%.
- 5Y Total Return: 89.27%.
- 10Y Total Return: 232.22%.
- Price vs. 50D SMA Price: 0.94%.
- Price vs. 200D SMA Price: -0.47%.
The 232.22% average ten-year return figure is disappointing but is skewed by the 62.14% return for Colgate-Palmolive. This company doesn't rank very highly on the other four factors, so I recommend a multi-factor approach when searching for the best Dividend Aristocrats to buy. Let's put all this data together in the final step.
Multi-Factor Rankings
Similar to what we did for the sub-factors, we must assign weights to the primary factors. You may change these based on what's most important to you, but these are my suggestions given current market conditions where the growth factor is favored.
- Growth: 30%.
- Value: 10%.
- Dividends: 20%.
- Earnings: 25%.
- Profitability: 15%.
These rankings result in the following top-ten list, which includes Caterpillar, W.W. Grainger, Albemarle, Consolidated Edison, Brown & Brown, S&P Global (SPGI), McDonald's, Cintas, Nucor, and Exxon Mobil. It's important to note that very few of these stocks score poorly on any single metric.
The Sunday Investor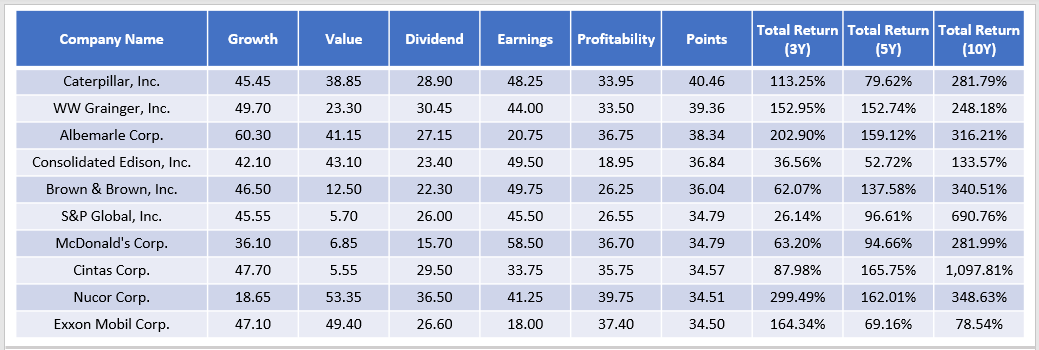
These ten stocks have the following total return statistics, noted in the final three columns:
- 3Y Total Return: 120.89%.
- 5Y Total Return: 117.00%.
- 10Y Total Return: 381.80%.
These statistics are the best results yet, and what's crucial is that we arrived at this list without considering the historical returns themselves. Rather than screening for the best-performing Dividend Aristocrats, we let five primary factors and 43 sub-factors lead us to a list of stocks that likely will be excellent long-term holds. And for those wondering how these ten stocks match up with NOBL's overall fundamentals, consider these summary metrics below:
The Sunday Investor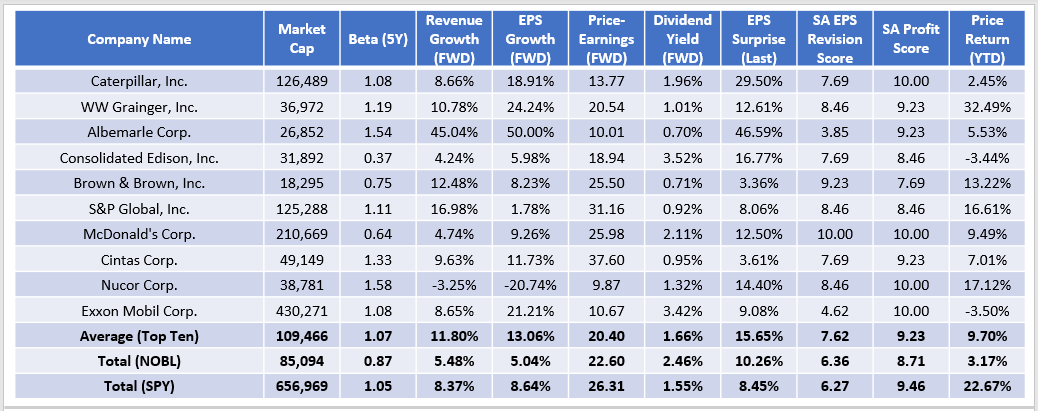
As shown, there is improvement in virtually every category except volatility and dividend yield. However, purchasing these stocks saves NOBL's 0.35% expense ratio, so the net difference may not matter much to you. The main benefits are that these companies have substantially more sales and earnings growth, trade two points cheaper on forward earnings, have better last quarter earnings surprise and earnings revision figures, and have superior profitability despite a relatively low 15% assigned weighting.
Summary
This article provided readers with a framework for assessing the strengths and weaknesses of the 66 Dividend Aristocrats held in NOBL. I believe factors drive performance and should be the basis of an investment rather than historical price movements. In short, by taking this multi-factor approach, you can ensure you're buying a stock for the right reasons and not solely because of a long dividend track record. Sadly, that's the only value-add screen NOBL provides, and it's insufficient.
Finally, I encourage you to experiment with the workbook and decide on the most critical factors for you. No two investors are the same, and please let me know in the comments section below if you would like these metrics updated regularly. Thank you for reading.
The Sunday Investor Joins Income Builder
The Sunday Investor has teamed up with Hoya Capital to launch the premier income-focused investing service on Seeking Alpha. Members receive complete early access to our articles along with exclusive income-focused model portfolios and a comprehensive suite of tools and models to help build sustainable portfolio income targeting premium dividend yields of up to 10%.
Whether your focus is High Yield or Dividend Growth, we’ve got you covered with actionable investment research focusing on real income-producing asset classes that offer potential diversification, monthly income, capital appreciation, and inflation hedging. Start A Free 2-Week Trial Today!

This article was written by

I perform independent fundamental analysis for over 850 U.S. Equity ETFs and aim to provide you with the most comprehensive ETF coverage on Seeking Alpha. My insights into how ETFs are constructed at the industry level are unique rather than surface-level reviews that’s standard on other investment platforms. My deep-dive articles always include a set of alternative funds, and I am active in the comments section and ready to answer your questions about the ETFs you own or are considering.
My qualifications include a Certificate in Advanced Investment Advice from the Canadian Securities Institute, the completion of all educational requirements for the Chartered Investment Manager (CIM) designation, and a Bachelor of Commerce degree with a major in Accounting. In addition, I passed the CFA Level 1 Exam and am on track to become licensed to advise on options and derivatives in 2023. In November 2021, I became a contributor for the Hoya Capital Income Builder Marketplace Service and manage the "Active Equity ETF Model Portfolio", which as a total return objective. Sign up for a free trial today! Hoya Capital Income Builder.
Analyst’s Disclosure: I/we have a beneficial long position in the shares of SPY, SCHD, KO, MCD either through stock ownership, options, or other derivatives. I wrote this article myself, and it expresses my own opinions. I am not receiving compensation for it (other than from Seeking Alpha). I have no business relationship with any company whose stock is mentioned in this article.
Seeking Alpha's Disclosure: Past performance is no guarantee of future results. No recommendation or advice is being given as to whether any investment is suitable for a particular investor. Any views or opinions expressed above may not reflect those of Seeking Alpha as a whole. Seeking Alpha is not a licensed securities dealer, broker or US investment adviser or investment bank. Our analysts are third party authors that include both professional investors and individual investors who may not be licensed or certified by any institute or regulatory body.