FBCG Vs. TCHP: Comparing Blue Chip Growth ETFs

Summary
- The Fidelity Blue Chip Growth ETF invests in growth stocks of companies across diversified market capitalization, with an emphasis on large-cap stocks.
- The T. Rowe Price Blue Chip Growth ETF invests in well established in their industries and have the potential for above-average earnings growth and market-leading positions.
- Here I will compare both ETFs against both each other and against an index-based ETF linked to the benchmark each ETF benchmarks against.
- Except for investors who like the sector shifts currently in place, neither ETF warrants more than a Hold rating. Others should consider the better performing index-based ETFs.
- Looking for more investing ideas like this one? Get them exclusively at Hoya Capital Income Builder. Learn More »
Riddy
(This article was co-produced with Hoya Capital Real Estate)
Introduction
The name "blue chip" comes from the game of poker where the blue chips have the highest value. Investopedia says such stocks have common characteristics, such as:
- "Blue chip stocks are seen as less volatile investments than shares in companies without blue chip status because of their noteworthy institutional profile and longstanding financial health.
- Blue chips are highly liquid since they are frequently traded in the market by individual and institutional investors alike. Therefore, investors who need cash can feel confident that there will be buyers for their shares.
- Blue chip companies are also characterized as having little to no debt, large market capitalization, stable debt-to-equity ratio, and high return on equity (ROE) and return on assets (ROA).
- Solid balance sheet fundamentals and high liquidity have earned blue chip stocks the investment-grade credit rating.
- While dividend payments are not necessary for a stock to be considered a blue chip, most blue chips have long records of paying stable or rising dividends.
- An investor can track the performance of blue chip stocks through a blue chip index, which can also be seen as an indicator of industry or economic performance."
This article compares ETFs from two well-known ETF managers, both of which launched after the market started its post-Covid correction.
Fidelity Blue Chip Growth ETF review
Seeking Alpha describes this ETF as:
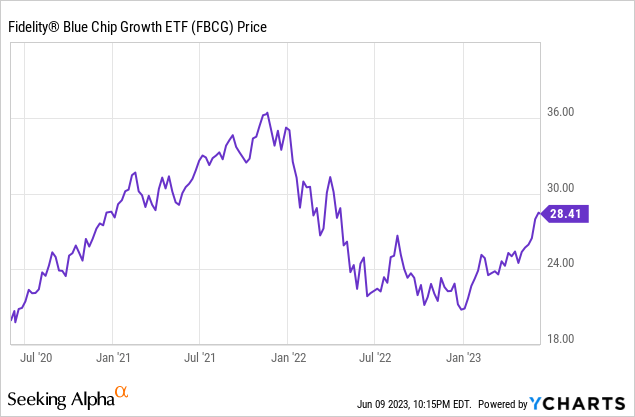
The investment seeks long-term growth of capital. Normally the fund invests at least 80% of assets in blue chip companies (companies that, in Fidelity Management & Research Company LLC's (FMR) view, are well-known, well-established and well-capitalized), which generally have large or medium market capitalizations. It invests in companies that manager believes have above-average growth potential (stocks of these companies are often called "growth" stocks). The fund is non-diversified. Benchmark: Russell 1000 Growth TR USD. FBCG started on 6/2/2020.
Source: seekingalpha.com FBCG
FBCG has $564m in AUM and has 59bps in fees. This ETF has yet to pay a dividend.
FBCG holdings review
One of the first thing Fidelity mentioned about FBCG is unlike most ETFs, FBGC does not report holdings on a daily basis; last available is 4/30/23.
seekingalpha.com FBCG sectors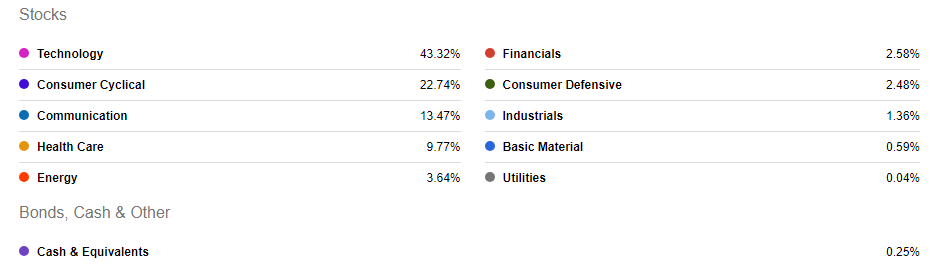
Just Technology and Consumer Cyclical stocks account for 66% of the portfolio, with Communication and Health Care stocks pushing that percent to over 90%. FBCG holders better hope the FOMC pulls off that "soft landing"!
As of 4/30/23, FBCG held 162 stocks, allocated by these regions:
- US stocks: 96.8%-145 stocks
- International Developed: 1.8%-11 stocks
- Emerging Markets: 1.1%- 6 ADRs
Fidelity.com holdings report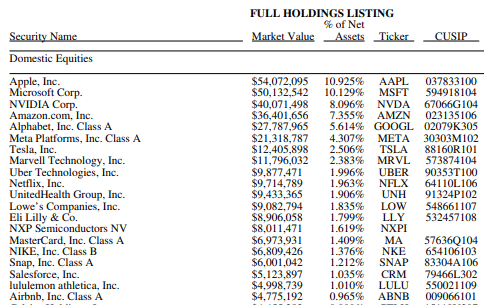
These stocks are almost 70% of the total.
FBCG distribution review
No dividends have been made yet.
T. Rowe Price Blue Chip Growth ETF review
Seeking Alpha describes this ETF as:
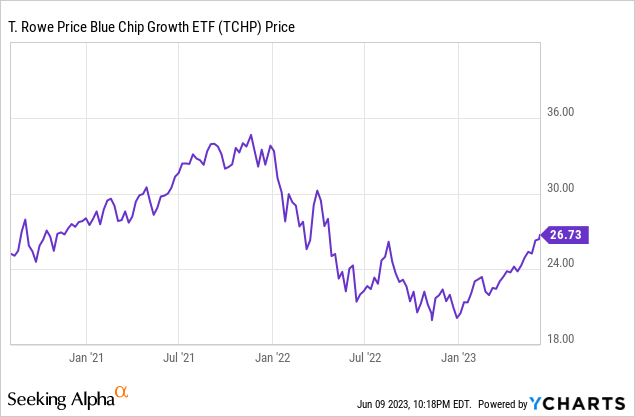
The fund will normally invest at least 80% of its assets in the common stocks of large- and mid-cap blue chip growth companies that are listed in the United States (or futures that have similar economic characteristics). Blue chip growth companies are firms that, in the investment adviser's view, are well established in their industries and have the potential for above-average earnings growth. It focuses on companies with leading market positions, seasoned management, and strong financial fundamentals. The fund is non-diversified. Benchmark: three are used. TCHP started on 8/2/2020.
Source: seekingalpha.com TCHP
TCHP has $353m in AUM and comes with 57bps in fees. Like the other ETF reviewed, no dividends have been paid yet.
TCHP holdings review
seekingalpha.com TCHP sectors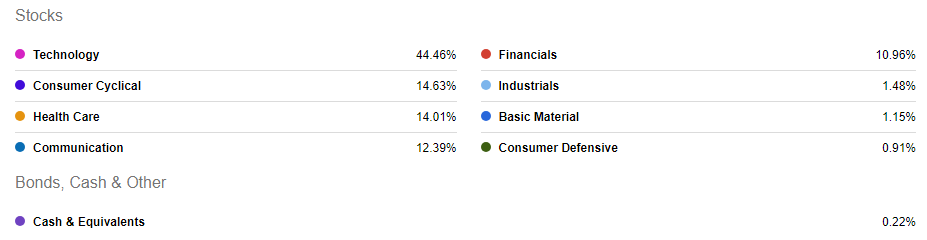
I will compare sector allocations later but we see the same ones as FBCG dominating here too. The current holding listing only includes the Top 10 stocks, which account for 62% of the portfolio. TCHP is more concentrated with only 68 stocks held. Holdings are from 5/31/23.
troweprice.com TCHP holdings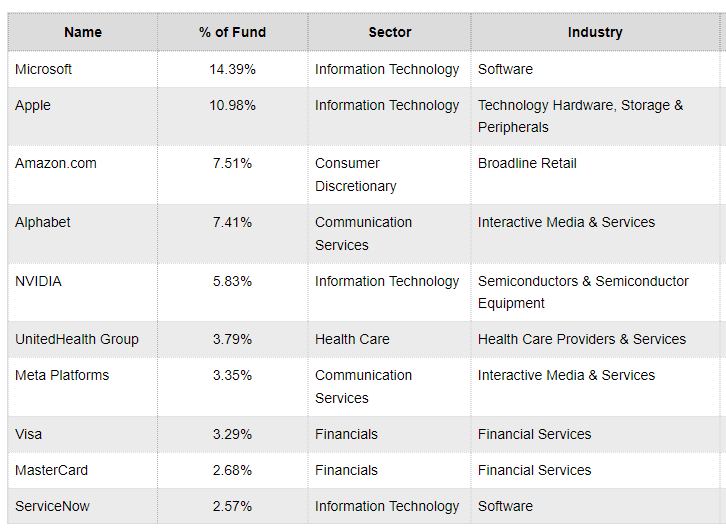
TCHP is over 96% in US stocks, with the rest in International Developed; no EM exposure was listed.
TCHP distributions review
No dividends have been made yet.
Comparing ETFs
Morningstar provides the following data points for each ETF. Except for Book-Value Growth, they all favor FBCG.
Morningstart.com; compiled by Author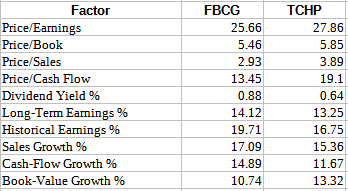
Here, I added ETFs to represent the index used by each ETF reviewed in this article; those being:
PortfolioVisualizer.com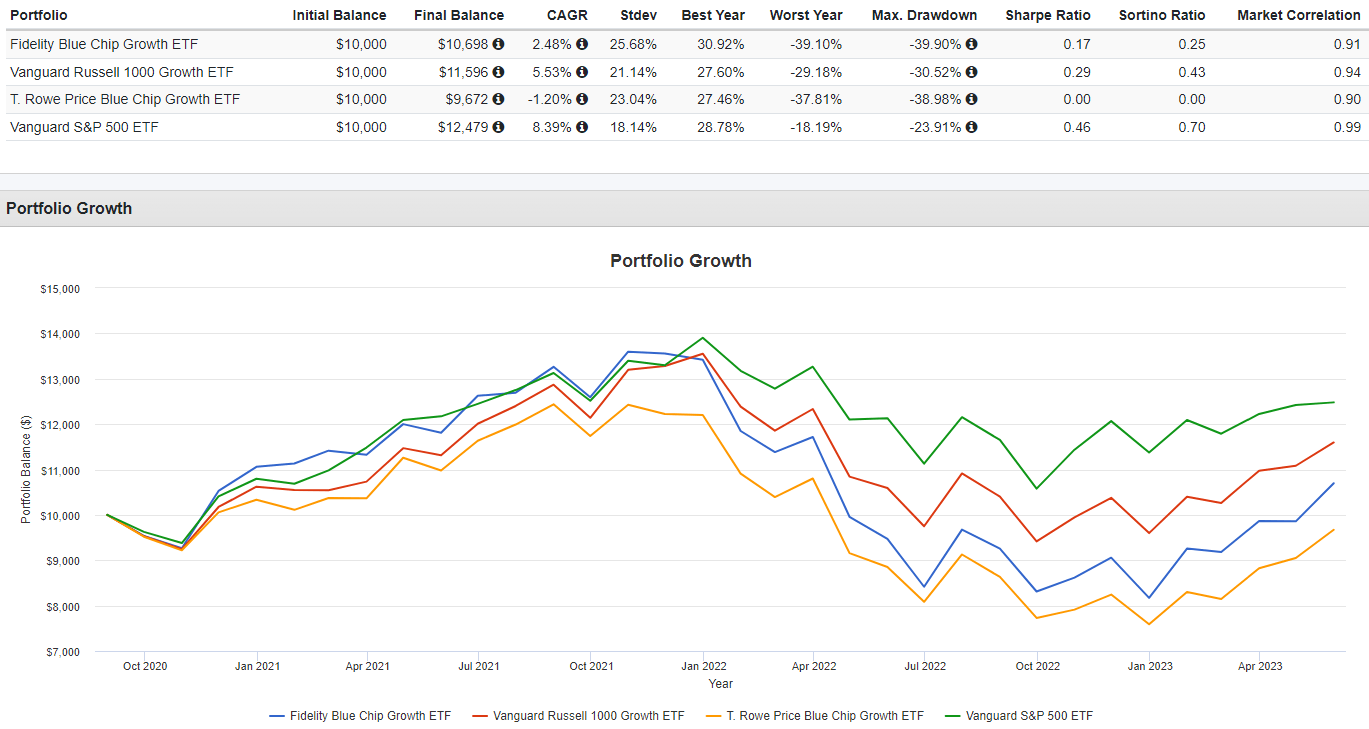
The active management of both ETFs since mid-2020 has resulted in inferior returns with higher StdDev values than the index they are trying to outperform. One possible reason is the Growth allocation in both ETFs is higher than the benchmark-invested ETF they compare against.
advisors.vanguard.com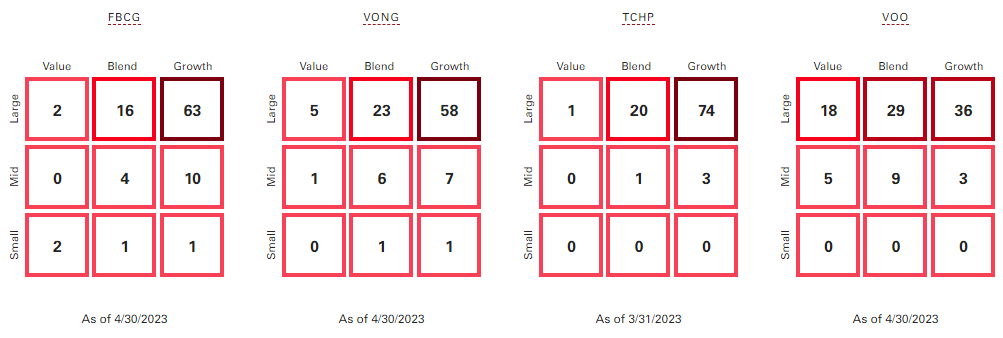
The TCHP/VOO (as expected) combo has the biggest difference in both growth allocations and the CAGR of the two ETFs. Sorted by absolute value, we see the ETFs have large differences in multiple sectors, especially the top two.
Morningstar.com sectors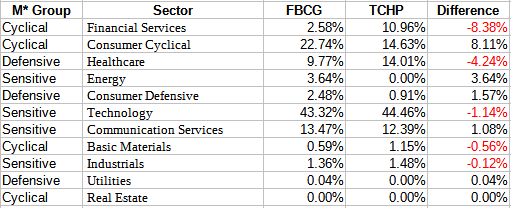
Some of those differences could be the result that Morningstar used different dates, with FBCG being 4/30/23 and TCHP being 3/31/23.
Within the Seeking Alpha ranking system, FBCG is the preferred choice, though not the top sub-class choice.
seekingalpha.com; homepages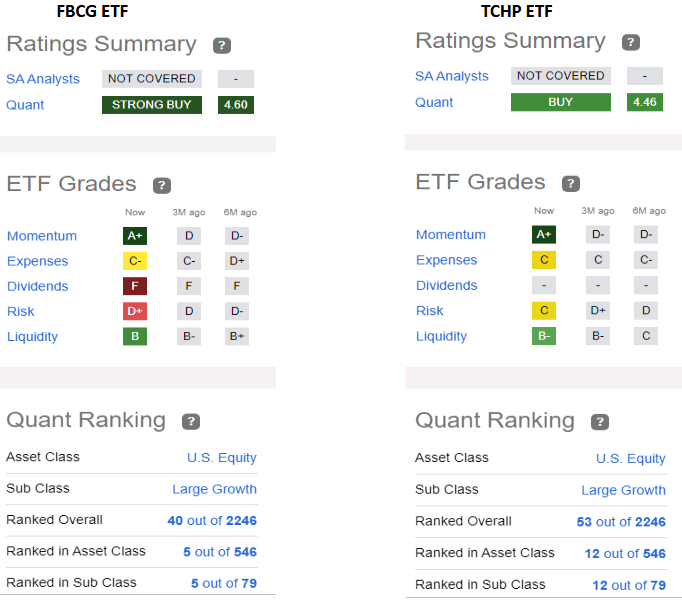
Portfolio strategy
Investors are paying 59bps to own the actively managed FBCG ETF; versus only 10bps for the Vanguard S&P 500 Growth ETF (VOOG) which invests in a similar set of stocks but passively. This is how these ETFs differ by sector.
ETFRC.com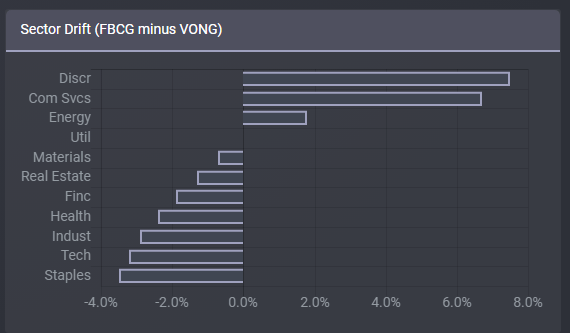
The managers of FBCG are currently betting on Consumer Discretionary and Communication stocks and against three other sectors by about the same amounts. This is a good example of why taking a deep drive into any fund, beyond the name, is important and comparing it against a standard, non-growth ETF. In this case, that would be the Vanguard Russell 1000 ETF (VONE).
ETFRC.com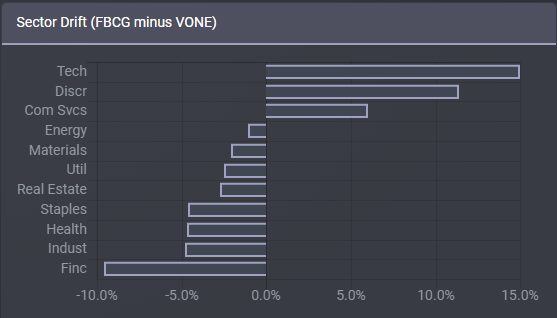
Notice how different the over/under allocations differ when comparing FBCG against VONE versus VONG. Here, Technology goes from underweighted to the most overweighted sector.
Final thought
Realizing three years is a short time to draw definitive conclusions, but so far neither FBCG nor TCHP has shown that their higher cost, active strategy benefits investors over the index-based ETFs that invest for the same strategy. Unless a holder like the last report sector bets, owning these ETFs does not appeal to this investor. At best, they are a Hold for the first set of investors, a Sell for the rest.

I ‘m proud to have asked to be one of the original Seeking Alpha Contributors to the 11/21 launch of the Hoya Capital Income Builder Market Place.
This is how HCIB sees its place in the investment universe:
Whether your focus is high yield or dividend growth, we’ve got you covered with high-quality, actionable investment research and an all-encompassing suite of tools and models to help build portfolios that fit your unique investment objectives. Subscribers receive complete access to our investment research - including reports that are never published elsewhere - across our areas of expertise including Equity REITs, Mortgage REITs, Homebuilders, ETFs, Closed-End-Funds, and Preferreds.
This article was written by

I have both a BS and MBA in Finance. I have been individual investor since the early 1980s and have a seven-figure portfolio. I was a data analyst for a pension manager for thirty years until I retired July of 2019. My initial articles related to my experience in prepping for and being in retirement. Now I will comment on our holdings in our various accounts. Most holdings are in CEFs, ETFs, some BDCs and a few REITs. I write Put options for income generation. Contributing author for Hoya Capital Income Builder.
Analyst’s Disclosure: I/we have no stock, option or similar derivative position in any of the companies mentioned, and no plans to initiate any such positions within the next 72 hours. I wrote this article myself, and it expresses my own opinions. I am not receiving compensation for it (other than from Seeking Alpha). I have no business relationship with any company whose stock is mentioned in this article.
Seeking Alpha's Disclosure: Past performance is no guarantee of future results. No recommendation or advice is being given as to whether any investment is suitable for a particular investor. Any views or opinions expressed above may not reflect those of Seeking Alpha as a whole. Seeking Alpha is not a licensed securities dealer, broker or US investment adviser or investment bank. Our analysts are third party authors that include both professional investors and individual investors who may not be licensed or certified by any institute or regulatory body.