My Dividend Stock Portfolio: New All-Time Dividend Record - 99 Holdings With 25 Buys

Summary
- US stocks ended May with solid gains and extended their strong performance into June, boosted by positive labor market data and the debt ceiling bill's progress.
- My investment activity in May picked up slightly from April, with net investments totaling around $1,555, primarily focused on the financial sector and high-yielding BDCs.
- Dividend income in May 2023 reached a new all-time record of $1,112, up 47% annually and 154% sequentially, driven by strong performances from companies like Hercules Capital Corporation and Allianz.
- Gifted Working Time in 2023: Around 137.8 hours or 17.2 days of active work have been replaced with passive income in 2023, equivalent to more than 3 weeks of work.
Galeanu Mihai
U.S. stocks ended May with solid gains and extending their strong into June after labor market data strengthened bets for a pause in rate hikes at the Federal Reserve's meeting later this month. Also aiding sentiment was the debt ceiling bill crossing the finish line, with U.S. President Biden expected to sign it into law today.
Portfolio Changes in May
Investment activity in May picked up slightly from April but unfortunately the markets seem to have noticed the tremendous opportunities in REITs and BDCs and stock prices of especially the latter asset class have been rising quickly in May and June. As a result buying opportunities continue to fade but even with lower yields I still very much favor BDCs and won't stop buying.
Overall net investments totaled around $1,555 with the majority of those purchases targeted towards the financial sector in general and high-yielding BDCs in particular. I was really surprised to see W. P. Carey (WPC) trade below $70 again for no apparent reason given that their most recently reported earnings and investment activity continue to show the highest quality.
Overall, I did manage to add $122 in forward annual dividend income this month which brings YTD added annual dividend income to around $573 already. My goal is to be able to add at least $100 in forward dividend income every month and as things are developing right now this is a very reasonable and realistic target to achieve and overachieve as long as BDCs remain part of my asset allocation.
All these purchases break down as follows:
Added Dividend Income (Designed by author)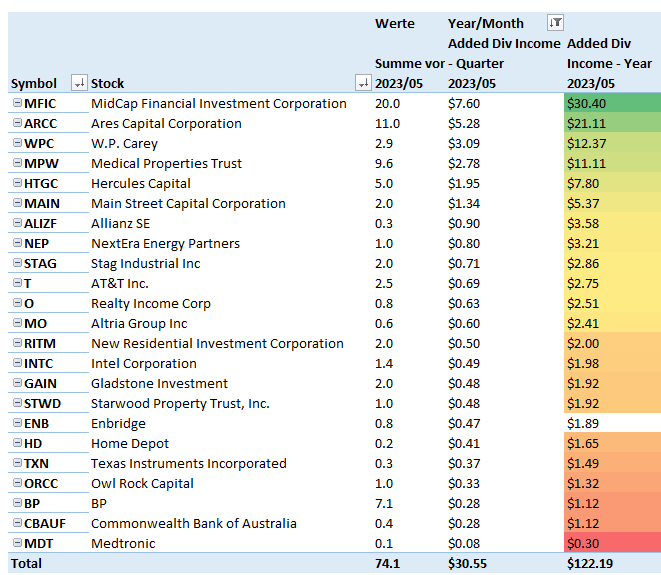
All net purchases in May can be found below:
Net Purchases in May (Designed by author)
Dividend Income May 2023
Dividend income hit a blistering new all-time record of $1,112 and is up an explosive 47% annually and 154% sequentially. Adjusting for annual dividend payments of the previous year the real Y/Y growth rate retreats to an even stronger 62% Y/Y and a similarly strong 76% sequentially.
May features the majority of my annual dividend payers and with both Mercedes Benz and BMW paying record dividends this time in the same month it was always clear that May will set a new dividend record. On top of that my monthly purchases into Allianz over the past year have helped almost double that dividend income again.
Next to the annual dividend payers others notable dividend growth stems from the addition of Hercules Capital Corporation (HTGC) to my portfolio as well as ongoing investments into AbbVie, Blackstone and my monthly dividend payers led by Main Street Capital Corporation (MAIN)
Given no special dividends this month, dividend income from my monthly dividend payers remains below $100 in May but its current baseline of $84.5 is very strong as well and already increased by $1.50 vs. the previous month.
May 2023 Dividend Income (Designed by author)
The dividend income from my top 3 regular dividend payers in May has now reached $211 and the YTD average of $172 is up substantially from the $147 in 2022 which is mainly driven by the rapid rise of dividend income from Hercules Capital Corporation where I managed to snatch almost 200 shares since the beginning of this year.
All this is depicted below:
Top 3 Dividend Payers (Designed by author)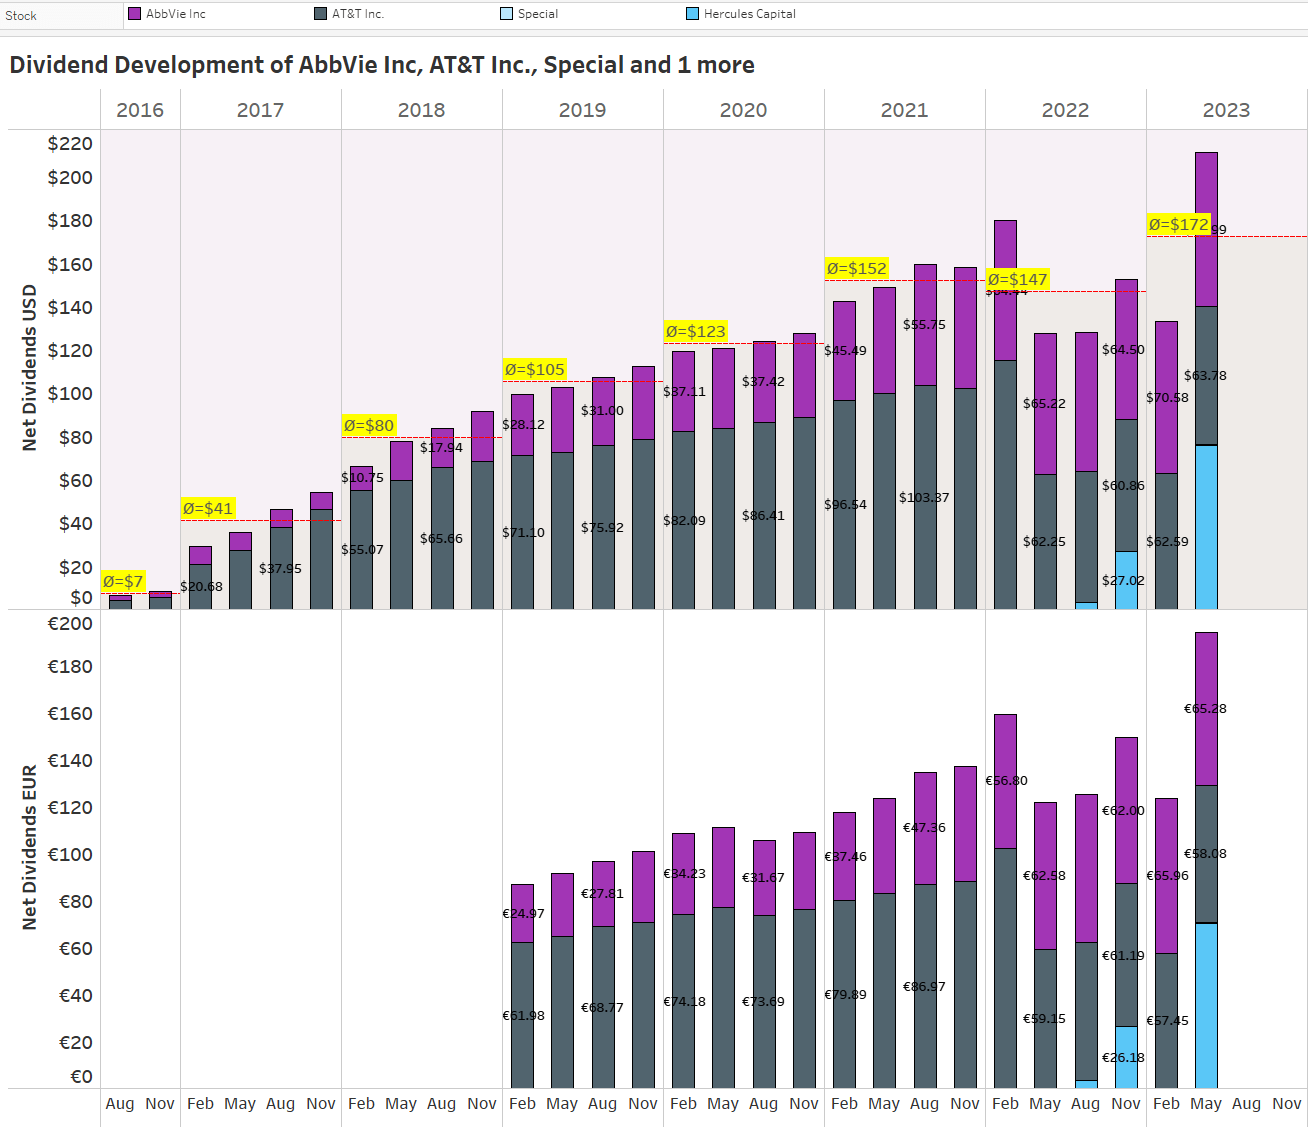
Here is a chart that shows the development of my net dividend income by month over time between 2015 and 2023. You can see the growth of my dividend income and the average annual dividend for each year:
All-time Dividend Development (Designed by author)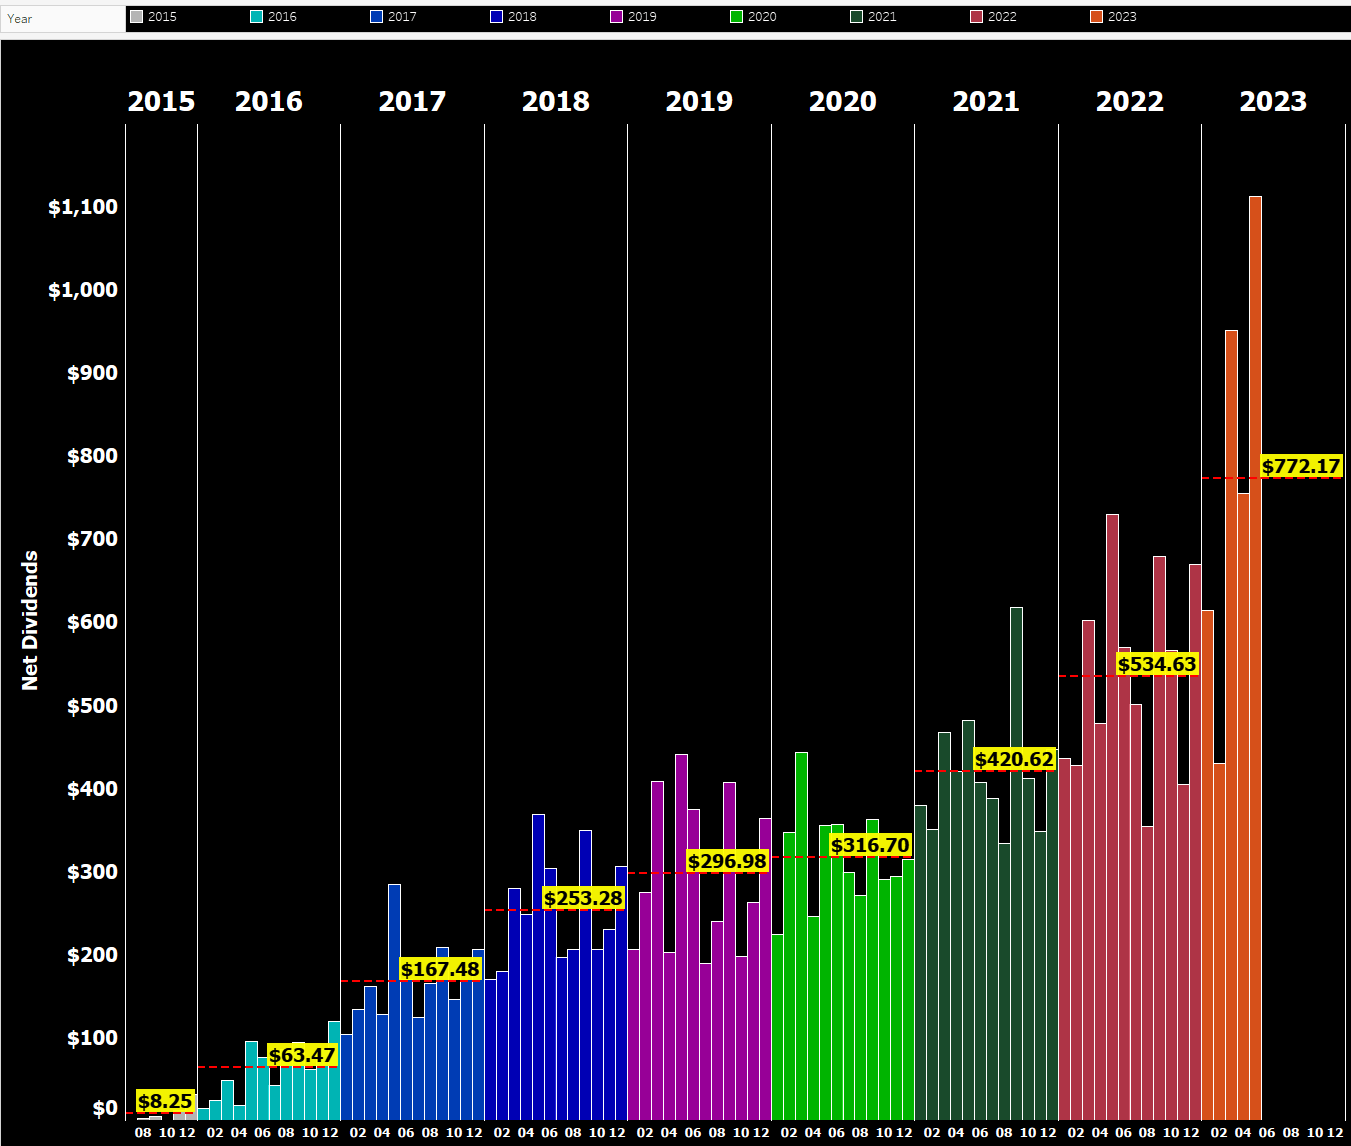
This chart is my favorite because it illustrates the progression of my dividend income over time and allows me to easily see the average annual dividend for each year.
Next, I have plotted all of the individual dividend payments I have received, coloring them by year and arranging the years side by side instead of horizontally as in previous updates. This visualization allows for a more comprehensive analysis of the distribution of my dividend payments over time.
Dividend Payment Bubbles (Designed by author)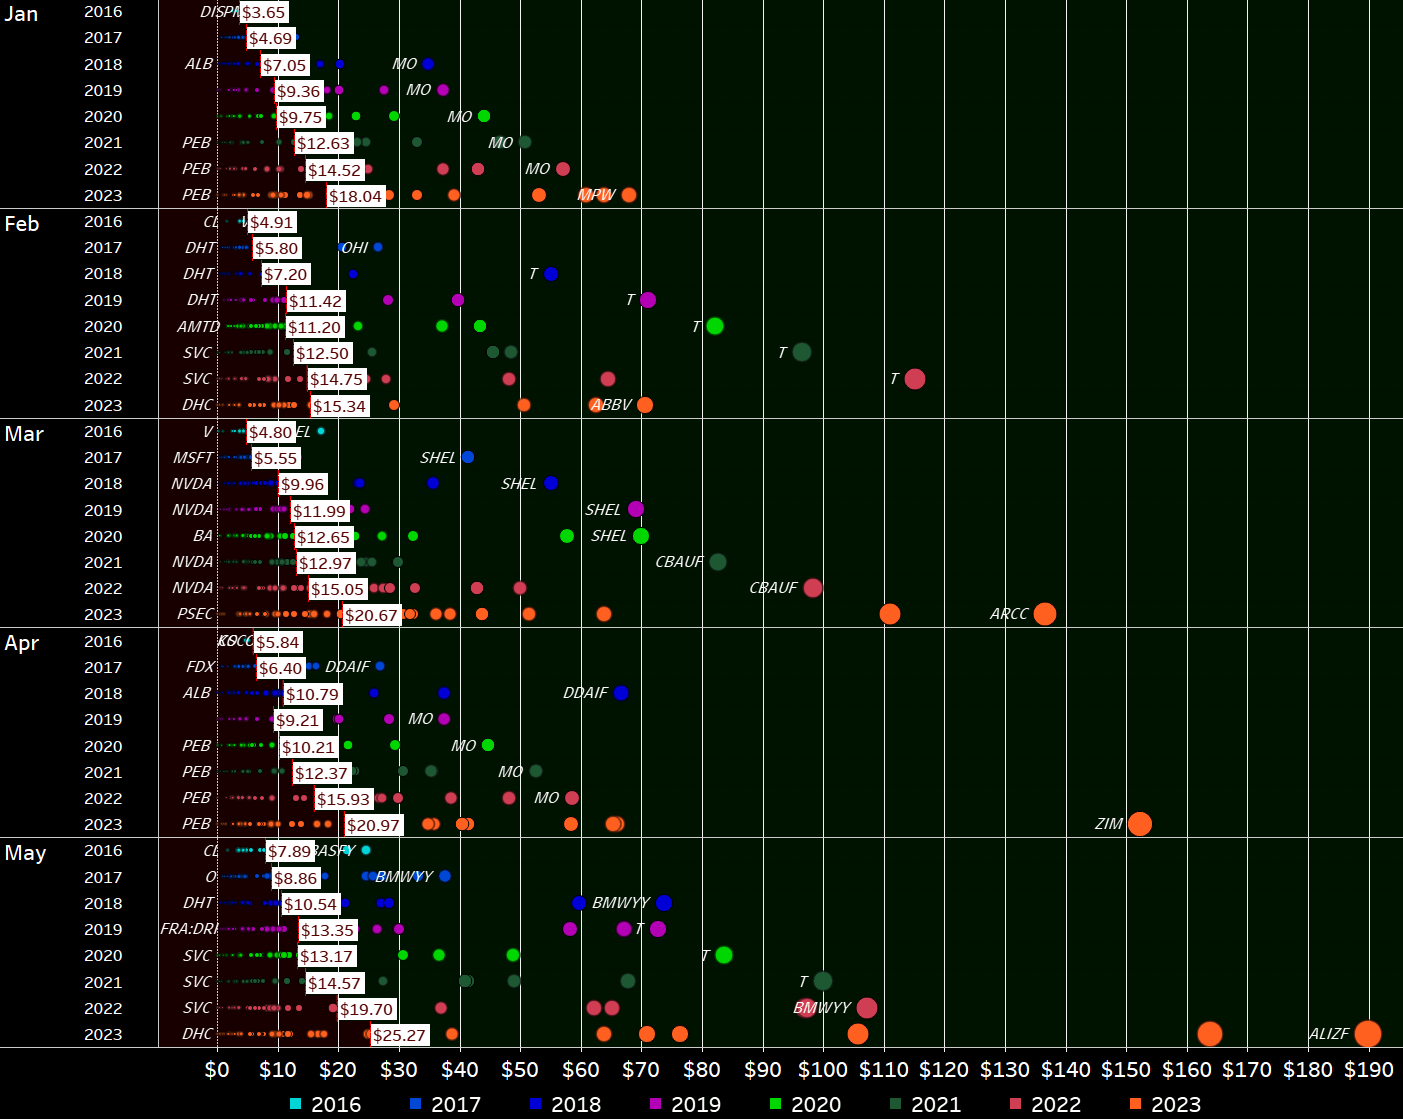
By plotting the data in this way, we can easily see the distribution of dividend payments across different years and gain insights into the overall growth of my dividend income over time.
This visualization is initially quite cluttered, but it contains a wealth of information. It shows every individual dividend payment I have received since I began my investment journey in 2015, represented as a circle that is colored and sized according to its contribution. The view is organized by month and year, allowing for a more comprehensive analysis of the development of my dividend income over time. For each year and month, a white rectangle indicates the average monthly dividend. The area where dividends fall below the average is filled in dark red, while the area above the average is colored dark green. I greatly prefer this redesigned version of my old "bubbles chart" because it makes it much easier to identify trends and developments in my dividend income. This type of data visualization allows for a detailed examination of the distribution of my dividend payments over time and enables me to more easily identify trends and patterns in my income growth.
May 2023 Dividends (Designed by author)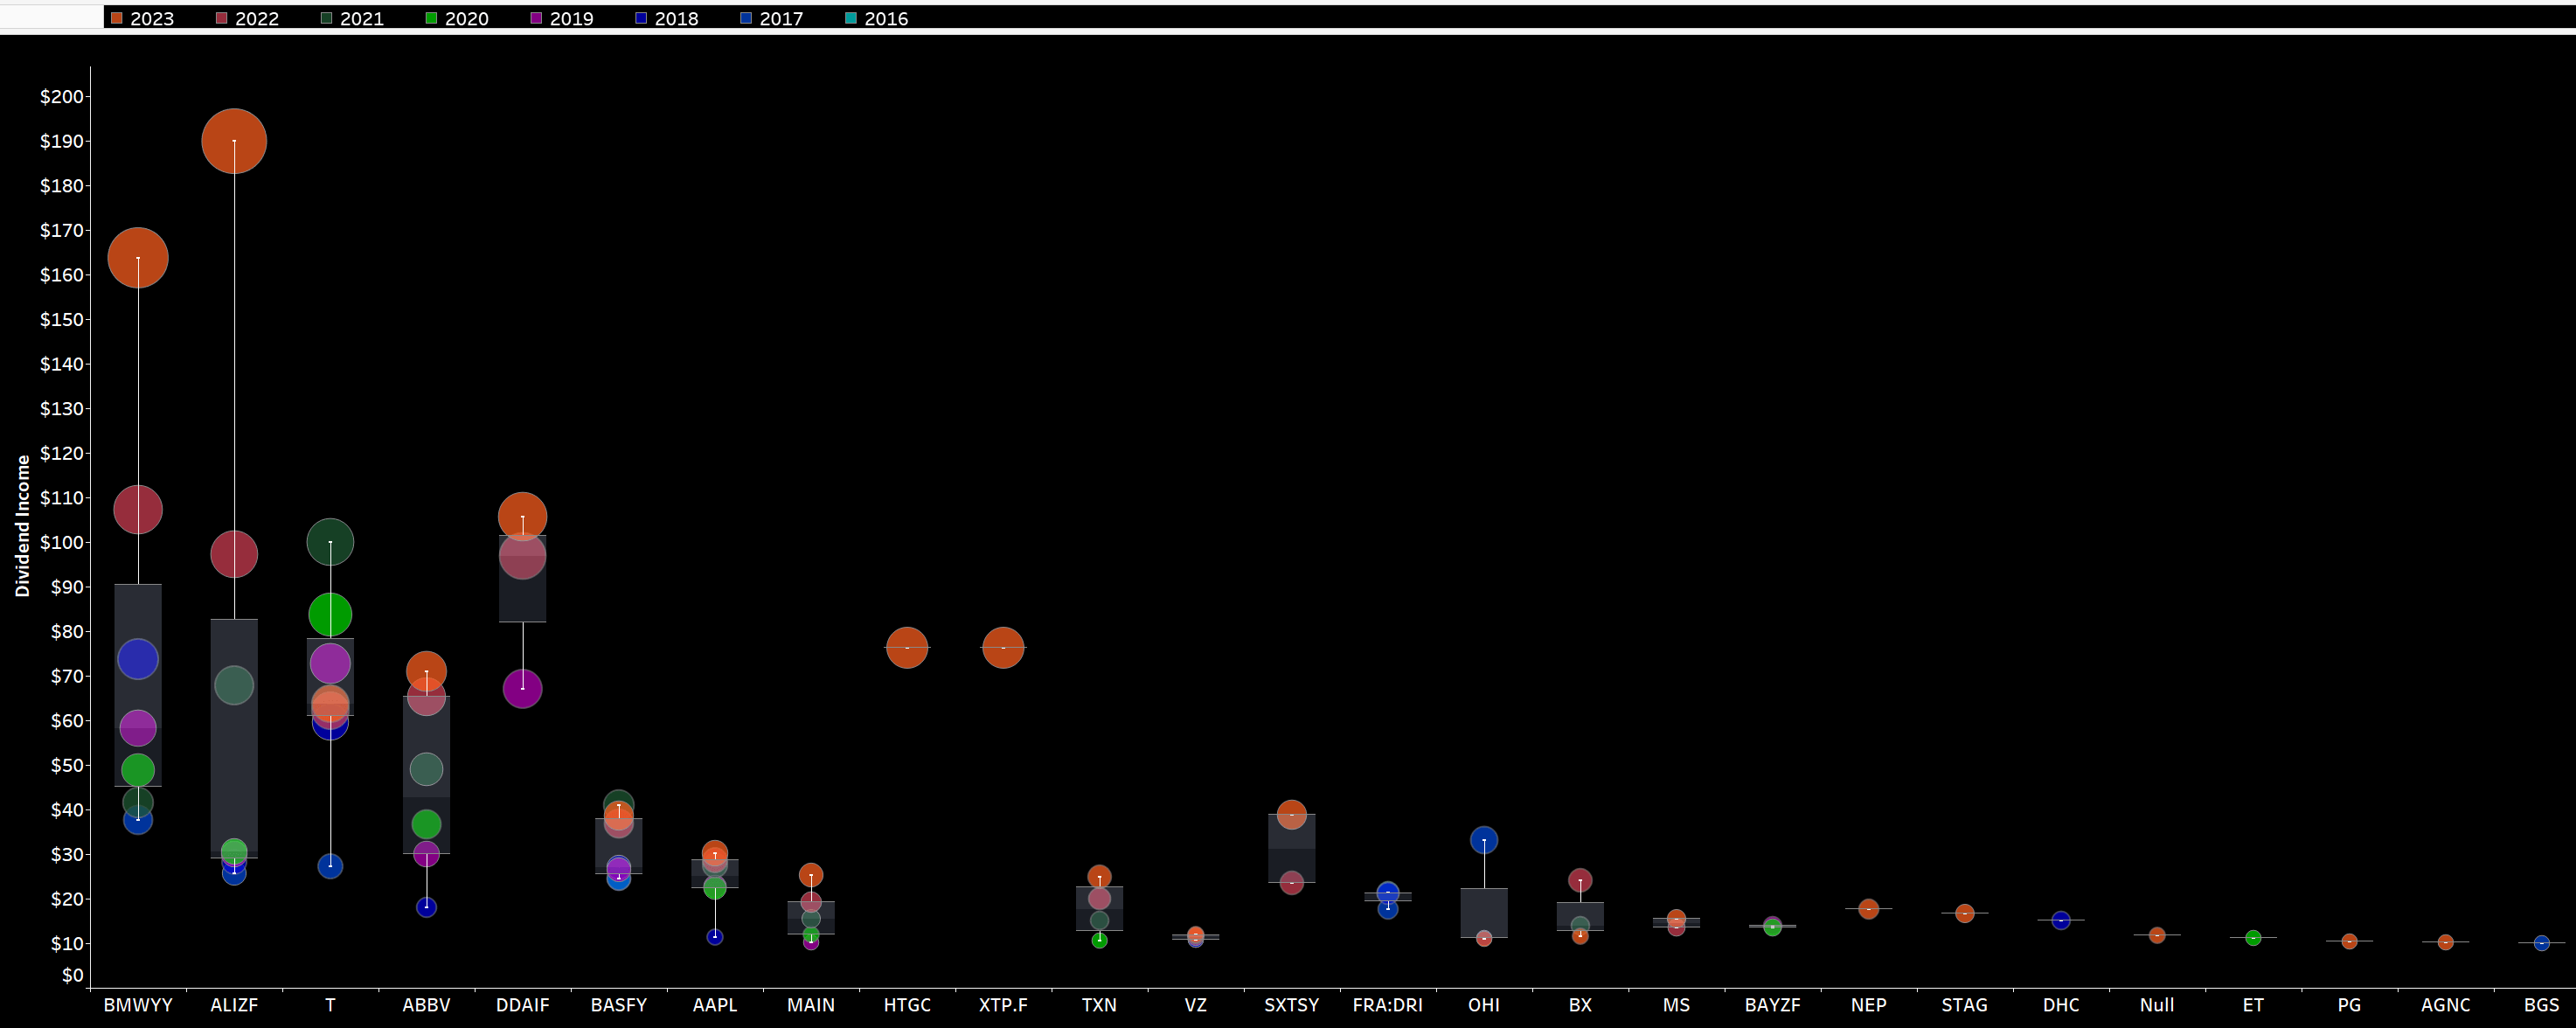
Now zooming in on May, we can immediately spot several large circles in different colors amidst a sea of black. The size of each circle and the gap between consecutive circles representing the same stock indicate the magnitude of the change in dividend income compared to previous years.
The most striking observation are obviously the four big orange circles from my German annual dividend payers and the visually easily decipherable massive dividend from HTGC.
Beyond that I notice mostly orange circles at the top of the scale, which is exactly what I want to see with the notable exceptions for AT&T (after the massive dividend cut a year ago my dividend income is a far cry from what it used to be in 2021) and Omega Healthcare Investors (OHI) where I held a sizable position in 2017 which was then massively reduced before buying back into the stock last year. These big orange circles represent a rising dividend income, and my goal is to have as many of them as possible at the top of the chart.
Overall, my aim is to observe numerous large orange circles positioned at the highest point on the scale. This signifies a positive trend of increasing dividend income, which is precisely what I'm striving for.
Another way to express the monthly dividend income is in terms of Gifted Working Time (GWT). Assuming an average hourly rate of $32.34 for 2023, my GWT and annual net dividends have been as follows:
- 2018: 121 hours GWT, $3,000 in annual net dividends
- 2019: 142 hours GWT, $3,600 in annual net dividends
- 2020: 152 hours GWT, $3,800 in annual net dividends
- 2021: 180 hours GWT, $5,050 in annual net dividends
- 2022: 229 hours GWT, $6,400 in annual net dividends
- 2023: Targeting at least 216 hours GWT, $7,000 in annual net dividends
I expect overall GWT to decrease in 2023 due to higher calculated hourly rates, as I project a 10% increase in the hourly rate due to inflation.
The overall target for the year with $7,000 in annual net dividends is very conservative but I expect that I will have to take out some risk from my portfolio as mentioned above. Also, the stronger Euro (I am receiving dividends in EUR and then converting those to USD at current exchange rates for these updates) will have adverse impact. Still, as the year unfolds I expect to be able to pass that target and potentially even reach my next milestone of $8,000 as well. By the end of May 2023 my realized dividend income has been blowing away my expectations by several dimensions with YTD net dividend growth coming in at a sizzling and unsustainable 44% Y/Y. That growth will certainly come down substantially as the year unfolds but given I am only targeting a low single-digit growth rate, it is already clear that barring a major disaster I will easily achieve a double-digit growth rate in dividend income which is fantastic.
Across the years, my YTD Dividend Race has been as follows:
- 2018: Disappointing
- 2019: Phenomenal, benefiting from a low baseline in the prior year
- 2020: Fairly disappointing
- 2021: Phenomenal
- 2022: Much better than expected fueled by the very weak euro
- 2023: Targeting a conservative low single-digit growth rate (the more likely scenario is now a 10-15% increase in dividend income, possibly even 20%+)
YTD Dividend Growth (Designed by author)
I have updated the YTD Dividend Race chart to show the development of YTD dividend income on a daily basis, allowing us to see that most of my dividend income is generated mid-month and towards the end of the month. The chart also breaks down the development by month for the current year, making it easy to identify significant jumps in income.
YTD Dividend Race (Designed by author)
Expressed in GWT, it presents itself as follows:
Gifted Working Time in Hours (Designed by author)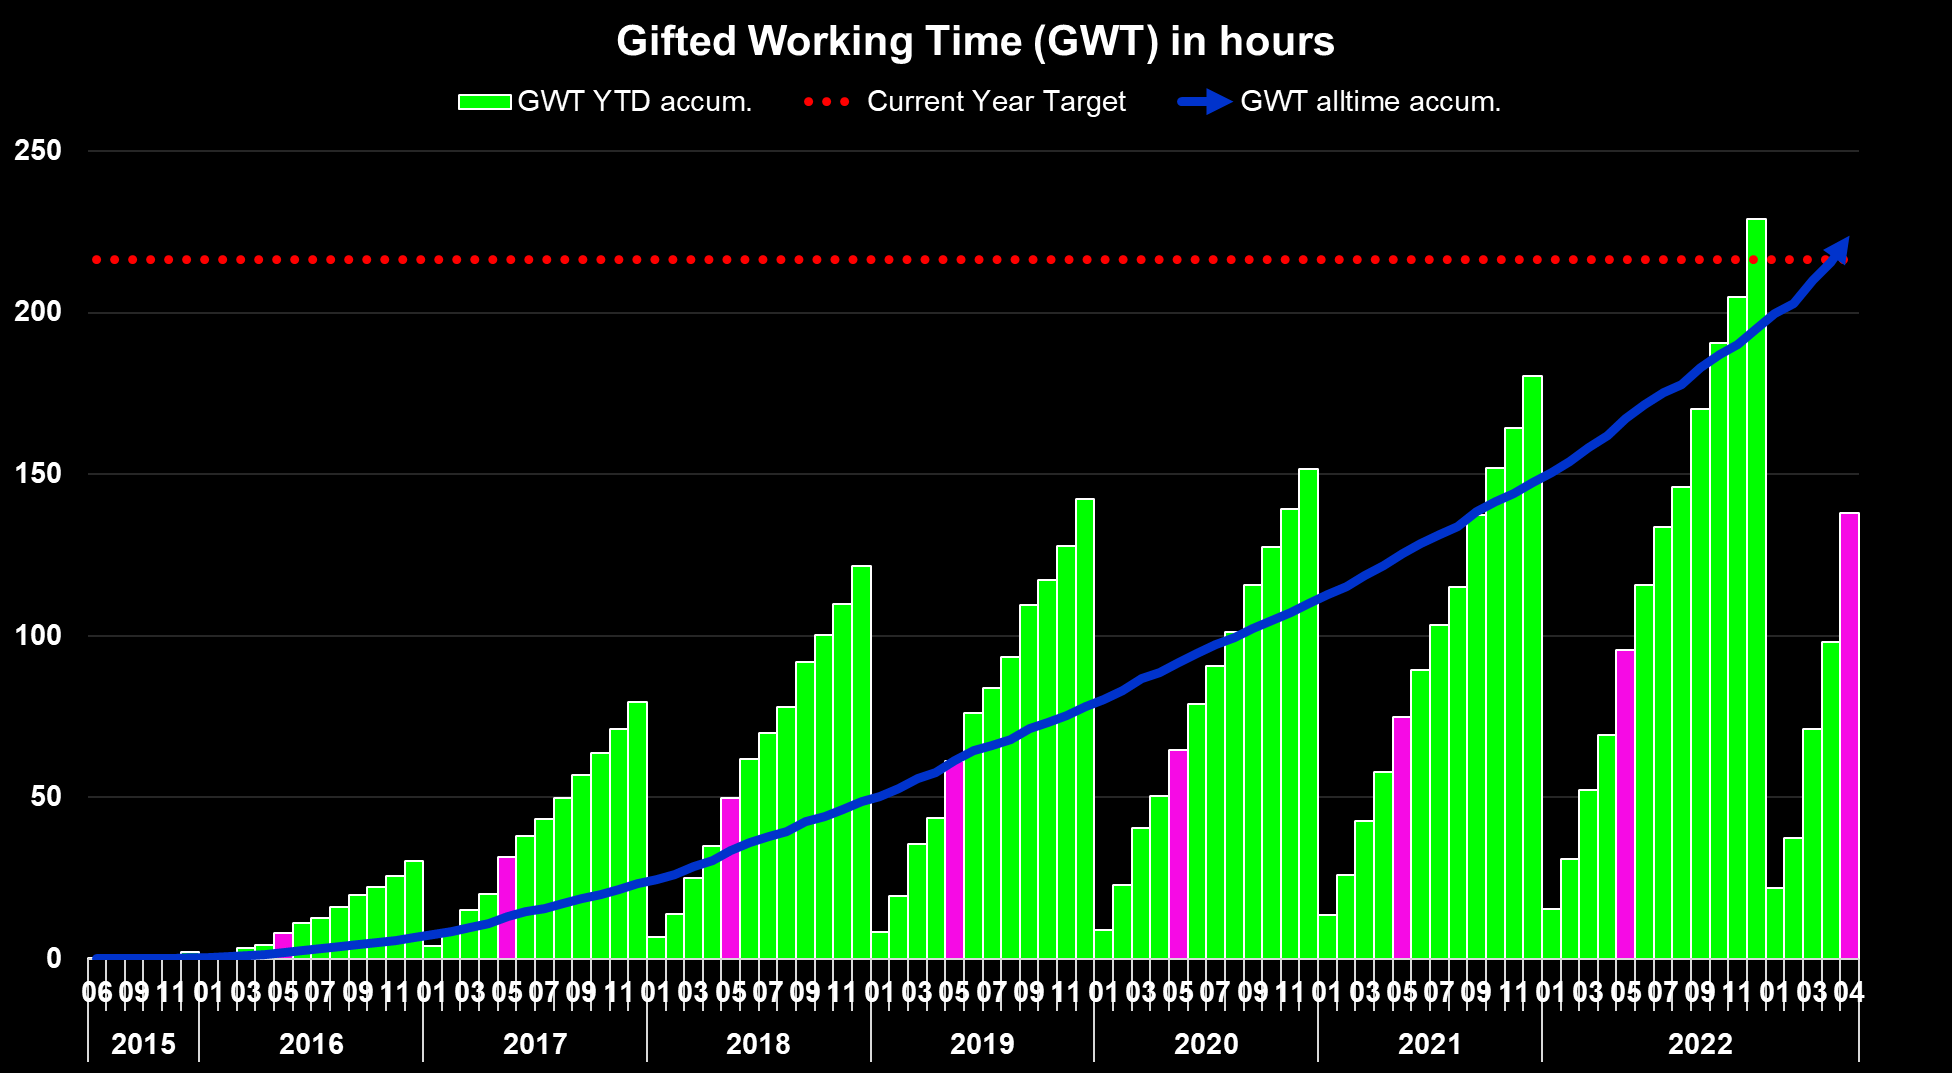
What this shows is as follows:
- All time (blue area) - Around 1,074 hours, or 134 days, of active work have been replaced with passive income since the start of my dividend journey. Assuming a five-day workweek, this translates into almost 27 weeks of vacation funded via dividends which itself is equal to more than half a year.
- Full-year 2023 (green bars) - Around 137.9 hours, or 17.2 days, of active work have been replaced with passive income in 2023 already, which is almost three-and-a-half full-time work weeks funded with dividends.
- Highlighted in pink is the accumulated YTD total at the end of the current reporting month (May).
This visualization allows us to see the overall impact of my dividend income on the amount of active work I am able to replace with passive income. It also enables us to see the progress made year-to-date, as well as the accumulated total at the end of the current reporting month.
Upcoming June Dividends
With June marking the end of the quarter, this will traditionally be a strong month in terms of dividend income. Among others, further big dividend payers from my portfolio in March are Royal Dutch Shell (SHEL), BP (BP), McDonald's (NYSE:MCD), Johnson & Johnson (NYSE:JNJ), Southern Company (NYSE:SO) and Ares Capital Corporation (ARCC) of which 4 companies are part of my regular monthly savings plans.
The snapshot below is taken from my free-for-all released Dividend Calendar (make sure to follow instructions in the video) and shows my expected dividend payments in June .
My Dividend Calendar (Designed by author)
At the end of May, my dividend portfolio is composed as follows:
| Company Name | Ticker | % Market Value | Market Value (€) |
| Apple Inc. | (AAPL) | 12.05% | 24,881 |
| Visa Inc | (V) | 4.20% | 8,668 |
| Microsoft Corporation | (MSFT) | 3.95% | 8,150 |
| McDonald's Corp | (MCD) | 3.78% | 7,797 |
| AbbVie Inc | (ABBV) | 3.36% | 6,936 |
| NVIDIA Corporation | (NVDA) | 2.92% | 6,021 |
| Ares Capital Corporation | (ARCC) | 2.78% | 5,744 |
| Cisco Systems, Inc. | (CSCO) | 2.72% | 5,626 |
| STAG Industrial Inc | (STAG) | 2.34% | 4,842 |
| W.P. Carey | (WPC) | 2.33% | 4,822 |
| Commonwealth Bank of Australia | (OTCPK:CBAUF) | 2.33% | 4,811 |
| Johnson & Johnson | (JNJ) | 2.24% | 4,635 |
| Main Street Capital Corporation | (MAIN) | 2.22% | 4,578 |
| Shell | (SHEL) | 1.99% | 4,100 |
| JPMorgan Chase & Co. | (JPM) | 1.92% | 3,959 |
| AT&T Inc. | (T) | 1.91% | 3,943 |
| Texas Instruments Incorporated | (TXN) | 1.81% | 3,741 |
| Home Depot | (HD) | 1.69% | 3,496 |
| Southern Co | (SO) | 1.60% | 3,308 |
| Altria Group Inc | (MO) | 1.60% | 3,307 |
| Allianz SE | (OTCPK:ALIZF) | 1.60% | 3,301 |
| Gilead Sciences, Inc. | (GILD) | 1.55% | 3,199 |
| Broadcom Inc | (AVGO) | 1.45% | 3,000 |
| Wells Fargo & Co | (WFC) | 1.45% | 2,985 |
| Toronto-Dominion Bank | (TD) | 1.42% | 2,925 |
| Bank of Nova Scotia | (BNS) | 1.30% | 2,693 |
| Siemens Healthineers | (OTCPK:SEMHF) | 1.28% | 2,650 |
| Hercules Capital | (HTGC) | 1.25% | 2,585 |
| New Residential Corporation | (RITM) | 1.17% | 2,408 |
| BMW | (OTCPK:BMWYY) | 1.15% | 2,376 |
| Blackstone Group LP | (BX) | 1.11% | 2,300 |
| Enbridge | (ENB) | 1.05% | 2,176 |
| Intel Corporation | (INTC) | 0.99% | 2,050 |
| PepsiCo, Inc. | (PEP) | 0.96% | 1,981 |
| Morgan Stanley | (MS) | 0.89% | 1,846 |
| Procter & Gamble Co | (PG) | 0.85% | 1,747 |
| Apollo Investment | (MFIC) | 0.82% | 1,698 |
| BP2 | (BP) | 0.81% | 1,672 |
| BP1 | (BP) | 0.73% | 1,518 |
| Philip Morris International Inc. | (PM) | 0.72% | 1,492 |
| Honeywell International Inc. | (HON) | 0.71% | 1,469 |
| Daimler | (OTCPK:MBGAF) | 0.69% | 1,420 |
| Realty Income Corp | (O) | 0.68% | 1,399 |
| Starwood Property Trust, Inc. | (STWD) | 0.66% | 1,369 |
| Brookfield Renewable Partners | (BEP) | 0.65% | 1,338 |
| NextEra Energy Partners LP | (NEP) | 0.63% | 1,303 |
| Medical Properties Trust | (MPW) | 0.60% | 1,247 |
| Bank of America Corp | (BAC) | 0.60% | 1,230 |
| The Coca-Cola Co | (KO) | 0.54% | 1,118 |
| Stryker | (SYK) | 0.52% | 1,081 |
| Unilever NV ADR | (UL) | 0.50% | 1,034 |
| Gladstone Commercial Corporation | (GOOD) | 0.49% | 1,011 |
| Target Corporation | (TGT) | 0.48% | 993 |
| 3M Co | (MMM) | 0.44% | 919 |
| Annaly Capital Management | (NLY) | 0.44% | 912 |
| Royal Bank of Canada | (RY) | 0.42% | 863 |
| Apple Hospitality REIT | (APLE) | 0.42% | 861 |
| CVS Health Corp | (CVS) | 0.39% | 815 |
| Dominion Energy Inc | (D) | 0.35% | 724 |
| Gladstone Investment | (GAIN) | 0.35% | 716 |
| Medtronic | (MDT) | 0.34% | 703 |
| Spirit Realty Corporation | (SRC) | 0.34% | 702 |
| Verizon Communications Inc. | (VZ) | 0.34% | 700 |
| Sino AG | (XTP.F) | 0.33% | 690 |
| Gladstone Capital | (GLAD) | 0.33% | 672 |
| BASF | (OTCQX:BASFY) | 0.32% | 658 |
| Canadian Imperial Bank of Commerce | (CM) | 0.31% | 641 |
| AGNC Investment Corporation | (AGNC) | 0.29% | 608 |
| B&G Foods, Inc. | (BGS) | 0.29% | 595 |
| NextEra Energy | (NEE) | 0.28% | 587 |
| Exxon Mobil Corporation | (XOM) | 0.28% | 586 |
| Antero Midstream Corporation | (AM) | 0.27% | 553 |
| Pfizer Inc. | (PFE) | 0.24% | 502 |
| Kinder Morgan Inc | (KMI) | 0.23% | 473 |
| Apollo Commercial Real Est. Finance Inc | (ARI) | 0.23% | 470 |
| Vonovia | (OTCPK:VONOY) | 0.20% | 414 |
| SIXT | (OTC:SXTSY) | 0.20% | 408 |
| Alibaba Group Holding Ltd | (BABA) | 0.20% | 405 |
| Walgreens Boots Alliance Inc | (WBA) | 0.20% | 404 |
| Mastercard | (MA) | 0.18% | 375 |
| ZIM Integrated Shipping Services | (ZIM) | 0.18% | 375 |
| Colgate-Palmolive Company | (CL) | 0.17% | 353 |
| Omega Healthcare Investors Inc | (OHI) | 0.16% | 340 |
| BRT Realty Trust | (BRT) | 0.15% | 313 |
| Bayer AG | (OTCPK:BAYZF) | 0.15% | 312 |
| Blue Owl Capital | (OWL) | 0.07% | 154 |
| Fresenius SE | (OTCPK:FSNUF) | 0.07% | 145 |
| Boeing | (BA) | 0.07% | 143 |
| Equitrans Midstream Corporation | (ETRN) | 0.06% | 126 |
| Walt Disney Co | (DIS) | 0.04% | 86 |
| Owl Rock Capital Corporation | (ORCC) | 0.04% | 83 |
| Bank of Montreal | (BMO) | 0.04% | 82 |
| Fresenius Medical Care | (FMS) | 0.04% | 82 |
| Diversified Healthcare Trust | (DHC) | 0.04% | 80 |
| Uniti Group Inc | (UNIT) | 0.04% | 75 |
| Newtek Business Services | (NEWT) | 0.03% | 70 |
| The GEO Group Inc | (GEO) | 0.02% | 51 |
| Service Properties Trust | (SVC) | 0.02% | 42 |
Editor's Note: This article discusses one or more securities that do not trade on a major U.S. exchange. Please be aware of the risks associated with these stocks.
This article was written by

Analyst’s Disclosure: I/we have a beneficial long position in the shares of ALL STOCKS MENTIONED either through stock ownership, options, or other derivatives. I wrote this article myself, and it expresses my own opinions. I am not receiving compensation for it (other than from Seeking Alpha). I have no business relationship with any company whose stock is mentioned in this article.
I am not offering financial advice but only my personal opinion. Investors may take further aspects and their own due diligence into consideration before making a decision.
Seeking Alpha's Disclosure: Past performance is no guarantee of future results. No recommendation or advice is being given as to whether any investment is suitable for a particular investor. Any views or opinions expressed above may not reflect those of Seeking Alpha as a whole. Seeking Alpha is not a licensed securities dealer, broker or US investment adviser or investment bank. Our analysts are third party authors that include both professional investors and individual investors who may not be licensed or certified by any institute or regulatory body.