QUAL: An Interesting Case Of High Quality But Mixed Results

Summary
- The iShares MSCI USA Quality Factor ETF (QUAL) focuses on highly profitable firms with strong balance sheets, but its historical performance has been underwhelming compared to alternatives like the Vanguard S&P 500 ETF (VOO) and Schwab U.S. Dividend Equity ETF (SCHD).
- QUAL's top holdings include prominent companies like Apple, Microsoft, and NVIDIA, which command higher multiples than the rest of the market, but this has not translated to better risk-adjusted returns.
- Investors considering QUAL should weigh their views on the valuations of these top holdings, as their future performance will likely have a significant impact on the ETF's overall performance.
- Looking for a portfolio of ideas like this one? Members of Hoya Capital Income Builder get exclusive access to our subscriber-only portfolios. Learn More »
Dilok Klaisataporn/iStock via Getty Images
(This article was co-produced with Hoya Capital Real Estate.)
In this article, I will take my first-ever look at iShares MSCI USA Quality Factor ETF (BATS:QUAL). As I do, I think you will see why I selected the title that I did. As I tend to do with the ETFs I select to review, I took a look at this ETF both in terms of the overall historical picture of its performance as well as how I feel about it at this particular point in time.
Let's start, then, by digging into some of the particulars about this ETF, and then I will discuss both its historical performance as well as my current outlook.
iShares MSCI USA Quality Factor ETF: Digging In
From a quality standpoint, there is much to like about this ETF. Certainly, it is worthy of consideration as an element of one's portfolio.
Its parent firm, BlackRock (BLK) is one of the preeminent firms in the industry. With roughly $8 trillion in assets under management as of September 30, 2022, it has tremendous scale and influence. Its iShares lineup of ETFs offers multiple ETFs which investors can use to build fully-diversified, extremely low-cost, portfolios.
QUAL certainly takes its place in that lineup. With an inception date of 7/16/13, QUAL will celebrate its 10th anniversary less than a month from now. According to Seeking Alpha's home page for QUAL, it currently boasts an AUM of $30.31 billion. It carries an expense ratio of .15% and a tiny trading spread of .01%. While this expense ratio is slightly higher than several funds that could be considered competition, this is not to the extent where it would disqualify the fund from at least being worthy of careful examination.
Let's next talk about the fund's selection criteria. The Fund seeks to track the investment results of the MSCI USA Sector Neutral Quality Index, which in turn is a subset of the MSCI USA Index. This index contains U.S. large- and mid-capitalization stocks, as defined by MSCI.
Here, from QUAL's prospectus, is how this subset is defined:
The Underlying Index seeks to measure the performance of securities in the Parent Index that exhibit higher quality characteristics relative to their peers within the corresponding Global Industry Classification Standard (GICS®) sector. To construct the Underlying Index, the Index Provider determines the quality score of each security in the Parent Index based on three fundamental variables: high return on equity, low earnings variability, and low leverage. The Underlying Index is weighted based on a component's quality score multiplied by its weight in the Parent Index. Weights in the Underlying Index are next normalized so that sectors in the Underlying Index represent the same weight as in the Parent Index. Additionally, each individual issuer is capped at 5%.
Allow me to try to simplify all of that just a little. Essentially, this fund focuses on highly profitable firms with strong balance sheets.
It does so by seeking mid- and large-cap companies that exhibit 1) High profitability, 2) Low leverage, and 3) Stable recent earnings growth. Taken together, the three measures are scored against sector peers to arrive at a composite quality score. Finally, all of this is evaluated against the sector weightings in the parent index, such that the fund remains appropriately diversified.
In theory, then, this focus would be expected to result in lower volatility and higher risk-adjusted returns than the baseline index from which these stocks are selected.
At the same time, such quality stocks typically are more 'expensive' than other stocks in the market, as they command higher multiples.
And therein lies the dilemma. Does the particular focus of this ETF actually achieve those goals of lower volatility and higher risk-adjusted returns?
We'll take a look at this question in the next section.
QUAL's Performance: Where The Rubber Meets The Road
In the previous section, I shared extensive detail with respect to QUAL's selection criteria.
In the excellent graphic below, from Seeking Alpha's landing page for QUAL linked earlier in the article, let's see how this plays out in real life.
QUAL: Portfolio Characteristics (Seeking Alpha)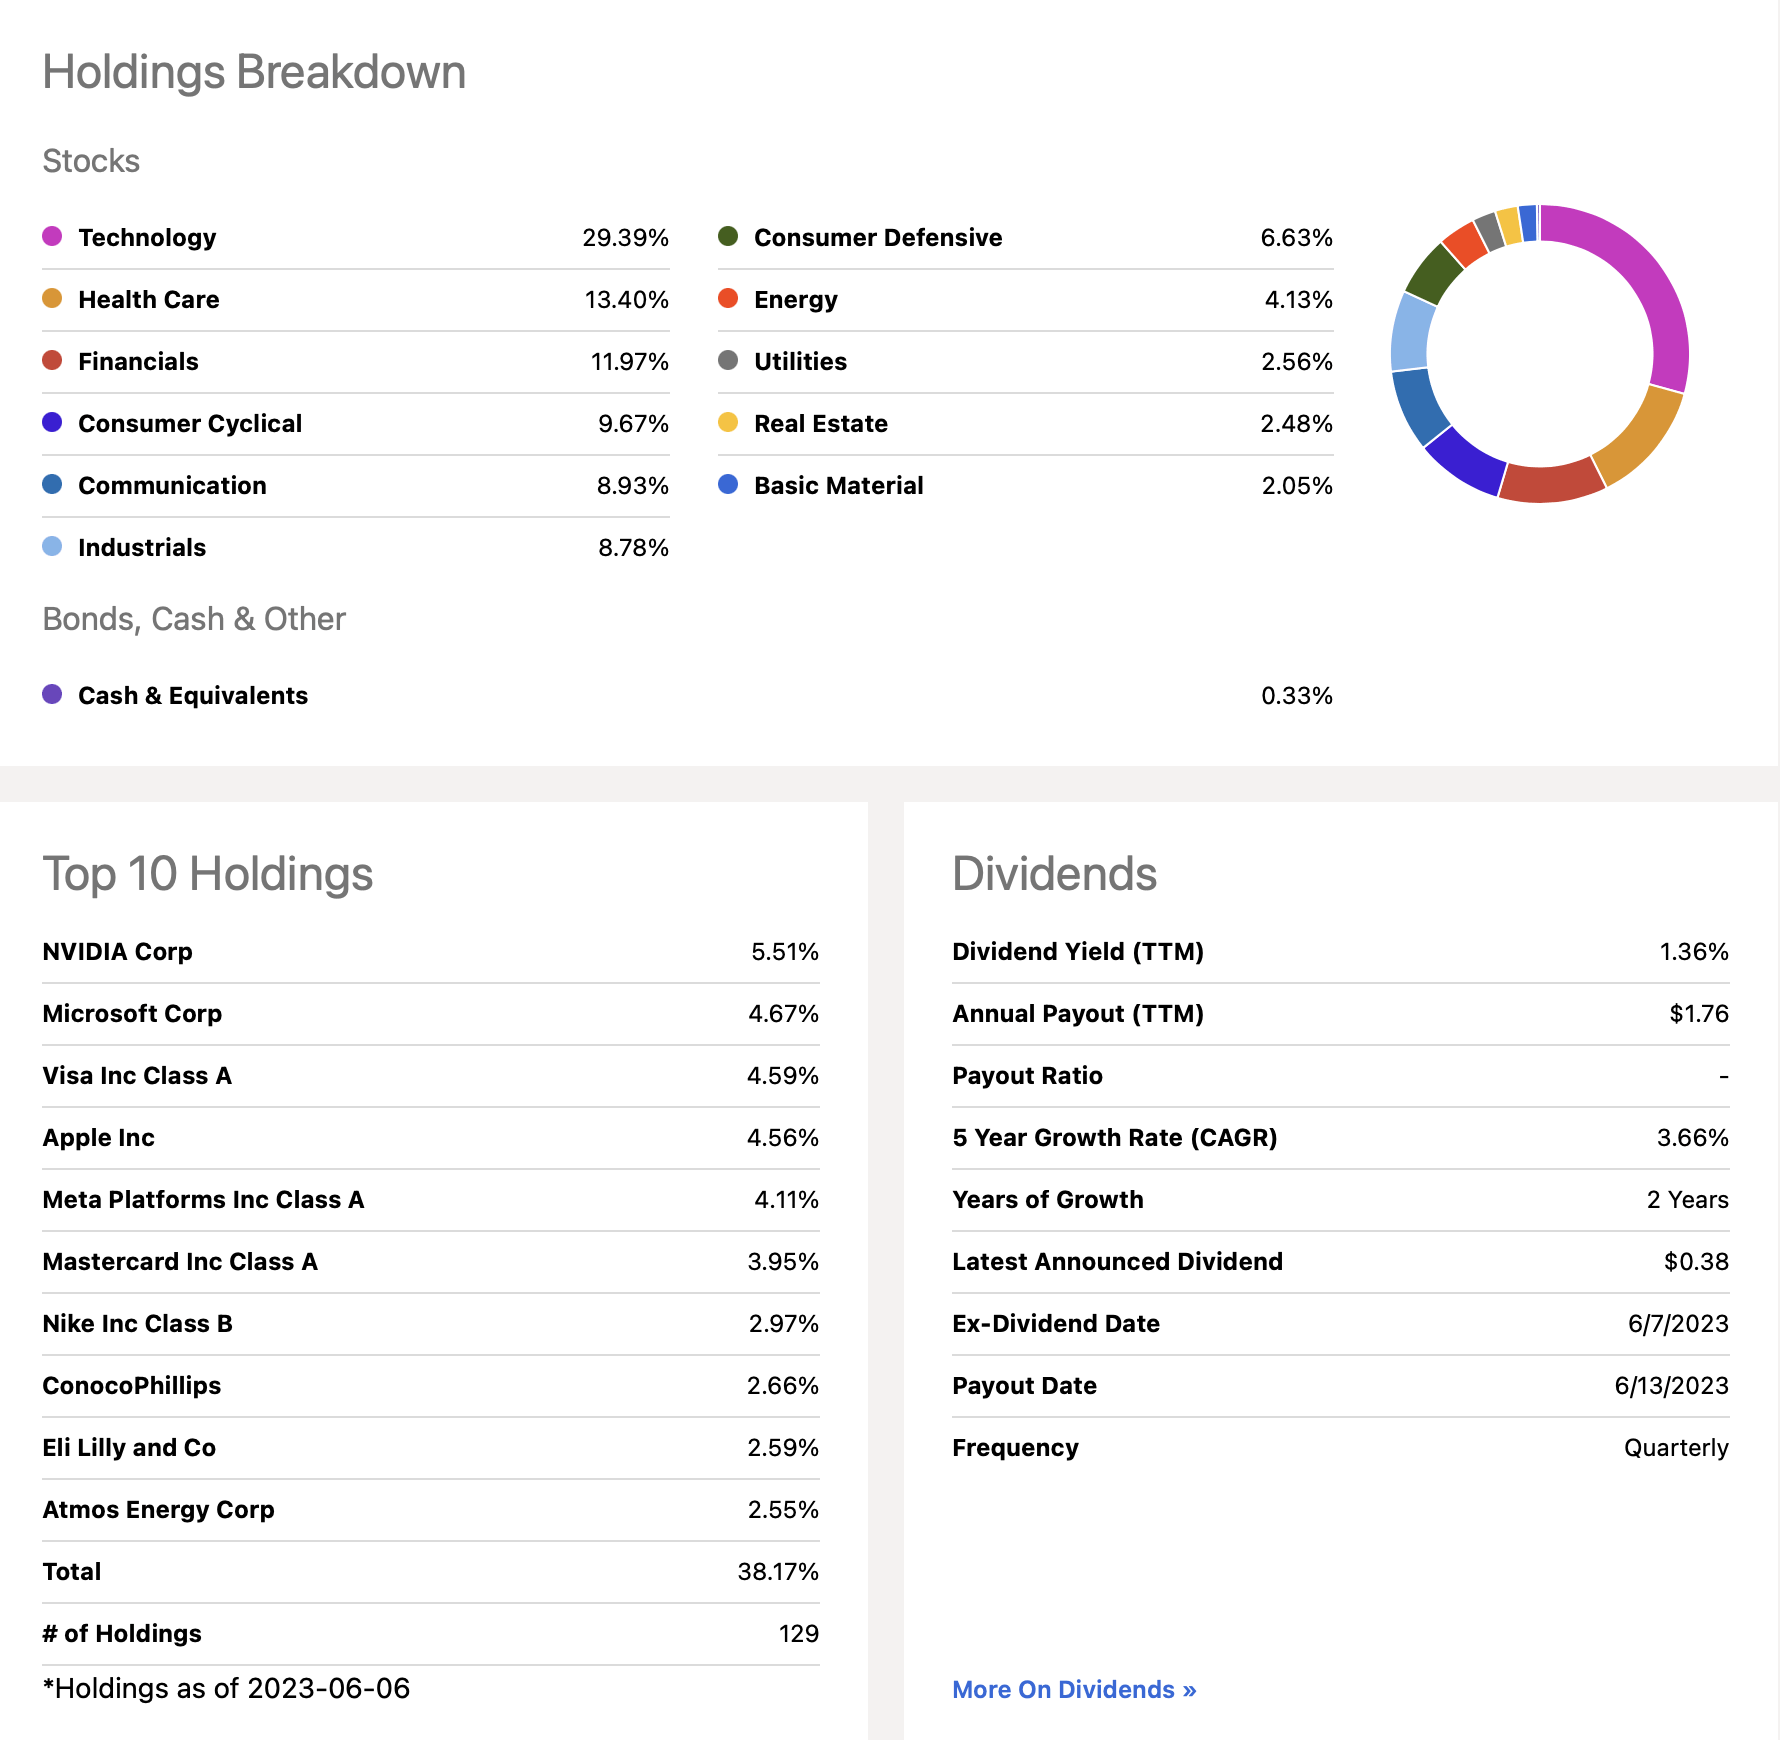
Let's start by looking at QUAL's Top 10 holdings. It's quite a list, isn't it? In the last section, I mentioned that QUAL's holdings tend to command higher multiples than the rest of the market. Looking at the prominent position of companies such as Apple (AAPL), Microsoft (MSFT), and Visa (V) in that Top 10 list, one can see that this is definitely the case. And then there is NVIDIA Corp (NVDA), which has recently soared to be QUAL's top holding. More on that later.
Clearly, these are special companies. In their respective fields, they enjoy durable competitive advantages and enviable market position and share. According to a recent Morningstar report that I reviewed, more than 60% of QUAL's holdings boast a wide Morningstar Economic Moat Rating, some 15% higher than the overall parent index.
At the same time, while the index has rules built in to keep sectors from getting too widely out of balance, concentration can become somewhat of a risk. As an example, while not wildly out of line, QUAL's current weighting of 29.39% in the Technology sector is moderately higher than the current 27.98% weighting in the S&P 500. Put another way, Technology is already the top-weighted sector in the S&P 500, and becomes even more stretched in QUAL.
Still, as you ponder everything I wrote in the last few paragraphs, your intuitive sense might be that QUAL would truly be a star performer. High-quality companies with wide moats, and low debt ratios sound like a winning combination.
Unfortunately, over time, this has simply not proved to be the case. To get some idea where QUAL sits competitively, I performed a backtest using Vanguard S&P 500 ETF (VOO) and Schwab U.S. Dividend Equity ETF (SCHD) as comparison points. Now, it is true that neither of these represents perfect apples-to-apples comparisons. At the same time, these are two alternatives that could be considered that sport even lower expense ratios than QUAL, with VOO tracking the S&P 500 at a rock-bottom .03% and SCHD offering a time-tested set of quality filters at an expense ratio of .06%.
My question, then, was, is there anything I can discern about QUAL that would lead me to select it over VOO, SCHD, or two other options I recently reviewed?
Long story short, I started with a backtest that took me as far back as I could go, from 2014 to the present, with QUAL's 2013 inception date being the limiting factor. The answer I came to was "no." Over that span, both VOO and SCHD edged out QUAL in terms of risk-adjusted returns.
For purposes of this article, however, I tightened the backtest up a little bit to only include the period from 2019 to the present. This was because I noticed it was during this period that QUAL's strengths and weaknesses became most prominently manifest.
QUAL, VOO, SCHD: 2019-Present Backtest (PortfolioVisualizer.com)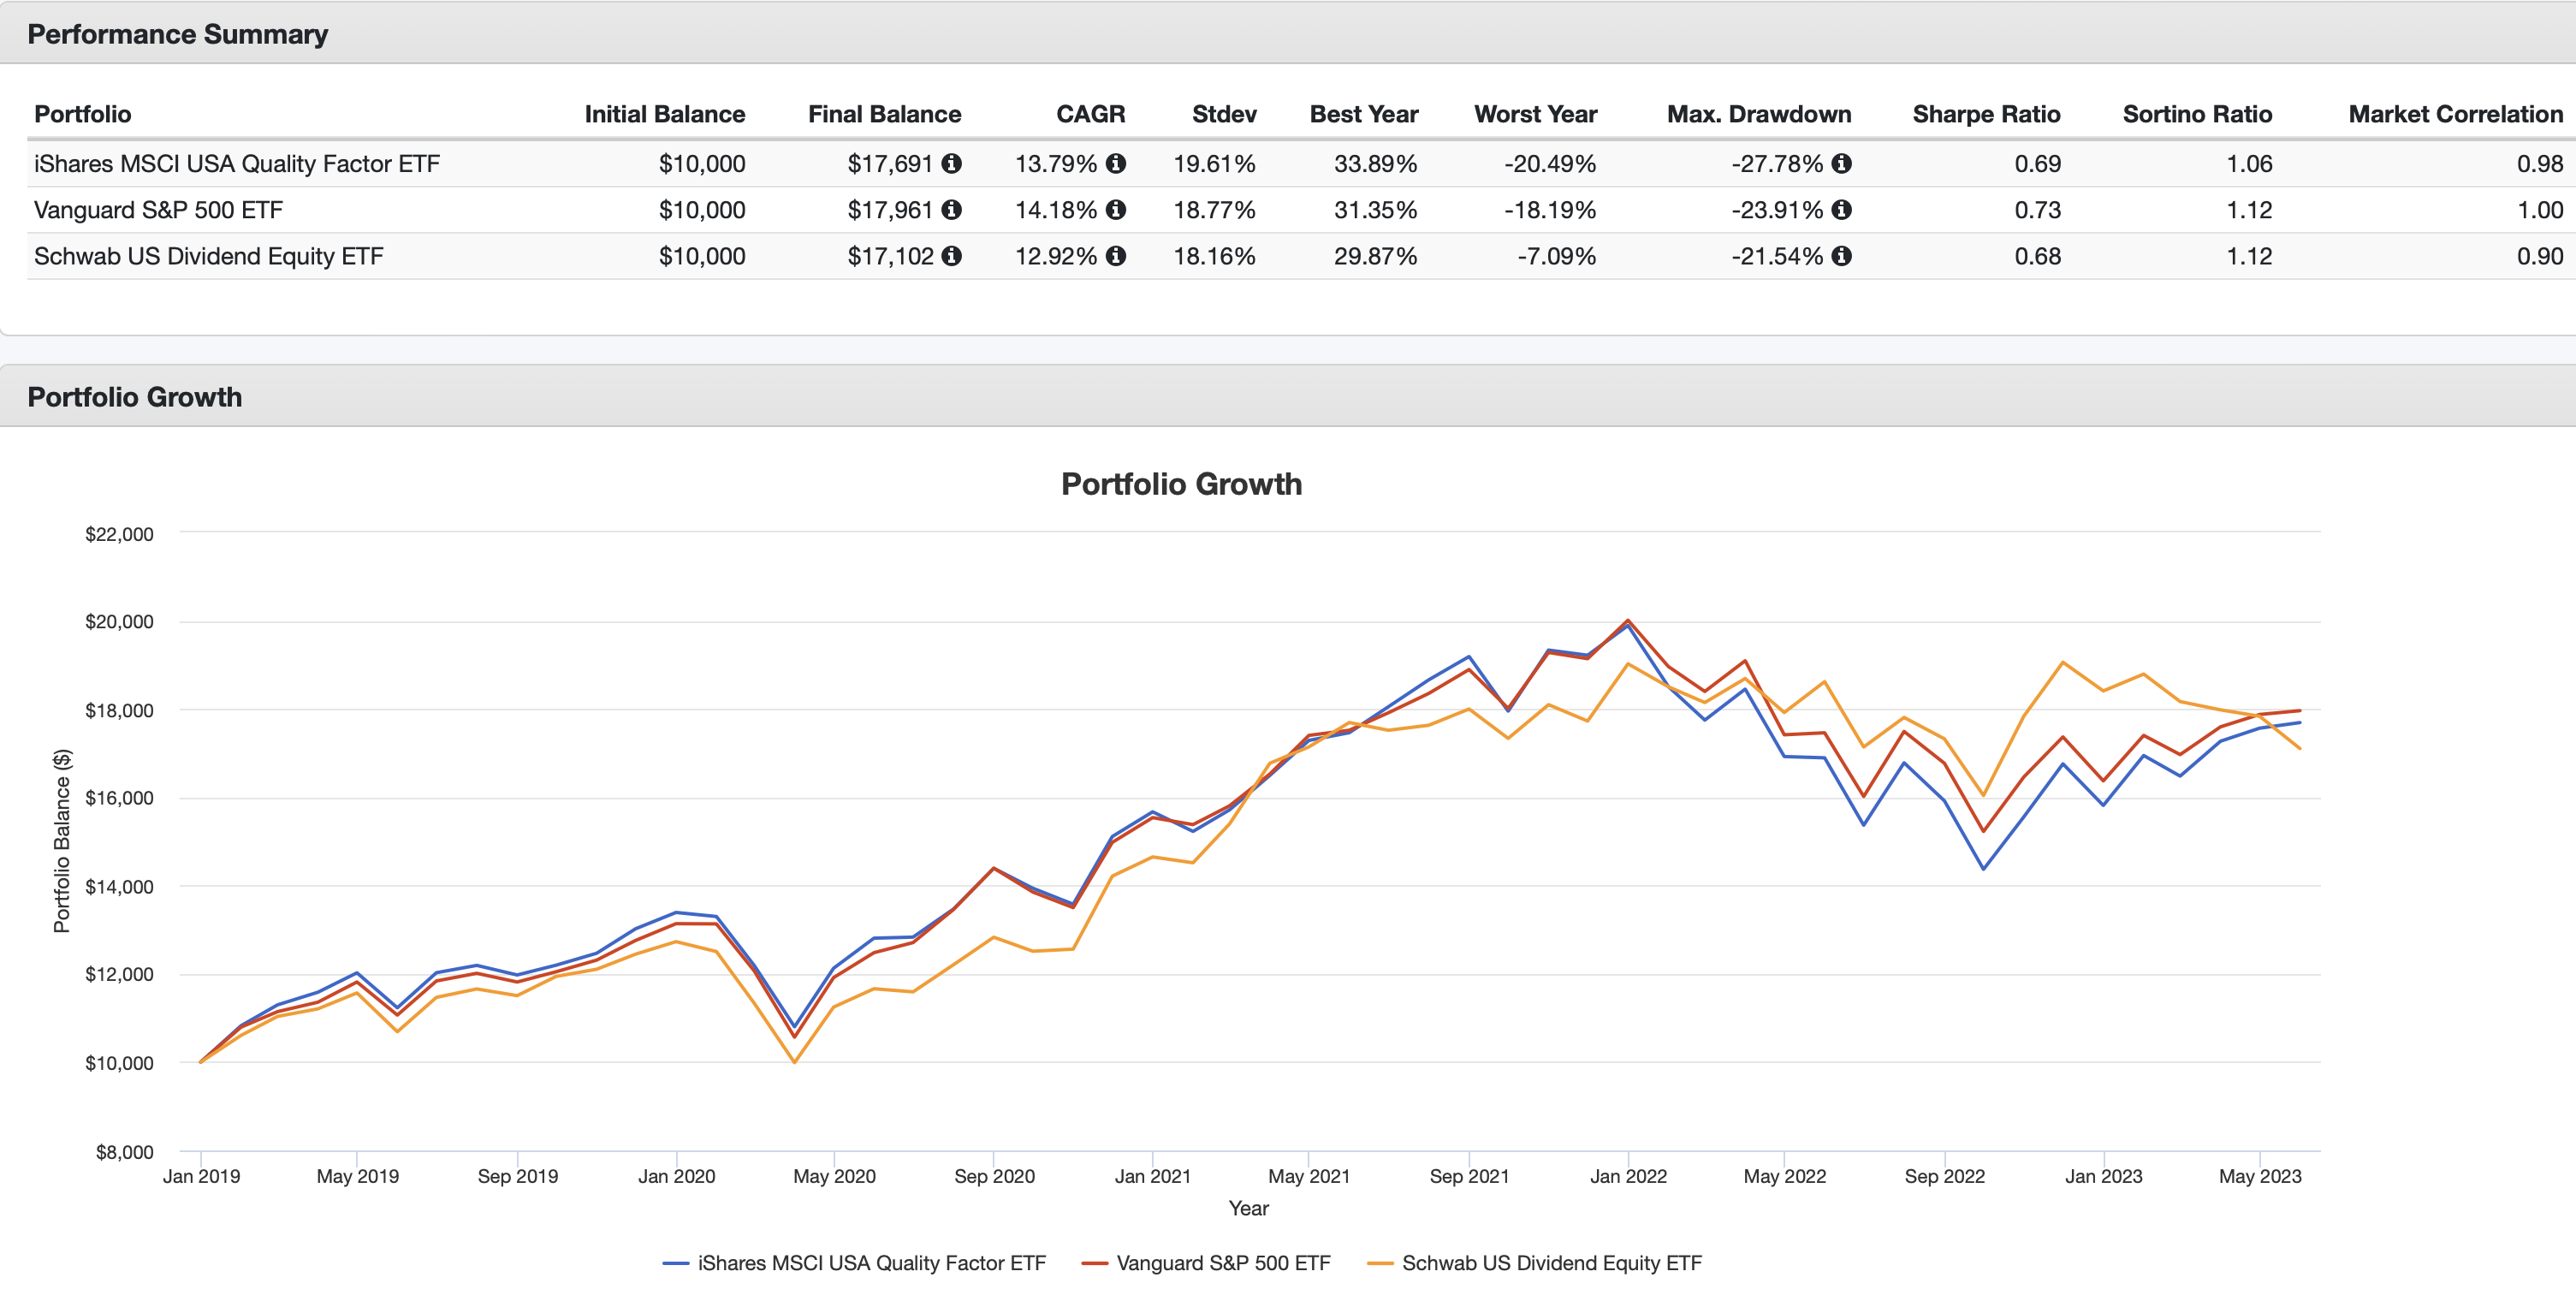
As can be seen in the graphic above, from January 2019 to this precise point in time, QUAL came in second to VOO in terms of absolute, or total, return, slightly edging out SCHD in the process.
However, it produced these results at somewhat of a cost in terms of volatility. QUAL's standard deviation, the worst year, and max drawdown turned out to be the worst of the three. In all cases, QUAL underperformed VOO, a wonderful proxy for simply holding the S&P 500. And SCHD? Of the 3 funds, it played the best defense, so to speak, with lower Max Drawdown and particularly Worst Year results. This is reflected in SCHD's Sortino ratio, a measure of risk-adjusted return that focuses on downside protection.
Finally, one last observation. You may recall my earlier mention of NVIDIA recently leapfrogging everything else to become the top holding in QUAL. Anyone following the investment landscape of late understands full well why this has been the case, as NVDA has benefited to a stunning extent due to its positioning with respect to the future of AI.
In contrast, SCHD has notably underperformed of late, for really the first time in many years. Even here, then, QUAL's recent outperformance could turn out to be somewhat of a mirage, and the long-term advantages of SCHD could return to the fore.
Summary and Conclusion
Putting it all together, then, the conclusion I come to is that, while QUAL's portfolio selection criteria sounds great on paper, its actual results have been somewhat underwhelming. As I noted earlier, even over the longer time period dating back to 2014, you would have done better in either VOO or SCHD.
What about at this precise moment in time? It may boil down to your view of the valuation of AAPL, MSFT, and in particular NVDA. If you believe these will continue to soar, due to AI and other factors, QUAL could be a winner.
On the other hand, if you agree with those who believe that some of these valuations are approaching the absurd level, I would tend to stay away from QUAL at this particular moment.
Setting all of that aside, however, I'm not sure that, even over the longer term, QUAL offers a superior option to several potential competitors, including those referenced in this article.
I hope this review has proved useful to you in making your personal decision. Please, drop a note in the comments section letting me know what you think of my analysis.
ETF Monkey Teams Up With Income Builder
ETF Monkey has teamed up with Hoya Capital to offer the premier income-focused investing service on Seeking Alpha. Members receive complete early access to our articles along with exclusive income-focused model portfolios and a comprehensive suite of tools and models to help build sustainable portfolio income targeting premium dividend yields of up to 10%.

Whether your focus is High Yield or Dividend Growth, we’ve got you covered with actionable investment research focusing on real income-producing asset classes that offer potential diversification, monthly income, capital appreciation, and inflation hedging. Start A Free 2-Week Trial Today!

This article was written by

Analyst’s Disclosure: I/we have a beneficial long position in the shares of SCHD either through stock ownership, options, or other derivatives. I wrote this article myself, and it expresses my own opinions. I am not receiving compensation for it (other than from Seeking Alpha). I have no business relationship with any company whose stock is mentioned in this article.
I am not a registered investment advisor or broker/dealer. Readers are advised that the material contained herein should be used solely for informational purposes, and to consult with their personal tax or financial advisors as to its applicability to their circumstances. Investing involves risk, including the loss of principal.
Seeking Alpha's Disclosure: Past performance is no guarantee of future results. No recommendation or advice is being given as to whether any investment is suitable for a particular investor. Any views or opinions expressed above may not reflect those of Seeking Alpha as a whole. Seeking Alpha is not a licensed securities dealer, broker or US investment adviser or investment bank. Our analysts are third party authors that include both professional investors and individual investors who may not be licensed or certified by any institute or regulatory body.